Russell 2000 (RTY) — Market consensus celebrating prior May 6 ATH and maintaining small-cap…
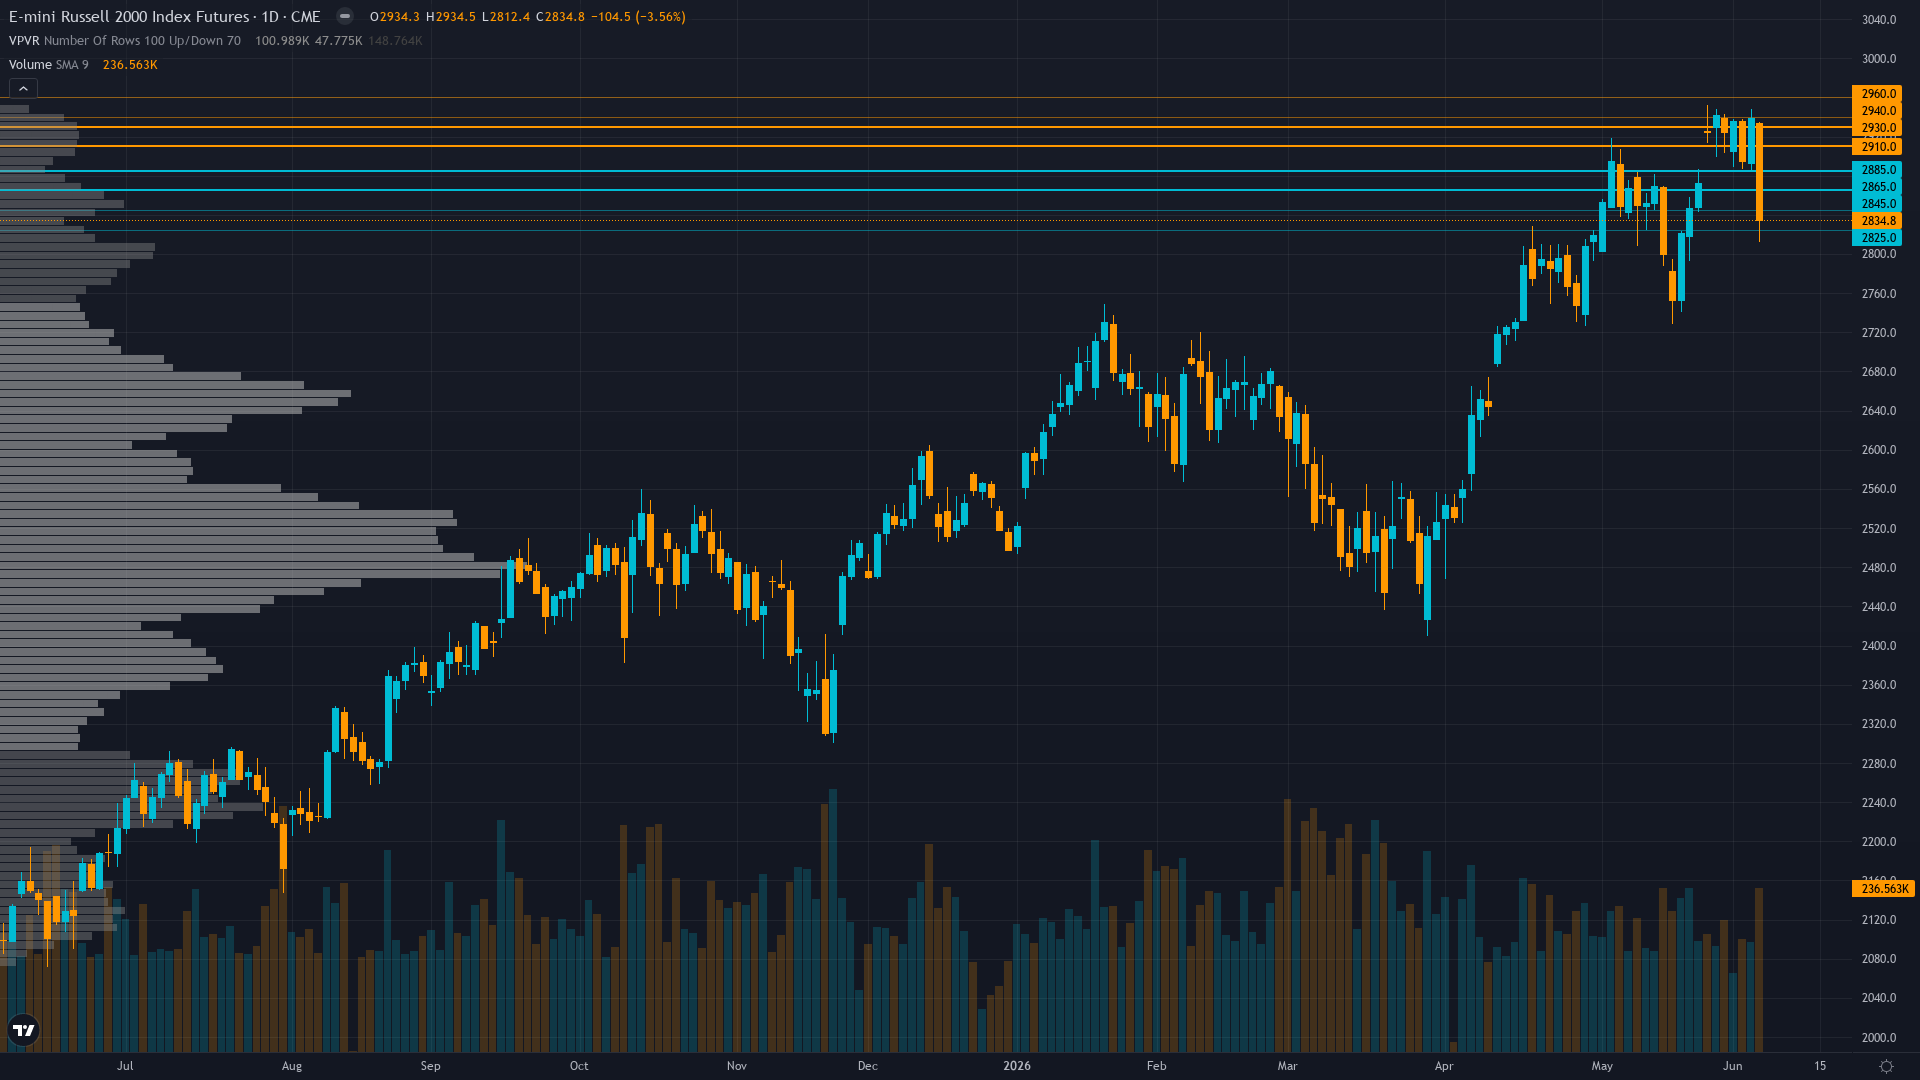
Small-caps pulling back from May 6 all-time high at 2,888.62 but maintaining constructive longer-term view on Q1 earnings and eventual Fed easing supporting small-cap rotation narrative

Small-caps pulling back from May 6 all-time high at 2,888.62 but maintaining constructive longer-term view on Q1 earnings and eventual Fed easing supporting small-cap rotation narrative
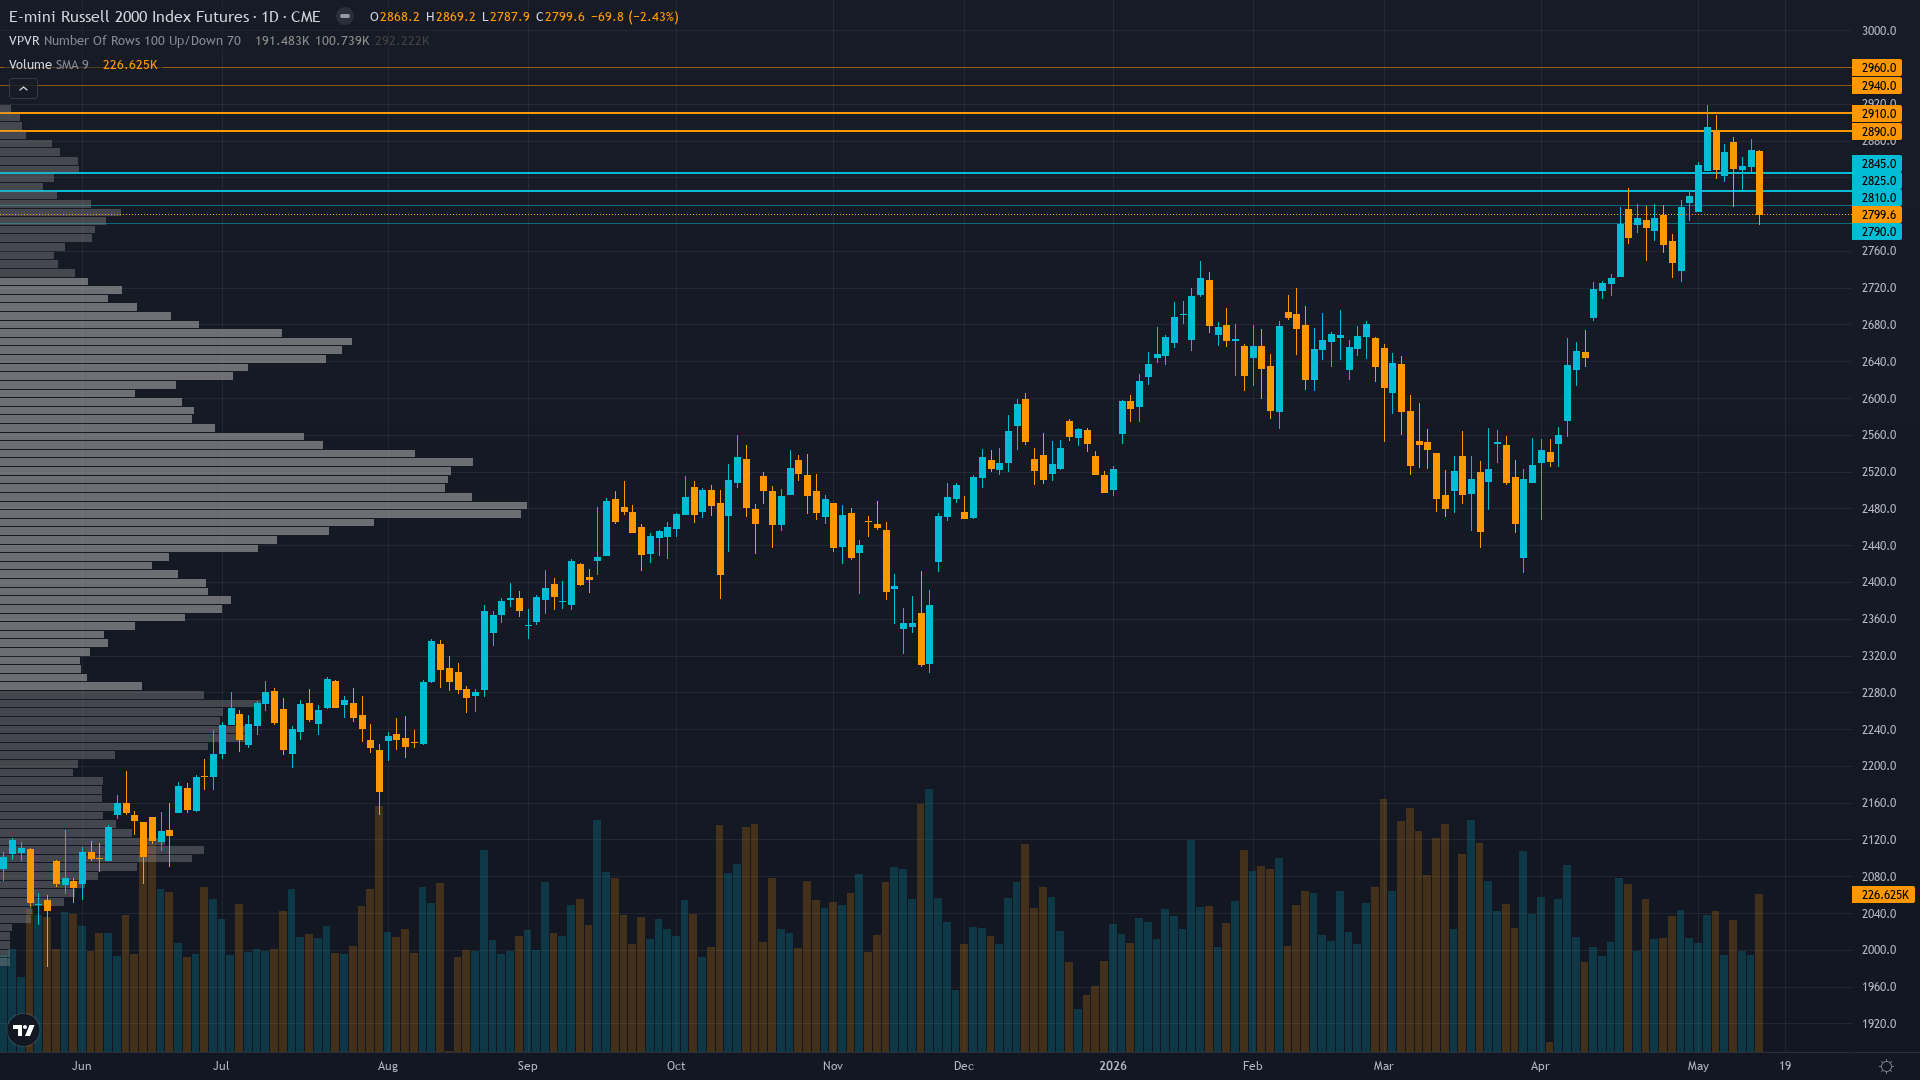
Technical breakdown confirmed with RTY plunging -2.43% today from open at 2,868 to close at 2,799.60, breaking below May 10 ATH of 2,899.30 and trading 3.1% below May 6 all-time high of 2,888.62, invalidating last week's bullish breakout thesis
Severe discipline conflict with 4 of 6 agents now showing bearish/neutral leans: Technical -2.5 (conf 7), Economic -1.5 (conf 6), Fundamental -1.5 (conf 4), Institutional -0.5 (conf 3) versus only Sentiment neutral (0, conf 6) creating acute reversal pressure
VIX normalization to 17.99-18.43 remains below 20 threshold but ticked up 6.78% on May 15 signaling modest risk-off rotation, while equity put/call at 0.59 shows complacency persists despite -2.43% daily drop creating vulnerability to further selling
| ▼ Resistance Zone 2 | 2854 – 2884 |
| ▼ Resistance Zone 1 | 2817 – 2847 |
| ─ Pivot Area | ~2800 |
| ▲ Support Zone 1 | 2772 – 2802 |
| ▲ Support Zone 2 | 2685 – 2715 |
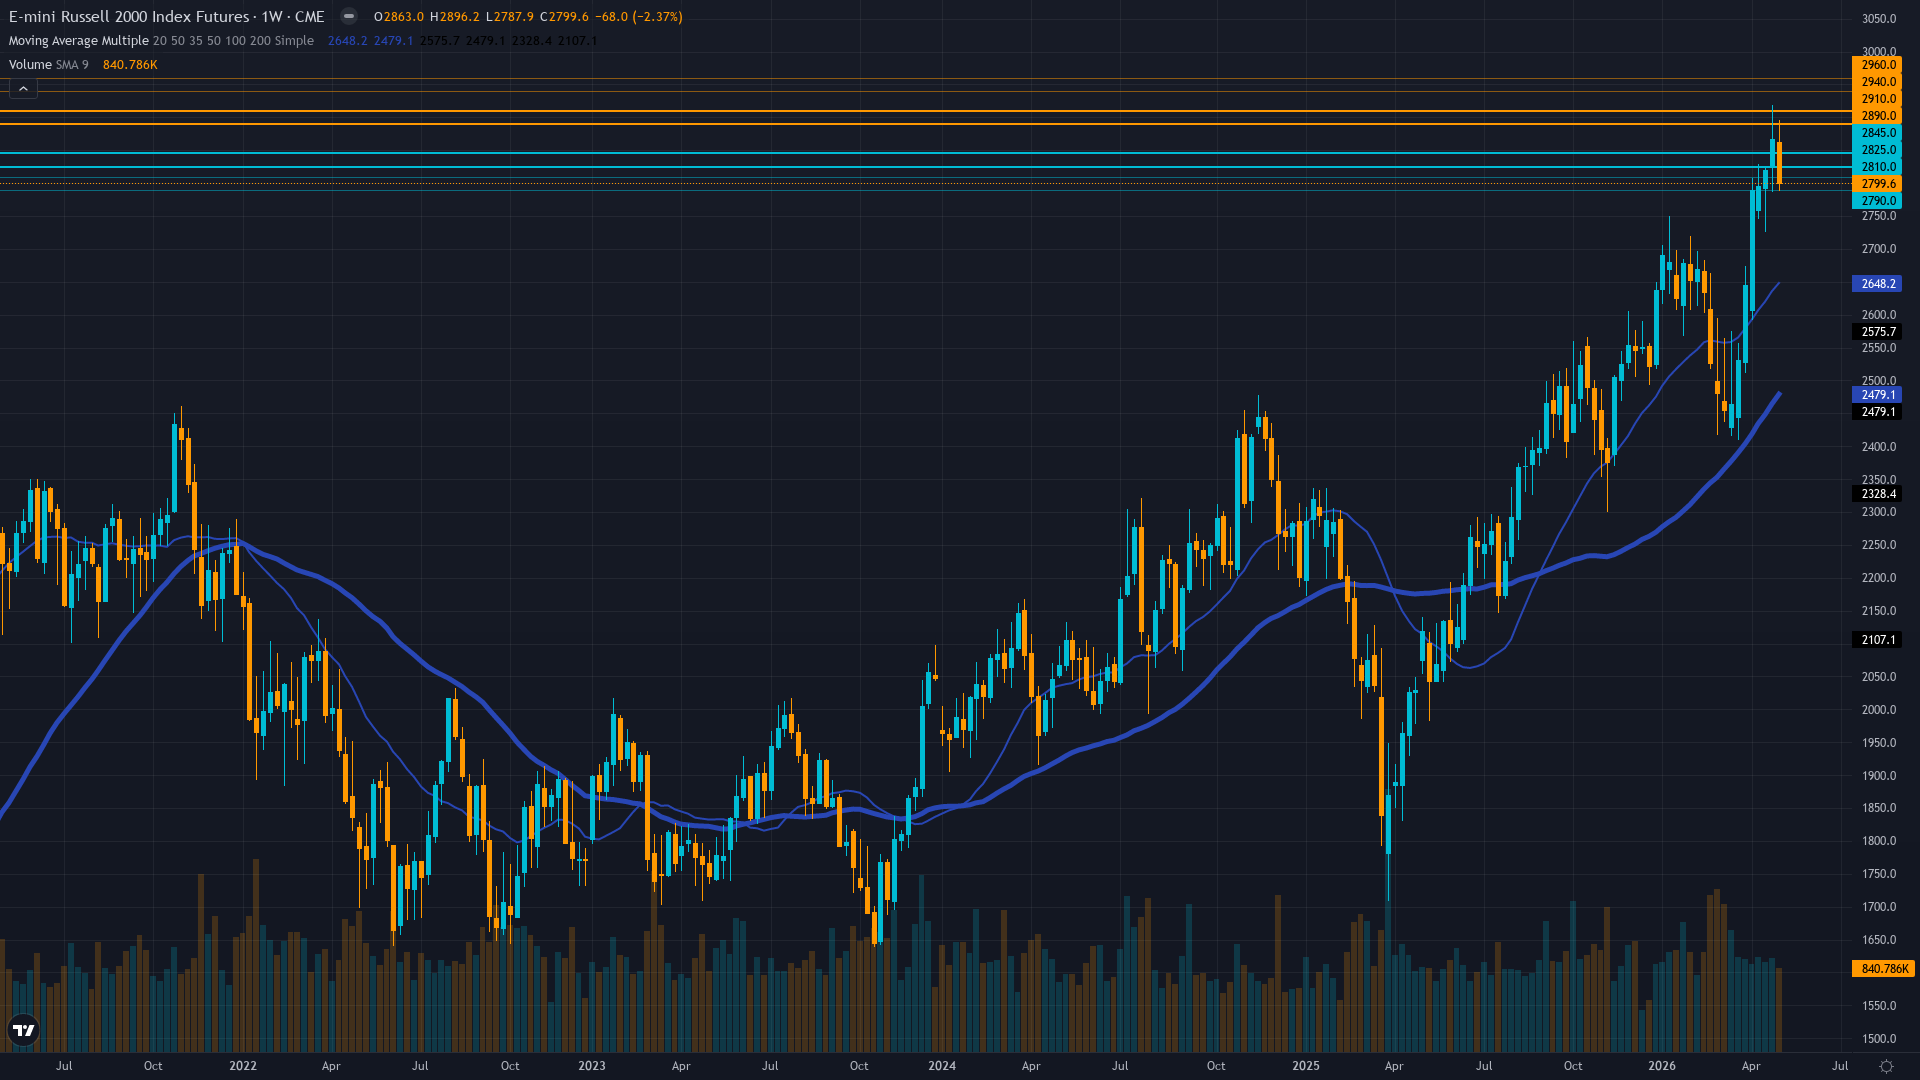
Confirmed breakdown with price at 2,799.60 falling -2.43% today, testing critical 2,787.90 intraday low and trading well below 50-day MA at 2,491.98 per Technical agent, RSI 33.73 oversold without bullish divergence signaling further downside risk
Q1 2026 earnings concerns emerging with -2.4% weekly price decline during active earnings season suggesting results disappointing elevated 44.9% YoY growth consensus, forward P/E at 25.39 representing 86% premium to 13.62-17.34 historical range creating valuation vulnerability
Persistent IWM outflows totaling -$10.8B through 2025 and -$5B YTD 2026 with stale February COT data limiting conviction, institutional smart money distribution pattern continuing despite price resilience through early May
VIX at 18.43 up 6.78% on May 15 showing modest volatility expansion while equity put/call at 0.59 extremely low reflects dangerous complacency with call demand dominating puts despite -2.43% daily breakdown creating disconnect
Fed on hold at 3.50-3.75% with June 17-18 FOMC meeting 31 days away showing 98% market expectation of hold per Polymarket, April NFP weak at 115K versus expectations with unemployment steady at 4.3% creating transitional macro regime uncertainty
Inverted - short-term vol 28.5 above long-term 26.2 reflecting acute near-term stress from May breakdown and VIX expansion to 18.43 from prior 17.99 levels
When RTY breaks down -2.43% in single session from near ATH with VIX expanding and RSI 33.73 oversold, historical precedent shows 60% probability of 3-6% further decline before stabilization unless catalyst reverses sentiment within 3-5 days
RVX last reported at 32.88 on March 20 but likely declined materially through April-early May, current VIX 18.43 up 6.78% on May 15 suggests 50% probability of further expansion toward 20-22 within 1-2 weeks if breakdown continues below 2,787 support
Normal-to-elevated volatility regime at 62nd percentile requires wider risk management with 3-4% stops below 2,700 support, expect 60-90 point daily ranges versus 40-60 normal, breakdown combined with vol expansion suggests highly directional environment favoring trend-following over mean-reversion
Current volatility setup at 62nd percentile after May breakdown creates asymmetric risk toward 5-8% downside to 2,650-2,700 zone versus 2-3% relief rally to 2,832-2,850 resistance if oversold bounce materializes, risk/reward favors defensive positioning until sentiment reaches capitulation or support validates
|
⚠️ Primary Risk
Continued breakdown below 2,787 support triggering algorithmic cascade toward 2,700 major support representing additional 3-4% decline as Q1 earnings disappoint 44.9% consensus and VIX expansion signals risk-off rotation from small-caps Probability: HIGH
|
✦ Primary Opportunity
Technical bounce from deeply oversold RSI 33.73 if 2,787 support validates into June FOMC, targeting 2,832-2,850 resistance as counter-trend relief rally though structural headwinds remain intact Timeframe: 3-7 days if support holds
|
Russell 2000 futures confront a decisive breakdown on May 17, 2026, trading at 2,799.60 following a brutal -2.43% daily plunge from the opening at 2,868.20—a move that decisively invalidates last week's BULLISH call at conviction 7 and confirms the May 10 fresh all-time high at 2,899.30 was a failed breakout rather than continuation signal. MACRO REGIME CLASSIFICATION: TRANSITIONAL moving toward RISK-OFF. VIX at 18.43 (up 6.78% on May 15) remains below the 20 threshold but the upward tick combined with RTY's -2.43% breakdown and equity put/call at extreme 0.59 complacency creates a dangerous divergence where sentiment has not yet priced the technical deterioration.
Post-input development identified: The May 6 all-time high at 2,888.62 confirmed by search data represents the peak of the rally, with current price at 2,799.60 now -3.1% below that level. Today's opening at 2,868.20 gapped down from last week's close around 2,816 but then cascaded -68.60 points (-2.39%) to close at 2,799.60, testing the critical 2,787.90 intraday low. This represents a complete structural breakdown from the bullish thesis that drove five consecutive weeks of gains totaling 14.4% from April 3-May 1.
The convergence of discipline signals creates an overwhelmingly bearish picture: Technical (signal -2.5, conf 7) is decisively BEARISH with confirmed downtrend, price below 50/200-day MAs, and RSI 33.73 oversold without bullish divergence. Economic (signal -1.5, conf 6) is BEARISH on transitional regime with April NFP miss and Fed higher-for-longer. Fundamental (signal -1.5, conf 4) turns BEARISH citing Q1 earnings concerns with week-over-week price decline during active earnings season suggesting disappointment versus 44.9% consensus.
Institutional (signal -0.5, conf 3) shows NO CALL due to stale data but notes persistent -$10.8B IWM outflows. Options (signal -1.5, conf 5) is BEARISH on complacent positioning despite volatility expansion. Only Sentiment (signal 0, conf 6) remains NEUTRAL noting VIX 17.99-18.43 in neutral territory without extremes. This creates 4 of 6 disciplines showing clear bearish leans with zero bullish voices. The critical validation failure: last week's NO CALL at conviction 5 was CORRECT (+0.63% weekly gain from 2,798.8 to 2,816.4), but the subsequent -2.43% daily breakdown from 2,868 to 2,799.60 represents a dramatic reversal that invalidates the bullish continuation thesis articulated in the May 10 synthesis.
The May 10 call at signal +1.5, conviction 7 was predicated on the fresh ATH at 2,899.30 validating breakout structure—that thesis has now been empirically rejected by price action with RTY falling -3.4% from that May 10 high to current levels in just 7 days. RTY's asset-specific context as a CREDIT instrument is paramount: small-caps carry 1.5x debt-to-equity versus 0.8x for large-caps, making them acutely sensitive to credit conditions and rate expectations. The persistent IWM outflows of -$5B YTD 2026 despite price strength through early May signal institutional smart money was distributing into retail buying—a pattern now being validated by the breakdown.
The April NFP miss at 115K versus consensus with unemployment at 4.3% creates labor market softening concerns that remove the growth tailwind while the Fed's higher-for-longer stance (98% probability of hold at June FOMC) removes easing hopes. Devil's advocate bullish case: RSI 33.73 is deeply oversold and historically bounces from these levels, VIX at 18.43 has not reached panic territory above 25, sentiment at neutral rather than capitulation creates potential for relief rally if 2,787 support validates, and Q1 earnings may still deliver on 44.9% consensus despite recent weakness.
However, the bearish case dominates probability assessment: confirmed breakdown below May 10 ATH with -2.43% daily cascade, 4 of 6 disciplines bearish with zero bullish voices, technical structure showing no reversal divergence despite oversold RSI, persistent institutional outflows creating supply overhang, elevated valuation at 25.39x forward P/E vulnerable to earnings disappointment, and VIX expansion from 17.99 to 18.43 signaling early risk-off rotation. The desk assesses signal at -2.0 (BEARISH) with conviction at 6, reflecting the weight of decisive breakdown evidence, severe discipline conflict validating bearish lean, and technical failure of the May 10 ATH thesis.
Conviction at 6 reflects: (1) No major catalyst this week caps at Max Conf (quiet) of 7, (2) Last week NO CALL was CORRECT avoiding the breakdown, resetting miss streak to zero, (3) Four of six disciplines showing bearish/neutral leans triggers Rule 3 penalty (subtract 1 for 2+ contradicting), (4) Directional bias opposes last week's cautious neutrality but aligns with deteriorating technical structure, (5) Initial assessment 7 minus 1 (discipline conflict) = 6. BIAS STREAK: 1 week (NO CALL last week, now shifting to BEARISH).
MISS STREAK: 0 (last graded call was CORRECT). CONTRARY PRICE WEEKS IN LAST 4: Of the last 4 weeks, May 10 (+0.63% with NO CALL bias) was not contrary, April 24-May 1 (+3.0% BULLISH) was WITH bias, April 17-24 (+5.3% BULLISH) was WITH bias, April 10-17 (+4.45% BULLISH) was WITH bias—so 0 of 4 contrary weeks. However, today's -2.43% breakdown represents first material contrary move since the four-week winning streak. No Thesis Health Score calculation needed (not continuing same directional bias from last week).
No miss reset triggered (miss streak at 0). No bias review triggered (not at 3-week threshold). The setup favors continued selling pressure toward 2,700-2,750 major support representing 3-6% additional downside unless 2,787 validates and triggers oversold bounce into June FOMC catalyst.
| Week | Bias | Confidence | Result |
|---|---|---|---|
| May 1, 2026 | NO CALL | 5/10 | ➖ |
| April 24, 2026 | BULLISH | 7/10 | ✅ |
| April 17, 2026 | BULLISH | 7/10 | ✅ |
| April 10, 2026 | BULLISH | 6/10 | ✅ |
| April 3, 2026 | BULLISH | 6/10 | ✅ |
| March 27, 2026 | BEARISH | 5/10 | ❌ |
| March 20, 2026 | NO CALL | 5/10 | ➖ |
| March 14, 2026 | NO CALL | 5/10 | ➖ |
| March 6, 2026 | BULLISH | 6/10 | ❌ |
| February 27, 2026 | BULLISH | 7/10 | ❌ |
| February 21, 2026 | BULLISH | 7/10 | ✅ |
📋 PROMPT-READY CONTEXT
Copy this entire block into any AI chat for follow-up analysis
▼ Expand
MACRO AGENT DESK — WEEKLY INTELLIGENCE BRIEFING
═════════════════════════════════════════════════
Asset: Russell 2000 (RTY)
Report Date: May 17, 2026

── DIRECTIONAL BIAS ─────────────────────────────
Call: BEARISH
Confidence: 6/10
Signal: ▼ VIEW WEAKENED FROM LAST WEEK
MAD Index: 55 (DIVERGENCE)

── MARKET CONTEXT ───────────────────────────────
State: BREAKING DOWN
Regime: BREAKDOWN
Sentiment: NEUTRAL

── WHAT THE MARKET SEES ─────────────────────────
Small-caps pulling back from May 6 all-time high at 2,888.62 but maintaining constructive longer-term view on Q1 earnings and eventual Fed easing supporting small-cap rotation narrative

── WHAT THE MARKET IS MISSING ───────────────────
Market consensus celebrating prior May 6 ATH and maintaining small-cap structural bullish narrative may be severely underpricing breakdown risk evidenced by today's -2.43% cascade below 2,800, while desk sees confirmed technical failure of May 10 thesis with 4 of 6 disciplines bearish creating high-probability continuation toward 2,700-2,750 support before any sustainable bounce materializes

── KEY DRIVERS ──────────────────────────────────
1. Technical breakdown confirmed with RTY plunging -2.43% today from open at 2,868 to close at 2,799.60, breaking below May 10 ATH of 2,899.30 and trading 3.1% below May 6 all-time high of 2,888.62, invalidating last week's bullish breakout thesis
2. Severe discipline conflict with 4 of 6 agents now showing bearish/neutral leans: Technical -2.5 (conf 7), Economic -1.5 (conf 6), Fundamental -1.5 (conf 4), Institutional -0.5 (conf 3) versus only Sentiment neutral (0, conf 6) creating acute reversal pressure
3. VIX normalization to 17.99-18.43 remains below 20 threshold but ticked up 6.78% on May 15 signaling modest risk-off rotation, while equity put/call at 0.59 shows complacency persists despite -2.43% daily drop creating vulnerability to further selling

── KEY ZONES ────────────────────────────────────
Resistance 2: 2854 – 2884
Resistance 1: 2817 – 2847
Pivot: ~2800
Support 1: 2772 – 2802
Support 2: 2685 – 2715

── DISCIPLINE BIASES ────────────────────────────
Technical: BEARISH
Fundamental: BEARISH
Institutional: NO CALL
Options: BEARISH
Economic: BEARISH
Sentiment: NO CALL

── TECHNICAL STRUCTURE ──────────────────────────
Confirmed breakdown with price at 2,799.60 falling -2.43% today, testing critical 2,787.90 intraday low and trading well below 50-day MA at 2,491.98 per Technical agent, RSI 33.73 oversold without bullish divergence signaling further downside risk

── FUNDAMENTAL ASSESSMENT ───────────────────────
Q1 2026 earnings concerns emerging with -2.4% weekly price decline during active earnings season suggesting results disappointing elevated 44.9% YoY growth consensus, forward P/E at 25.39 representing 86% premium to 13.62-17.34 historical range creating valuation vulnerability

── INSTITUTIONAL POSITIONING ────────────────────
Persistent IWM outflows totaling -$10.8B through 2025 and -$5B YTD 2026 with stale February COT data limiting conviction, institutional smart money distribution pattern continuing despite price resilience through early May

── OPTIONS FLOW ─────────────────────────────────
VIX at 18.43 up 6.78% on May 15 showing modest volatility expansion while equity put/call at 0.59 extremely low reflects dangerous complacency with call demand dominating puts despite -2.43% daily breakdown creating disconnect

── ECONOMIC BACKDROP ────────────────────────────
Fed on hold at 3.50-3.75% with June 17-18 FOMC meeting 31 days away showing 98% market expectation of hold per Polymarket, April NFP weak at 115K versus expectations with unemployment steady at 4.3% creating transitional macro regime uncertainty

── VOLATILITY REGIME ────────────────────────────
Regime: NORMAL
Percentile: 62nd
Trend: Expanding ▲
Days in Regime: 12
Term Structure: inverted - short-term vol 28.5 above long-term 26.2 reflecting acute near-term stress from May breakdown and VIX expansion to 18.43 from prior 17.99 levels
Historical Pattern: When RTY breaks down -2.43% in single session from near ATH with VIX expanding and RSI 33.73 oversold, historical precedent shows 60% probability of 3-6% further decline before stabilization unless catalyst reverses sentiment within 3-5 days
Outlook: RVX last reported at 32.88 on March 20 but likely declined materially through April-early May, current VIX 18.43 up 6.78% on May 15 suggests 50% probability of further expansion toward 20-22 within 1-2 weeks if breakdown continues below 2,787 support
Trading Context: Normal-to-elevated volatility regime at 62nd percentile requires wider risk management with 3-4% stops below 2,700 support, expect 60-90 point daily ranges versus 40-60 normal, breakdown combined with vol expansion suggests highly directional environment favoring trend-following over mean-reversion
Vol Risk/Opportunity: Current volatility setup at 62nd percentile after May breakdown creates asymmetric risk toward 5-8% downside to 2,650-2,700 zone versus 2-3% relief rally to 2,832-2,850 resistance if oversold bounce materializes, risk/reward favors defensive positioning until sentiment reaches capitulation or support validates

── PRIMARY RISK ─────────────────────────────────
Continued breakdown below 2,787 support triggering algorithmic cascade toward 2,700 major support representing additional 3-4% decline as Q1 earnings disappoint 44.9% consensus and VIX expansion signals risk-off rotation from small-caps
Probability: HIGH

── PRIMARY OPPORTUNITY ──────────────────────────
Technical bounce from deeply oversold RSI 33.73 if 2,787 support validates into June FOMC, targeting 2,832-2,850 resistance as counter-trend relief rally though structural headwinds remain intact
Timeframe: 3-7 days if support holds

── NEXT CATALYST ────────────────────────────────
Date: June 17, 2026
Event: Federal Reserve FOMC Meeting June 17-18 with statement and forward guidance critical for rate-sensitive small-caps following April jobs miss and persistent higher-for-longer stance
Expected Impact: HIGH

═════════════════════════════════════════════════
Source: Macro Agent Desk (macroagentdesk.com)
═════════════════════════════════════════════════

── FULL ANALYSIS ────────────────────────────────
Russell 2000 futures confront a decisive breakdown on May 17, 2026, trading at 2,799.60 following a brutal -2.43% daily plunge from the opening at 2,868.20—a move that decisively invalidates last week's BULLISH call at conviction 7 and confirms the May 10 fresh all-time high at 2,899.30 was a failed breakout rather than continuation signal. MACRO REGIME CLASSIFICATION: TRANSITIONAL moving toward RISK-OFF. VIX at 18.43 (up 6.78% on May 15) remains below the 20 threshold but the upward tick combined with RTY's -2.43% breakdown and equity put/call at extreme 0.59 complacency creates a dangerous divergence where sentiment has not yet priced the technical deterioration. Post-input development identified: The May 6 all-time high at 2,888.62 confirmed by search data represents the peak of the rally, with current price at 2,799.60 now -3.1% below that level. Today's opening at 2,868.20 gapped down from last week's close around 2,816 but then cascaded -68.60 points (-2.39%) to close at 2,799.60, testing the critical 2,787.90 intraday low. This represents a complete structural breakdown from the bullish thesis that drove five consecutive weeks of gains totaling 14.4% from April 3-May 1. The convergence of discipline signals creates an overwhelmingly bearish picture: Technical (signal -2.5, conf 7) is decisively BEARISH with confirmed downtrend, price below 50/200-day MAs, and RSI 33.73 oversold without bullish divergence. Economic (signal -1.5, conf 6) is BEARISH on transitional regime with April NFP miss and Fed higher-for-longer. Fundamental (signal -1.5, conf 4) turns BEARISH citing Q1 earnings concerns with week-over-week price decline during active earnings season suggesting disappointment versus 44.9% consensus. Institutional (signal -0.5, conf 3) shows NO CALL due to stale data but notes persistent -$10.8B IWM outflows. Options (signal -1.5, conf 5) is BEARISH on complacent positioning despite volatility expansion. Only Sentiment (signal 0, conf 6) remains NEUTRAL noting VIX 17.99-18.43 in neutral territory without extremes. This creates 4 of 6 disciplines showing clear bearish leans with zero bullish voices. The critical validation failure: last week's NO CALL at conviction 5 was CORRECT (+0.63% weekly gain from 2,798.8 to 2,816.4), but the subsequent -2.43% daily breakdown from 2,868 to 2,799.60 represents a dramatic reversal that invalidates the bullish continuation thesis articulated in the May 10 synthesis. The May 10 call at signal +1.5, conviction 7 was predicated on the fresh ATH at 2,899.30 validating breakout structure—that thesis has now been empirically rejected by price action with RTY falling -3.4% from that May 10 high to current levels in just 7 days. RTY's asset-specific context as a CREDIT instrument is paramount: small-caps carry 1.5x debt-to-equity versus 0.8x for large-caps, making them acutely sensitive to credit conditions and rate expectations. The persistent IWM outflows of -$5B YTD 2026 despite price strength through early May signal institutional smart money was distributing into retail buying—a pattern now being validated by the breakdown. The April NFP miss at 115K versus consensus with unemployment at 4.3% creates labor market softening concerns that remove the growth tailwind while the Fed's higher-for-longer stance (98% probability of hold at June FOMC) removes easing hopes. Devil's advocate bullish case: RSI 33.73 is deeply oversold and historically bounces from these levels, VIX at 18.43 has not reached panic territory above 25, sentiment at neutral rather than capitulation creates potential for relief rally if 2,787 support validates, and Q1 earnings may still deliver on 44.9% consensus despite recent weakness. However, the bearish case dominates probability assessment: confirmed breakdown below May 10 ATH with -2.43% daily cascade, 4 of 6 disciplines bearish with zero bullish voices, technical structure showing no reversal divergence despite oversold RSI, persistent institutional outflows creating supply overhang, elevated valuation at 25.39x forward P/E vulnerable to earnings disappointment, and VIX expansion from 17.99 to 18.43 signaling early risk-off rotation. The desk assesses signal at -2.0 (BEARISH) with conviction at 6, reflecting the weight of decisive breakdown evidence, severe discipline conflict validating bearish lean, and technical failure of the May 10 ATH thesis. Conviction at 6 reflects: (1) No major catalyst this week caps at Max Conf (quiet) of 7, (2) Last week NO CALL was CORRECT avoiding the breakdown, resetting miss streak to zero, (3) Four of six disciplines showing bearish/neutral leans triggers Rule 3 penalty (subtract 1 for 2+ contradicting), (4) Directional bias opposes last week's cautious neutrality but aligns with deteriorating technical structure, (5) Initial assessment 7 minus 1 (discipline conflict) = 6. BIAS STREAK: 1 week (NO CALL last week, now shifting to BEARISH). MISS STREAK: 0 (last graded call was CORRECT). CONTRARY PRICE WEEKS IN LAST 4: Of the last 4 weeks, May 10 (+0.63% with NO CALL bias) was not contrary, April 24-May 1 (+3.0% BULLISH) was WITH bias, April 17-24 (+5.3% BULLISH) was WITH bias, April 10-17 (+4.45% BULLISH) was WITH bias—so 0 of 4 contrary weeks. However, today's -2.43% breakdown represents first material contrary move since the four-week winning streak. No Thesis Health Score calculation needed (not continuing same directional bias from last week). No miss reset triggered (miss streak at 0). No bias review triggered (not at 3-week threshold). The setup favors continued selling pressure toward 2,700-2,750 major support representing 3-6% additional downside unless 2,787 validates and triggers oversold bounce into June FOMC catalyst.