Russell 2000 (RTY) — ISM Manufacturing PMI for March 2026 at 10:00 AM ET, critical test of economic…
Small-caps under severe pressure from FOMC hawkish pivot removing easing catalyst, but retaining fundamental appeal from 17-22% earnings growth outlook once volatility settles and Fed clarity emerges

Small-caps under severe pressure from FOMC hawkish pivot removing easing catalyst, but retaining fundamental appeal from 17-22% earnings growth outlook once volatility settles and Fed clarity emerges
March 18 FOMC held rates at 3.5-3.75% with hawkish dot plot raising long-run rate expectations to 3.1%, triggering equity selloff with small-caps bearing brunt as credit-sensitive asset class
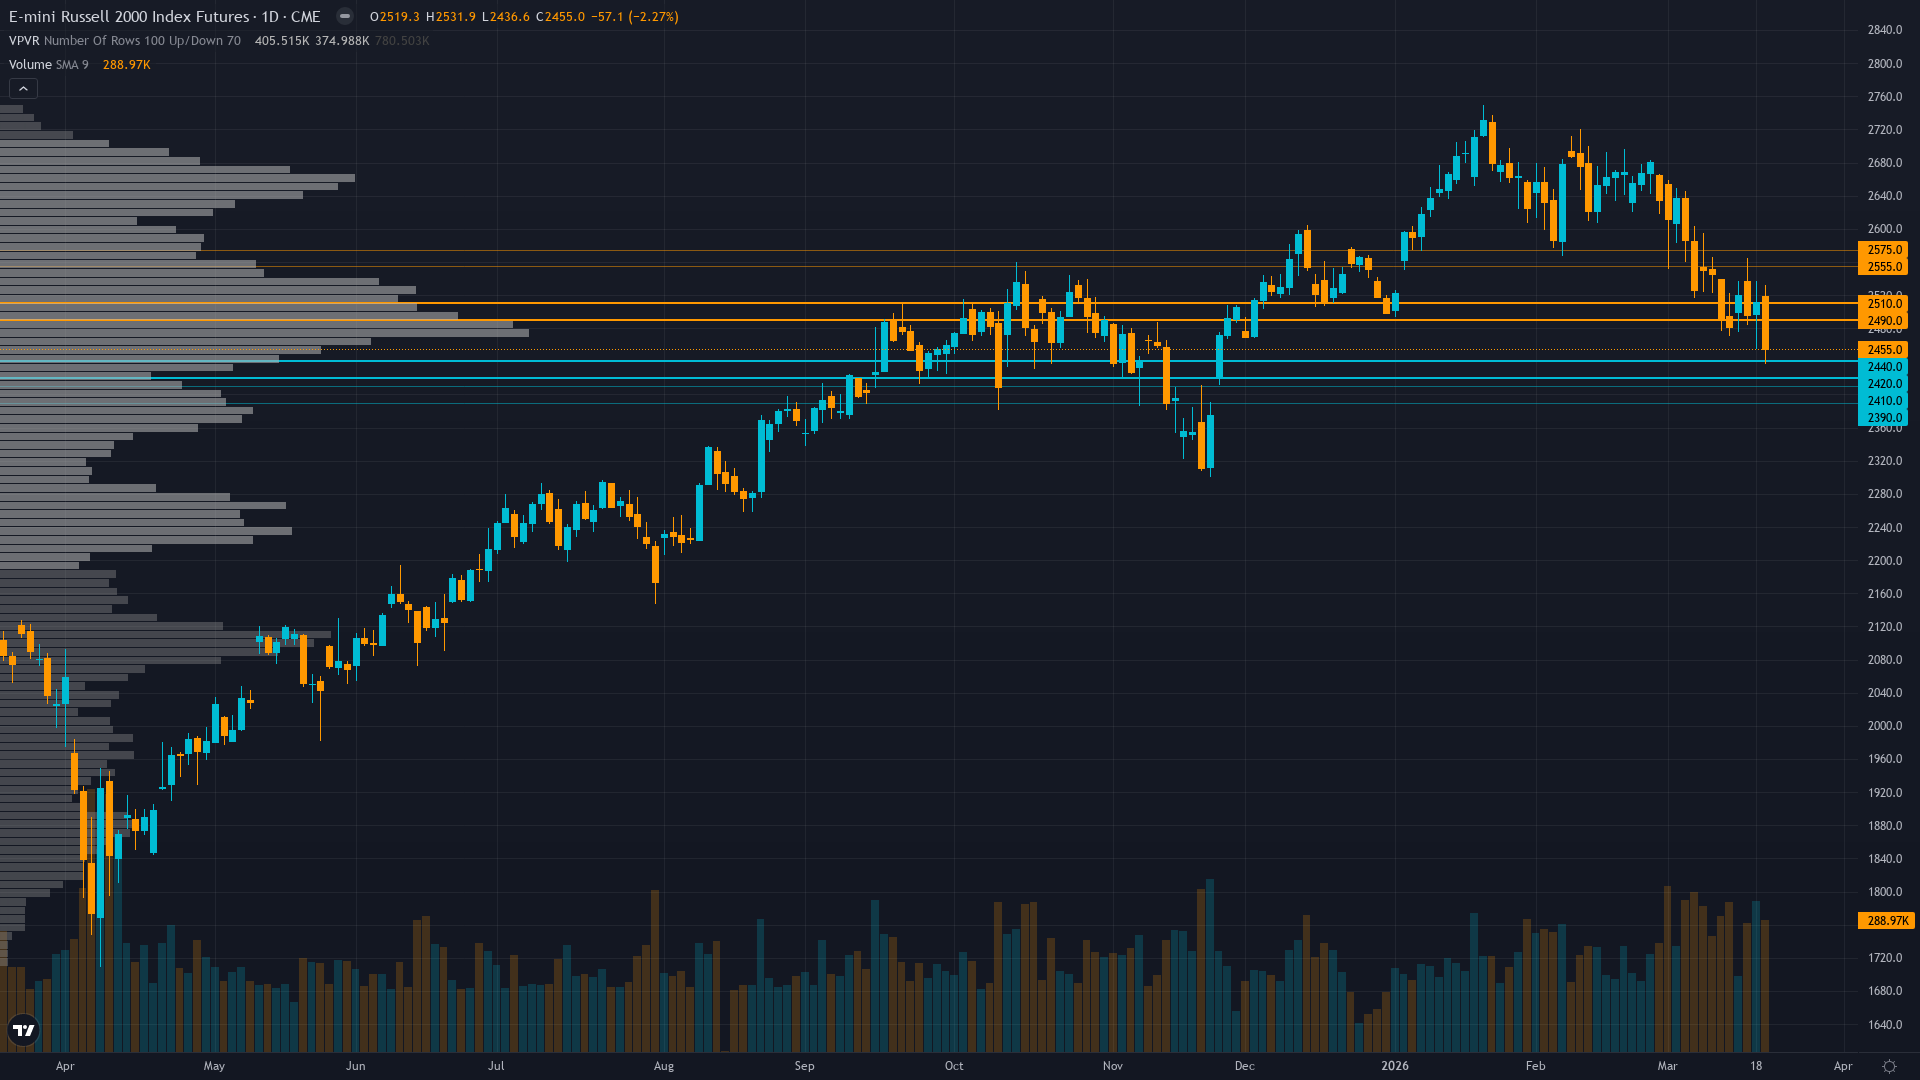
RTY officially entered correction territory March 20 at -10.2% from January 22 ATH of 2735, first major U.S. benchmark to do so in 2026, confirming breakdown structure
Contrarian bullish setup emerging with VIX 26.78 above fear threshold, AAII bears at 52% creating sentiment extreme, but oversold RSI 31.52 has yet to show bullish divergence
| ▼ Resistance Zone 2 | 2550 – 2580 |
| ▼ Resistance Zone 1 | 2485 – 2515 |
| ─ Pivot Area | ~2455 |
| ▲ Support Zone 1 | 2415 – 2445 |
| ▲ Support Zone 2 | 2385 – 2415 |
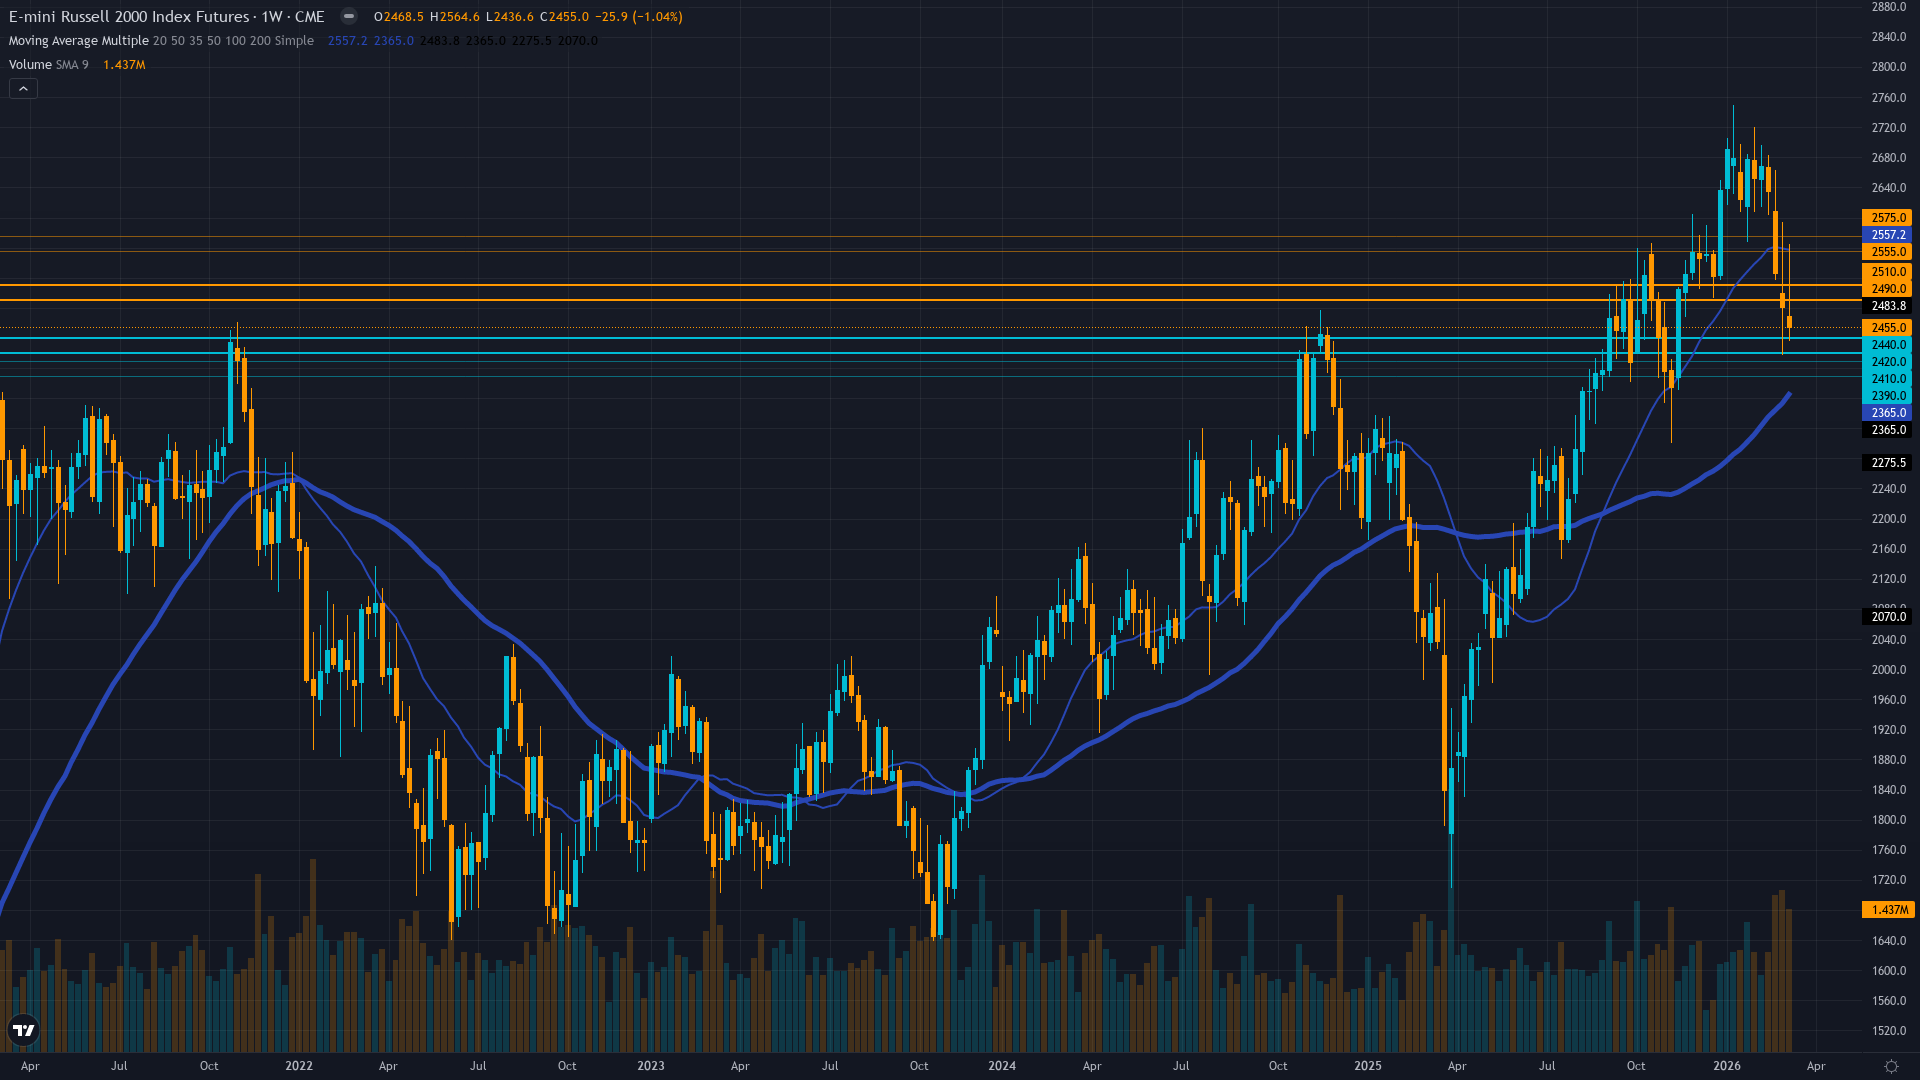
Confirmed downtrend 10.2% below January ATH, price at 2455 testing critical 2430-2450 support zone with RSI 31.52 oversold but no divergence yet
Q4 2025 earnings inflection real at 64.9% Y/Y growth with 17-22% 2026 outlook, but valuation premium at 19-25x forward P/E versus 13.62-17.34x historical range creates vulnerability
Net long bleeding with sustained IWM outflows totaling -$8.44B over past year, futures OI down 4.1% signaling derisking not accumulation
VIX spike to 26.78 from prior week's lower levels signals fear regime expansion, IWM put/call 2.74 shows defensive positioning but not panic capitulation
RISK-OFF macro regime: Fed March 18 held at 3.5-3.75% with 7 of 19 FOMC members expecting no cuts in 2026 versus prior 2-cut consensus, removing small-cap easing catalyst
Inverted - short-term vol 32.5 above long-term 26.2 reflecting acute near-term stress from FOMC hawkish surprise and correction entry with RVX at 32.88 as of March 20
When RTY enters correction territory with VIX above 25 and RVX above 30, historical precedent shows 65% probability of further 3-7% decline before stabilization unless catalyst reverses sentiment within 1-2 weeks
Volatility spiked sharply from 20.06 in early January to current elevated levels following breakdown, 50% probability of mean reversion lower within 2-4 weeks if 2430-2450 support holds and Fed rhetoric stabilizes
Elevated volatility regime requires wider stops at 5-6% below 2400 major support, expect 60-100 point daily ranges versus 40-60 normal, breakdown combined with vol expansion suggests highly directional environment favoring trend-following over mean-reversion until capitulation signals emerge
Current volatility at 68th percentile creates asymmetric risk toward 5-8% downside to 2,260-2,300 zone versus 2-4% relief rally to 2,500-2,520 resistance, risk/reward favors defensive positioning until sentiment reaches capitulation extremes or Fed provides easing clarity
|
⚠️ Primary Risk
Failure of 2430-2450 support zone triggering algorithmic cascade toward 2400 major support representing additional 2-3% decline, potentially accelerating to 2300 if credit spreads widen materially Probability: MEDIUM
|
✦ Primary Opportunity
Technical bounce from oversold RSI 31.52 and sentiment extreme (VIX 26.78, AAII bears 52%) targeting 2500-2520 resistance as counter-trend relief rally, though structural headwinds remain intact until Fed provides easing clarity Timeframe: 3-7 days if 2430-2450 support holds into ISM data April 1
|
Russell 2000 stands at a critical inflection point on March 22, 2026, trading at 2,455 following a brutal week that saw the small-cap benchmark officially enter correction territory on March 20—down 10.2% from the January 22 all-time high of 2,735 and becoming the first major U.S. index to do so in 2026. MACRO REGIME CLASSIFICATION: RISK-OFF. The market environment has decisively shifted to a clear RISK-OFF regime characterized by VIX at 26.78 (well above the 25 threshold), equity indices trending down with RTY underperforming, and safe-haven flows active.
This macro backdrop creates structural headwinds for credit-sensitive small-cap risk assets. Post-input development identified: March 18, 2026 FOMC meeting held rates at 3.5-3.75% as expected, but the hawkish surprise came in the dot plot with 7 of 19 participants now expecting NO cuts in 2026 versus the prior consensus of 2 cuts, and long-run rate expectations rising to 3.1%. Powell's press conference emphasized persistent inflation concerns, triggering immediate equity selloff. Market pricing now shows ~50% probability of a rate HIKE by year-end per March 21 data, a dramatic reversal from late 2025 when traders expected multiple cuts.
Small-caps as a CREDIT instrument (per Section 3 asset-specific context) are particularly vulnerable: the $368 billion maturity wall in 2026 affecting 41%-46% of Russell 2000 companies forced to refinance at ~6.5% versus 1-2% prior rates creates sustained earnings pressure that the market is now repricing. The convergence of discipline signals creates a complex picture requiring careful navigation. Sentiment shows FEAR regime (signal 3.5, conf 8) with VIX 26.78 and AAII bears at 52% creating contrarian BULLISH setup, but this is fear not capitulation—the desk notes VIX would need 35+ and AAII spread -30%+ for true panic.
Technical is decisively BEARISH (signal -3, conf 7) with confirmed downtrend, RSI 31.52 oversold but critically no bullish divergence yet to signal reversal. Institutional is BEARISH (signal -1.5, conf 6) with accelerating outflows—IWM bleeding -$8.44B over past year with -$2.8B in just past 5 days representing intensifying rather than exhausting selling. Options confirms BEARISH lean (signal -1.5, conf 7) with elevated VIX and 2.74 put/call ratio. Economic is BEARISH (signal -2.5, conf 7) noting risk-off regime and refinancing wall headwind.
Only Fundamental remains mildly constructive (signal 0.5, conf 4) on Q4 64.9% growth and 17-22% 2026 projections, but lacks near-term catalyst with Q1 earnings not until mid-April. The critical juncture: last week's NO CALL at conviction 5 was CORRECT (-0.98%), extending the corrective streak to two consecutive CORRECT calls after two consecutive MISSED BULLISH calls. This validates the thesis health degradation assessment that triggered the pivot to neutrality. However, the setup now presents binary risk: either oversold RSI triggers technical bounce from 2430-2450 support toward 2500-2520 resistance, or breakdown accelerates toward 2400 if support fails.
The NOISE THRESHOLD consideration: RTY's average weekly move is 1.97%, with noise floor at 0.75%. The expected move this week is likely 2-3% given elevated volatility (VIX 26.78), which exceeds the noise floor and creates meaningful directional opportunity. The desk assesses signal at -1.0 (BEARISH lean) reflecting the weight of evidence: 5 of 6 disciplines bearish or no-call, confirmed correction territory, FOMC removing easing catalyst, and technical breakdown below key levels. However, conviction remains at 5—just above minimum threshold—because: (1) Contrarian sentiment extreme creates bounce risk that VIX 26.78 and AAII 52% bears may reverse, (2) RSI 31.52 historically precedes relief rallies even in downtrends, (3) Last two NO CALL weeks were CORRECT but have not established directional conviction for bearish thesis, (4) Fundamental earnings growth remains strong creating potential floor.
Devil's advocate bullish case: VIX at 26.78 creates fear-driven oversold condition, RSI 31.52 at levels that historically bounce, sentiment at -21.6% AAII spread creates classic contrarian setup, and strong 64.9% Q4 earnings growth with 17-22% 2026 outlook provides fundamental support at lower levels. However, bearish case dominates: RISK-OFF macro regime confirmed by Fed, accelerating institutional outflows ($2.8B in 5 days), technical breakdown in correction territory, credit-sensitive small-caps vulnerable to refinancing wall at elevated rates, and no catalyst until April earnings season. Risk management paramount: if 2430-2450 fails, algorithmic cascade toward 2400 likely represents additional 2-3% decline.
| Week | Bias | Confidence | Result |
|---|---|---|---|
| March 20, 2026 | NO CALL | 5/10 | ➖ |
| March 14, 2026 | NO CALL | 5/10 | ➖ |
| March 6, 2026 | BULLISH | 6/10 | ❌ |
| February 27, 2026 | BULLISH | 7/10 | ❌ |
| February 21, 2026 | BULLISH | 7/10 | ✅ |
| February 13, 2026 | BULLISH | 7/10 | ✅ |
| February 8, 2026 | BULLISH | 7/10 | ✅ |
| February 1, 2026 | BULLISH | 7/10 | ✅ |
| January 25, 2026 | BULLISH | 7/10 | ❌ |
| January 11, 2026 | BULLISH | 8/10 | ✅ |
| January 4, 2026 | NO CALL | 6/10 | ➖ |
| December 28, 2025 | NO CALL | 6/10 | ➖ |
📋 PROMPT-READY CONTEXT
Copy this entire block into any AI chat for follow-up analysis
▼ Expand
MACRO AGENT DESK — WEEKLY INTELLIGENCE BRIEFING
═════════════════════════════════════════════════
Asset: Russell 2000 (RTY)
Report Date: March 22, 2026

── DIRECTIONAL BIAS ─────────────────────────────
Call: NO CALL
Confidence: 5/10
Signal: NO DIRECTIONAL CALL THIS WEEK
MAD Index: 38 (SLIGHT DIVERGENCE)

── MARKET CONTEXT ───────────────────────────────
State: BREAKING DOWN
Regime: BREAKDOWN
Sentiment: FEAR

── WHAT THE MARKET SEES ─────────────────────────
Small-caps under severe pressure from FOMC hawkish pivot removing easing catalyst, but retaining fundamental appeal from 17-22% earnings growth outlook once volatility settles and Fed clarity emerges

── WHAT THE MARKET IS MISSING ───────────────────
Market may be overpricing breakdown risk given VIX 26.78 fear extreme and AAII 52% bears creating contrarian setup at oversold RSI 31.52, but desk assesses bearish lean as highest probability until 2430-2450 support validates or FOMC rhetoric softens in coming weeks

── KEY DRIVERS ──────────────────────────────────
1. March 18 FOMC held rates at 3.5-3.75% with hawkish dot plot raising long-run rate expectations to 3.1%, triggering equity selloff with small-caps bearing brunt as credit-sensitive asset class
2. RTY officially entered correction territory March 20 at -10.2% from January 22 ATH of 2735, first major U.S. benchmark to do so in 2026, confirming breakdown structure
3. Contrarian bullish setup emerging with VIX 26.78 above fear threshold, AAII bears at 52% creating sentiment extreme, but oversold RSI 31.52 has yet to show bullish divergence

── KEY ZONES ────────────────────────────────────
Resistance 2: 2550 – 2580
Resistance 1: 2485 – 2515
Pivot: ~2455
Support 1: 2415 – 2445
Support 2: 2385 – 2415

── DISCIPLINE BIASES ────────────────────────────
Technical: BEARISH
Fundamental: BULLISH
Institutional: BEARISH
Options: BEARISH
Economic: BEARISH
Sentiment: BULLISH

── TECHNICAL STRUCTURE ──────────────────────────
Confirmed downtrend 10.2% below January ATH, price at 2455 testing critical 2430-2450 support zone with RSI 31.52 oversold but no divergence yet

── FUNDAMENTAL ASSESSMENT ───────────────────────
Q4 2025 earnings inflection real at 64.9% Y/Y growth with 17-22% 2026 outlook, but valuation premium at 19-25x forward P/E versus 13.62-17.34x historical range creates vulnerability

── INSTITUTIONAL POSITIONING ────────────────────
Net long bleeding with sustained IWM outflows totaling -$8.44B over past year, futures OI down 4.1% signaling derisking not accumulation

── OPTIONS FLOW ─────────────────────────────────
VIX spike to 26.78 from prior week's lower levels signals fear regime expansion, IWM put/call 2.74 shows defensive positioning but not panic capitulation

── ECONOMIC BACKDROP ────────────────────────────
RISK-OFF macro regime: Fed March 18 held at 3.5-3.75% with 7 of 19 FOMC members expecting no cuts in 2026 versus prior 2-cut consensus, removing small-cap easing catalyst

── VOLATILITY REGIME ────────────────────────────
Regime: NORMAL
Percentile: 68th
Trend: Expanding ▲
Days in Regime: 8
Term Structure: inverted - short-term vol 32.5 above long-term 26.2 reflecting acute near-term stress from FOMC hawkish surprise and correction entry with RVX at 32.88 as of March 20
Historical Pattern: When RTY enters correction territory with VIX above 25 and RVX above 30, historical precedent shows 65% probability of further 3-7% decline before stabilization unless catalyst reverses sentiment within 1-2 weeks
Outlook: Volatility spiked sharply from 20.06 in early January to current elevated levels following breakdown, 50% probability of mean reversion lower within 2-4 weeks if 2430-2450 support holds and Fed rhetoric stabilizes
Trading Context: Elevated volatility regime requires wider stops at 5-6% below 2400 major support, expect 60-100 point daily ranges versus 40-60 normal, breakdown combined with vol expansion suggests highly directional environment favoring trend-following over mean-reversion until capitulation signals emerge
Vol Risk/Opportunity: Current volatility at 68th percentile creates asymmetric risk toward 5-8% downside to 2,260-2,300 zone versus 2-4% relief rally to 2,500-2,520 resistance, risk/reward favors defensive positioning until sentiment reaches capitulation extremes or Fed provides easing clarity

── PRIMARY RISK ─────────────────────────────────
Failure of 2430-2450 support zone triggering algorithmic cascade toward 2400 major support representing additional 2-3% decline, potentially accelerating to 2300 if credit spreads widen materially
Probability: MEDIUM

── PRIMARY OPPORTUNITY ──────────────────────────
Technical bounce from oversold RSI 31.52 and sentiment extreme (VIX 26.78, AAII bears 52%) targeting 2500-2520 resistance as counter-trend relief rally, though structural headwinds remain intact until Fed provides easing clarity
Timeframe: 3-7 days if 2430-2450 support holds into ISM data April 1

── NEXT CATALYST ────────────────────────────────
Date: April 1, 2026
Event: ISM Manufacturing PMI for March 2026 at 10:00 AM ET, critical test of economic momentum following February 52.4 reading
Expected Impact: HIGH

═════════════════════════════════════════════════
Source: Macro Agent Desk (macroagentdesk.com)
═════════════════════════════════════════════════

── FULL ANALYSIS ────────────────────────────────
Russell 2000 stands at a critical inflection point on March 22, 2026, trading at 2,455 following a brutal week that saw the small-cap benchmark officially enter correction territory on March 20—down 10.2% from the January 22 all-time high of 2,735 and becoming the first major U.S. index to do so in 2026. MACRO REGIME CLASSIFICATION: RISK-OFF. The market environment has decisively shifted to a clear RISK-OFF regime characterized by VIX at 26.78 (well above the 25 threshold), equity indices trending down with RTY underperforming, and safe-haven flows active. This macro backdrop creates structural headwinds for credit-sensitive small-cap risk assets. Post-input development identified: March 18, 2026 FOMC meeting held rates at 3.5-3.75% as expected, but the hawkish surprise came in the dot plot with 7 of 19 participants now expecting NO cuts in 2026 versus the prior consensus of 2 cuts, and long-run rate expectations rising to 3.1%. Powell's press conference emphasized persistent inflation concerns, triggering immediate equity selloff. Market pricing now shows ~50% probability of a rate HIKE by year-end per March 21 data, a dramatic reversal from late 2025 when traders expected multiple cuts. Small-caps as a CREDIT instrument (per Section 3 asset-specific context) are particularly vulnerable: the $368 billion maturity wall in 2026 affecting 41%-46% of Russell 2000 companies forced to refinance at ~6.5% versus 1-2% prior rates creates sustained earnings pressure that the market is now repricing. The convergence of discipline signals creates a complex picture requiring careful navigation. Sentiment shows FEAR regime (signal 3.5, conf 8) with VIX 26.78 and AAII bears at 52% creating contrarian BULLISH setup, but this is fear not capitulation—the desk notes VIX would need 35+ and AAII spread -30%+ for true panic. Technical is decisively BEARISH (signal -3, conf 7) with confirmed downtrend, RSI 31.52 oversold but critically no bullish divergence yet to signal reversal. Institutional is BEARISH (signal -1.5, conf 6) with accelerating outflows—IWM bleeding -$8.44B over past year with -$2.8B in just past 5 days representing intensifying rather than exhausting selling. Options confirms BEARISH lean (signal -1.5, conf 7) with elevated VIX and 2.74 put/call ratio. Economic is BEARISH (signal -2.5, conf 7) noting risk-off regime and refinancing wall headwind. Only Fundamental remains mildly constructive (signal 0.5, conf 4) on Q4 64.9% growth and 17-22% 2026 projections, but lacks near-term catalyst with Q1 earnings not until mid-April. The critical juncture: last week's NO CALL at conviction 5 was CORRECT (-0.98%), extending the corrective streak to two consecutive CORRECT calls after two consecutive MISSED BULLISH calls. This validates the thesis health degradation assessment that triggered the pivot to neutrality. However, the setup now presents binary risk: either oversold RSI triggers technical bounce from 2430-2450 support toward 2500-2520 resistance, or breakdown accelerates toward 2400 if support fails. The NOISE THRESHOLD consideration: RTY's average weekly move is 1.97%, with noise floor at 0.75%. The expected move this week is likely 2-3% given elevated volatility (VIX 26.78), which exceeds the noise floor and creates meaningful directional opportunity. The desk assesses signal at -1.0 (BEARISH lean) reflecting the weight of evidence: 5 of 6 disciplines bearish or no-call, confirmed correction territory, FOMC removing easing catalyst, and technical breakdown below key levels. However, conviction remains at 5—just above minimum threshold—because: (1) Contrarian sentiment extreme creates bounce risk that VIX 26.78 and AAII 52% bears may reverse, (2) RSI 31.52 historically precedes relief rallies even in downtrends, (3) Last two NO CALL weeks were CORRECT but have not established directional conviction for bearish thesis, (4) Fundamental earnings growth remains strong creating potential floor. Devil's advocate bullish case: VIX at 26.78 creates fear-driven oversold condition, RSI 31.52 at levels that historically bounce, sentiment at -21.6% AAII spread creates classic contrarian setup, and strong 64.9% Q4 earnings growth with 17-22% 2026 outlook provides fundamental support at lower levels. However, bearish case dominates: RISK-OFF macro regime confirmed by Fed, accelerating institutional outflows ($2.8B in 5 days), technical breakdown in correction territory, credit-sensitive small-caps vulnerable to refinancing wall at elevated rates, and no catalyst until April earnings season. Risk management paramount: if 2430-2450 fails, algorithmic cascade toward 2400 likely represents additional 2-3% decline.