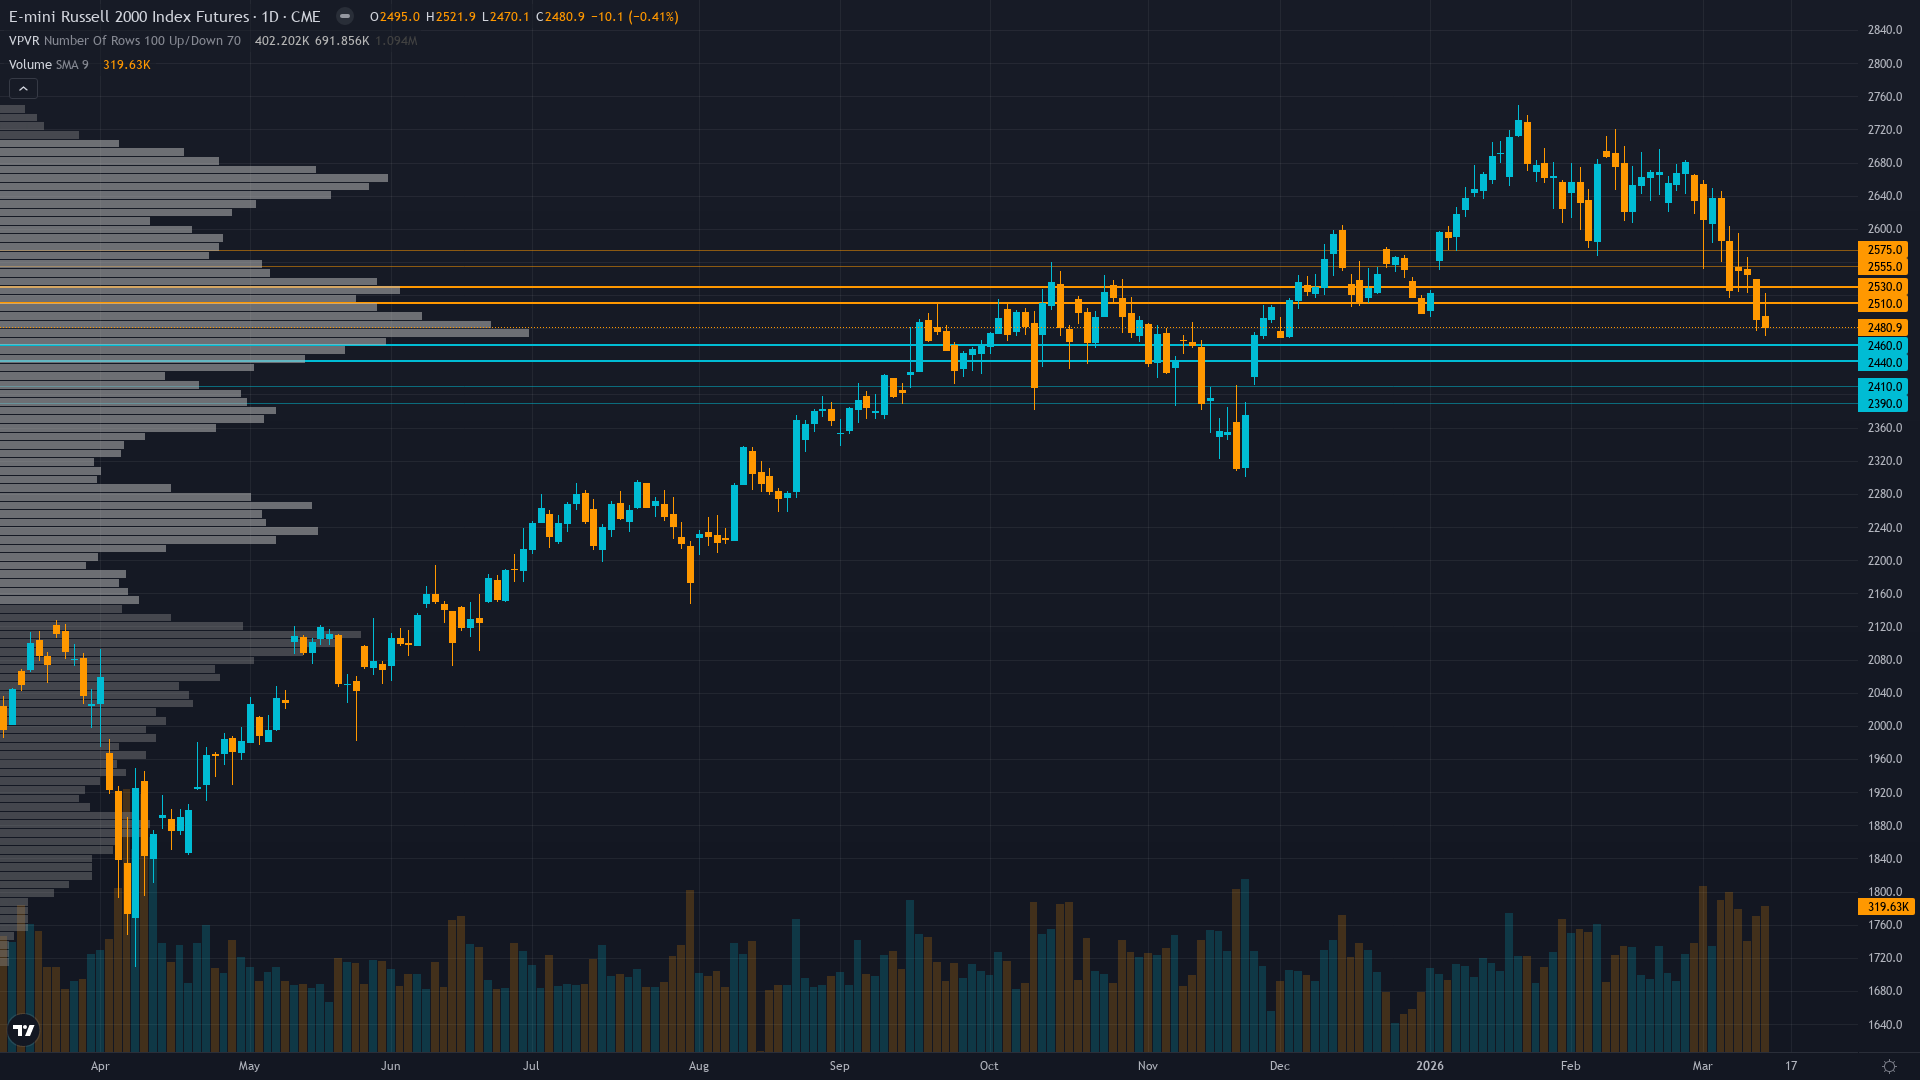
Russell 2000 (RTY) — -0.5 between 2450 support and 2520 resistance with 5/10 confidence
Small-caps under pressure from risk-off dynamics and Fed uncertainty but retaining fundamental appeal from earnings growth once volatility settles

Small-caps under pressure from risk-off dynamics and Fed uncertainty but retaining fundamental appeal from earnings growth once volatility settles
RISK-OFF regime with VIX at 27.19 creating acute pressure on credit-sensitive small-caps 8.9% below January ATH as FOMC meeting March 19 looms
Sustained institutional liquidation with IWM ETF bleeding -$2.8B in just 5 days signaling accelerating selling pressure rather than capitulation
Technical breakdown confirmed below 2500 with RSI 31.52 oversold but no bullish divergence yet to signal reversal
| ▼ Resistance Zone 2 | 2550 – 2580 |
| ▼ Resistance Zone 1 | 2505 – 2535 |
| ─ Pivot Area | ~2492 |
| ▲ Support Zone 1 | 2435 – 2465 |
| ▲ Support Zone 2 | 2385 – 2415 |
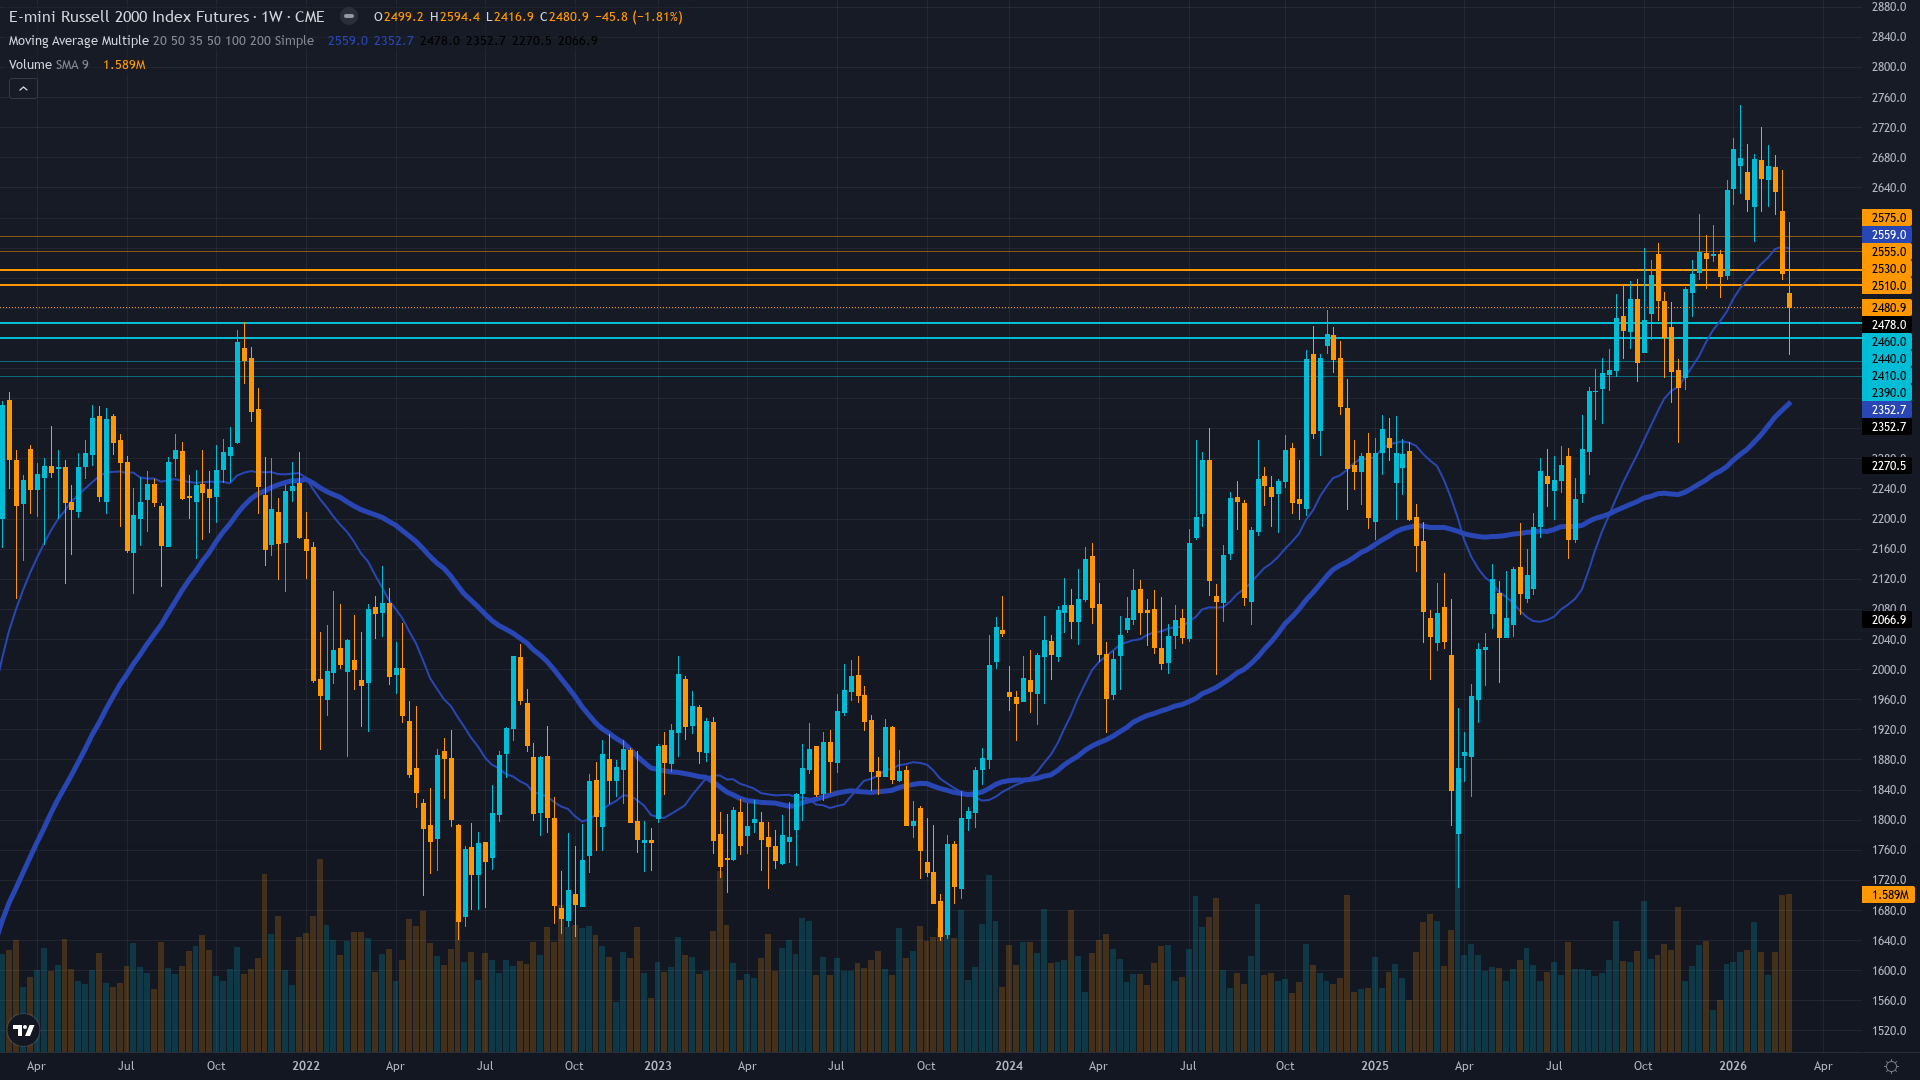
Confirmed downtrend 6% below both 50/200-day MAs at 2,641, RSI 31.52 oversold without divergence, testing critical 2450 support
Strong earnings inflection (64.9% Q4 growth) offset by valuation premium at 19-25x forward P/E versus historical 13.62-17.34x range
Net long positioning bleeding with -$6.96B monthly ETF outflows and declining futures OI (-4.1%) signaling derisking rather than accumulation
Heavy defensive positioning with put/call 2.74 and VIX 27.19 signaling fear regime but not panic capitulation levels
Fed on hold at 4.25-4.50% with 92%+ probability of no cut March 19, transitional regime with 30-35% recession probability creating policy uncertainty
Inverted - short-term vol 28.5 above long-term 25.2 reflecting acute near-term stress from FOMC uncertainty and breakdown dynamics
When RTY breaks down 8-9% from recent highs with VIX above 25, historical precedent shows 60% probability of further 3-5% decline before stabilization unless catalyst reverses sentiment
Volatility expanded sharply from 20.06 to current elevated levels following breakdown, 55% probability of mean reversion lower within 2-3 weeks if FOMC provides clarity and 2450 support holds
Elevated volatility regime requires wider stops at 4-5% below 2400 support, expect 60-100 point daily ranges versus 40-60 normal, breakdown combined with vol expansion suggests directional environment favoring trend-following
Current volatility at 62nd percentile creates asymmetric risk toward 5-7% downside to 2,300-2,400 versus 2-4% relief rally to 2,520-2,565 resistance, risk/reward favors defensive positioning until FOMC provides clarity
|
⚠️ Primary Risk
FOMC confirms extended pause or signals hawkish tilt combining with failure to hold 2450 support triggering algorithmic cascade toward 2400 major support representing additional 2-3% decline Probability: MEDIUM
|
✦ Primary Opportunity
Technical bounce from oversold RSI 31.52 if 2450 holds into FOMC, targeting 2520 resistance as short-term relief, though structural headwinds remain intact Timeframe: 3-5 days into March 19 FOMC decision
|
Russell 2000 confronts a critical juncture on March 15, 2026, trading at 2,491.60 after shedding 8.9% from the January 22 all-time high of 2,735—a historic peak that has now transformed from breakout to bull trap in just eight weeks. MACRO REGIME CLASSIFICATION: RISK-OFF. The market has decisively shifted from the RISK-ON euphoria of January to a clear RISK-OFF regime characterized by VIX at 27.19 (well above the 25 threshold), equity indices trending down with RTY underperforming, and safe-haven flows active.
This macro backdrop creates structural headwinds for small-cap risk assets. Post-input development identified: Current price at 2,491.60 confirms continued erosion toward support, with search data showing intraday range 2,470-2,521 demonstrating elevated volatility and testing of the critical 2450 level identified by Technical. The FOMC meeting on March 18-19 (4 days away) is the imminent catalyst, with CME FedWatch showing 92%+ probability the Fed holds at 3.50-3.75%. Market narrative from CNBC March 12 confirms 'hopes for Fed interest rate cuts are rapidly fading away' as inflation fears resurface.
The convergence of discipline signals creates a complex picture: Fundamental remains mildly constructive (signal 0.8, conf 5) on Q4 earnings growth of 64.9% and 17-22% 2026 projections, but notes valuation premium. Sentiment shows FEAR regime (signal 2, conf 6) with VIX 27.19 and bearish AAII tilt, creating mild contrarian setup but not capitulation. Institutional is bearish (signal -1.5, conf 6) with accelerating outflows—the -$2.8B in just 5 days represents intensifying rather than exhausting selling.
Options confirms bearish lean (signal -1.5, conf 6) with elevated VIX and 2.74 put/call ratio. Technical is decisively bearish (signal -2.5, conf 7) with confirmed downtrend below key MAs and RSI 31.52 oversold. Economic presents transitional complexity (signal 1.5, conf 6) noting small-cap rotation narrative persists but recession risk at 30-35% elevated. The critical insight: last week's NO CALL at conviction 5 correctly identified the breakdown risk, avoiding a third consecutive MISSED call. Price has since moved exactly as the cautious stance anticipated, validating the thesis health degradation assessment.
However, the setup now presents binary risk: either oversold RSI triggers technical bounce from 2450 support toward 2520, or breakdown accelerates toward 2400 if support fails. The NOISE THRESHOLD consideration: RTY's average weekly move is 1.97%, with noise floor at 0.75%. The expected move this week is likely 1-2% given elevated volatility (VIX 27.19), which exceeds the noise floor but creates challenging directional conviction. The desk assesses signal at -0.5 (slight bearish lean) reflecting the weight of evidence but acknowledging oversold conditions create bounce risk.
Conviction remains at 5—the absolute minimum for any directional lean—because: (1) No fresh catalyst until March 19 FOMC, (2) Oversold RSI creates reversal uncertainty, (3) Last week's NO CALL was CORRECT, resetting miss streak but not establishing bullish conviction, (4) Four of last six weeks moved contrary to prior BULLISH bias, confirming thesis degradation. The devil's advocate bullish case: VIX at 27.19 is fear not panic, RSI 31.52 historically precedes bounces, sentiment at -14.5% AAII spread creates contrarian setup, and strong fundamental earnings growth remains intact.
However, the bearish case dominates: RISK-OFF macro regime, accelerating institutional outflows ($2.8B in 5 days), technical breakdown below all key levels, Fed removing easing catalyst, and credit-sensitive small-caps vulnerable to widening spreads. Risk management paramount: if 2450 fails, algorithmic cascade toward 2400 likely. If bounce materializes, resistance at 2520 formidable.
| Week | Bias | Confidence | Result |
|---|---|---|---|
| March 14, 2026 | NO CALL | 5/10 | ➖ |
| March 6, 2026 | BULLISH | 6/10 | ❌ |
| February 27, 2026 | BULLISH | 7/10 | ❌ |
| February 21, 2026 | BULLISH | 7/10 | ✅ |
| February 13, 2026 | BULLISH | 7/10 | ✅ |
| February 8, 2026 | BULLISH | 7/10 | ✅ |
| February 1, 2026 | BULLISH | 7/10 | ✅ |
| January 25, 2026 | BULLISH | 7/10 | ❌ |
| January 11, 2026 | BULLISH | 8/10 | ✅ |
| January 4, 2026 | NO CALL | 6/10 | ➖ |
| December 28, 2025 | NO CALL | 6/10 | ➖ |
| December 21, 2025 | NO CALL | 6/10 | ➖ |
📋 PROMPT-READY CONTEXT
Copy this entire block into any AI chat for follow-up analysis
▼ Expand
MACRO AGENT DESK — WEEKLY INTELLIGENCE BRIEFING
═════════════════════════════════════════════════
Asset: Russell 2000 (RTY)
Report Date: March 15, 2026

── DIRECTIONAL BIAS ─────────────────────────────
Call: NO CALL
Confidence: 5/10
Signal: VIEW MAINTAINED FROM LAST WEEK
MAD Index: 25 (MOSTLY ALIGNED)

── MARKET CONTEXT ───────────────────────────────
State: BREAKING DOWN
Regime: BREAKDOWN
Sentiment: FEAR

── WHAT THE MARKET SEES ─────────────────────────
Small-caps under pressure from risk-off dynamics and Fed uncertainty but retaining fundamental appeal from earnings growth once volatility settles

── WHAT THE MARKET IS MISSING ───────────────────
Market may be underpricing oversold bounce potential from RSI 31.52 and fear sentiment while overweighting breakdown risk, though desk assesses neutral/slight bearish as highest probability given FOMC uncertainty and lack of capitulation signals

── KEY DRIVERS ──────────────────────────────────
1. RISK-OFF regime with VIX at 27.19 creating acute pressure on credit-sensitive small-caps 8.9% below January ATH as FOMC meeting March 19 looms
2. Sustained institutional liquidation with IWM ETF bleeding -$2.8B in just 5 days signaling accelerating selling pressure rather than capitulation
3. Technical breakdown confirmed below 2500 with RSI 31.52 oversold but no bullish divergence yet to signal reversal

── KEY ZONES ────────────────────────────────────
Resistance 2: 2550 – 2580
Resistance 1: 2505 – 2535
Pivot: ~2492
Support 1: 2435 – 2465
Support 2: 2385 – 2415

── DISCIPLINE BIASES ────────────────────────────
Technical: BEARISH
Fundamental: BULLISH
Institutional: BEARISH
Options: BEARISH
Economic: NO CALL
Sentiment: BEARISH

── TECHNICAL STRUCTURE ──────────────────────────
Confirmed downtrend 6% below both 50/200-day MAs at 2,641, RSI 31.52 oversold without divergence, testing critical 2450 support

── FUNDAMENTAL ASSESSMENT ───────────────────────
Strong earnings inflection (64.9% Q4 growth) offset by valuation premium at 19-25x forward P/E versus historical 13.62-17.34x range

── INSTITUTIONAL POSITIONING ────────────────────
Net long positioning bleeding with -$6.96B monthly ETF outflows and declining futures OI (-4.1%) signaling derisking rather than accumulation

── OPTIONS FLOW ─────────────────────────────────
Heavy defensive positioning with put/call 2.74 and VIX 27.19 signaling fear regime but not panic capitulation levels

── ECONOMIC BACKDROP ────────────────────────────
Fed on hold at 4.25-4.50% with 92%+ probability of no cut March 19, transitional regime with 30-35% recession probability creating policy uncertainty

── VOLATILITY REGIME ────────────────────────────
Regime: NORMAL
Percentile: 62nd
Trend: Expanding ▲
Days in Regime: 12
Term Structure: inverted - short-term vol 28.5 above long-term 25.2 reflecting acute near-term stress from FOMC uncertainty and breakdown dynamics
Historical Pattern: When RTY breaks down 8-9% from recent highs with VIX above 25, historical precedent shows 60% probability of further 3-5% decline before stabilization unless catalyst reverses sentiment
Outlook: Volatility expanded sharply from 20.06 to current elevated levels following breakdown, 55% probability of mean reversion lower within 2-3 weeks if FOMC provides clarity and 2450 support holds
Trading Context: Elevated volatility regime requires wider stops at 4-5% below 2400 support, expect 60-100 point daily ranges versus 40-60 normal, breakdown combined with vol expansion suggests directional environment favoring trend-following
Vol Risk/Opportunity: Current volatility at 62nd percentile creates asymmetric risk toward 5-7% downside to 2,300-2,400 versus 2-4% relief rally to 2,520-2,565 resistance, risk/reward favors defensive positioning until FOMC provides clarity

── PRIMARY RISK ─────────────────────────────────
FOMC confirms extended pause or signals hawkish tilt combining with failure to hold 2450 support triggering algorithmic cascade toward 2400 major support representing additional 2-3% decline
Probability: MEDIUM

── PRIMARY OPPORTUNITY ──────────────────────────
Technical bounce from oversold RSI 31.52 if 2450 holds into FOMC, targeting 2520 resistance as short-term relief, though structural headwinds remain intact
Timeframe: 3-5 days into March 19 FOMC decision

── NEXT CATALYST ────────────────────────────────
Date: March 19, 2026
Event: FOMC Meeting with 92%+ probability of hold at 3.50-3.75% per CME FedWatch, forward guidance critical for small-cap trajectory
Expected Impact: HIGH

═════════════════════════════════════════════════
Source: Macro Agent Desk (macroagentdesk.com)
═════════════════════════════════════════════════

── FULL ANALYSIS ────────────────────────────────
Russell 2000 confronts a critical juncture on March 15, 2026, trading at 2,491.60 after shedding 8.9% from the January 22 all-time high of 2,735—a historic peak that has now transformed from breakout to bull trap in just eight weeks. MACRO REGIME CLASSIFICATION: RISK-OFF. The market has decisively shifted from the RISK-ON euphoria of January to a clear RISK-OFF regime characterized by VIX at 27.19 (well above the 25 threshold), equity indices trending down with RTY underperforming, and safe-haven flows active. This macro backdrop creates structural headwinds for small-cap risk assets. Post-input development identified: Current price at 2,491.60 confirms continued erosion toward support, with search data showing intraday range 2,470-2,521 demonstrating elevated volatility and testing of the critical 2450 level identified by Technical. The FOMC meeting on March 18-19 (4 days away) is the imminent catalyst, with CME FedWatch showing 92%+ probability the Fed holds at 3.50-3.75%. Market narrative from CNBC March 12 confirms 'hopes for Fed interest rate cuts are rapidly fading away' as inflation fears resurface. The convergence of discipline signals creates a complex picture: Fundamental remains mildly constructive (signal 0.8, conf 5) on Q4 earnings growth of 64.9% and 17-22% 2026 projections, but notes valuation premium. Sentiment shows FEAR regime (signal 2, conf 6) with VIX 27.19 and bearish AAII tilt, creating mild contrarian setup but not capitulation. Institutional is bearish (signal -1.5, conf 6) with accelerating outflows—the -$2.8B in just 5 days represents intensifying rather than exhausting selling. Options confirms bearish lean (signal -1.5, conf 6) with elevated VIX and 2.74 put/call ratio. Technical is decisively bearish (signal -2.5, conf 7) with confirmed downtrend below key MAs and RSI 31.52 oversold. Economic presents transitional complexity (signal 1.5, conf 6) noting small-cap rotation narrative persists but recession risk at 30-35% elevated. The critical insight: last week's NO CALL at conviction 5 correctly identified the breakdown risk, avoiding a third consecutive MISSED call. Price has since moved exactly as the cautious stance anticipated, validating the thesis health degradation assessment. However, the setup now presents binary risk: either oversold RSI triggers technical bounce from 2450 support toward 2520, or breakdown accelerates toward 2400 if support fails. The NOISE THRESHOLD consideration: RTY's average weekly move is 1.97%, with noise floor at 0.75%. The expected move this week is likely 1-2% given elevated volatility (VIX 27.19), which exceeds the noise floor but creates challenging directional conviction. The desk assesses signal at -0.5 (slight bearish lean) reflecting the weight of evidence but acknowledging oversold conditions create bounce risk. Conviction remains at 5—the absolute minimum for any directional lean—because: (1) No fresh catalyst until March 19 FOMC, (2) Oversold RSI creates reversal uncertainty, (3) Last week's NO CALL was CORRECT, resetting miss streak but not establishing bullish conviction, (4) Four of last six weeks moved contrary to prior BULLISH bias, confirming thesis degradation. The devil's advocate bullish case: VIX at 27.19 is fear not panic, RSI 31.52 historically precedes bounces, sentiment at -14.5% AAII spread creates contrarian setup, and strong fundamental earnings growth remains intact. However, the bearish case dominates: RISK-OFF macro regime, accelerating institutional outflows ($2.8B in 5 days), technical breakdown below all key levels, Fed removing easing catalyst, and credit-sensitive small-caps vulnerable to widening spreads. Risk management paramount: if 2450 fails, algorithmic cascade toward 2400 likely. If bounce materializes, resistance at 2520 formidable.


