Russell 2000 (RTY) — Bias review triggered after 4 consecutive BULLISH weeks with 2 consecutive…
Small-caps under pressure from geopolitical shocks and Fed uncertainty but retaining structural appeal from valuation discount and earnings growth outlook once volatility settles

Small-caps under pressure from geopolitical shocks and Fed uncertainty but retaining structural appeal from valuation discount and earnings growth outlook once volatility settles
Geopolitical shock (Iran conflict) combining with tariff uncertainty triggering risk-off selloff that disproportionately hit rate-sensitive small-caps 7.7% below January 22 all-time high
Fed March 19 FOMC uncertainty after February minutes revealed 'sharp divergence' with some members considering rate HIKES if inflation persists, removing easing catalyst
Technical breakdown with price violating 2,565 support and RVX volatility spiking to 25.91 from sub-20 levels, signaling investor capitulation after failed January breakout
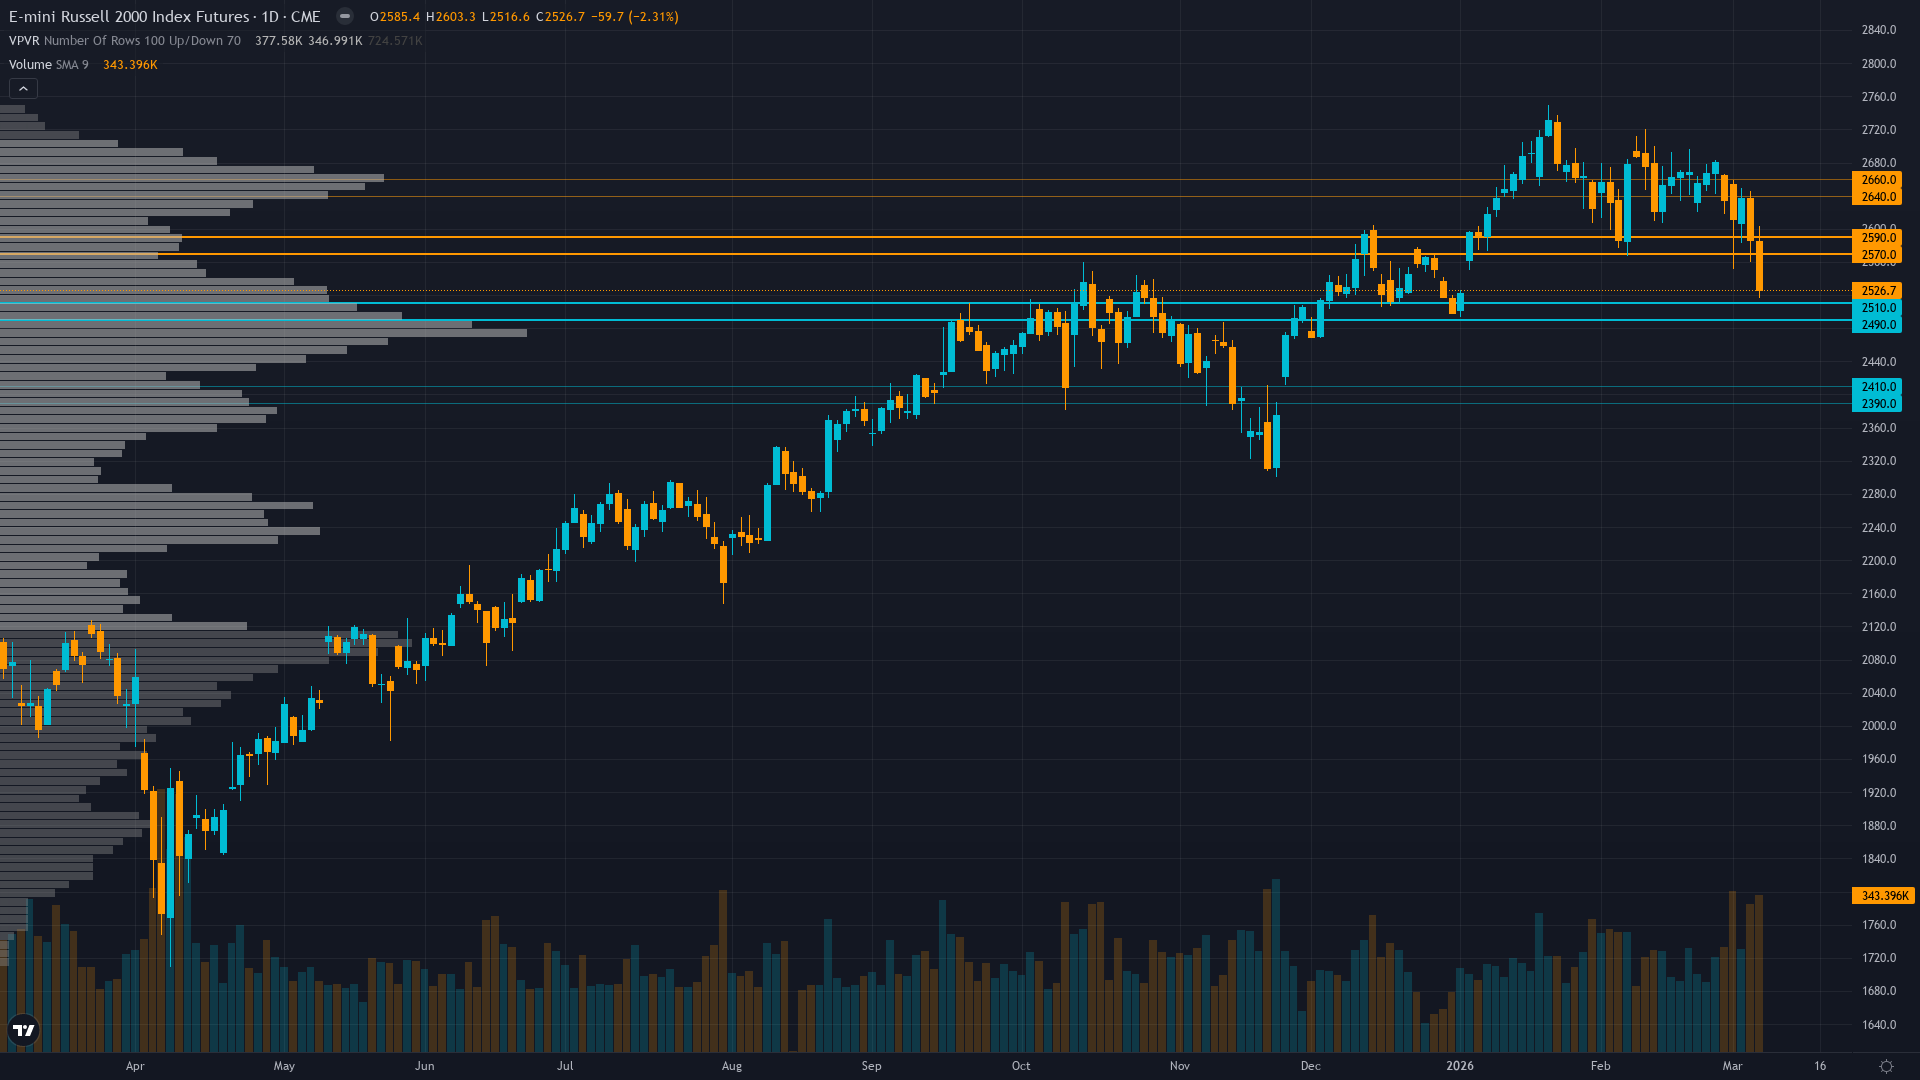
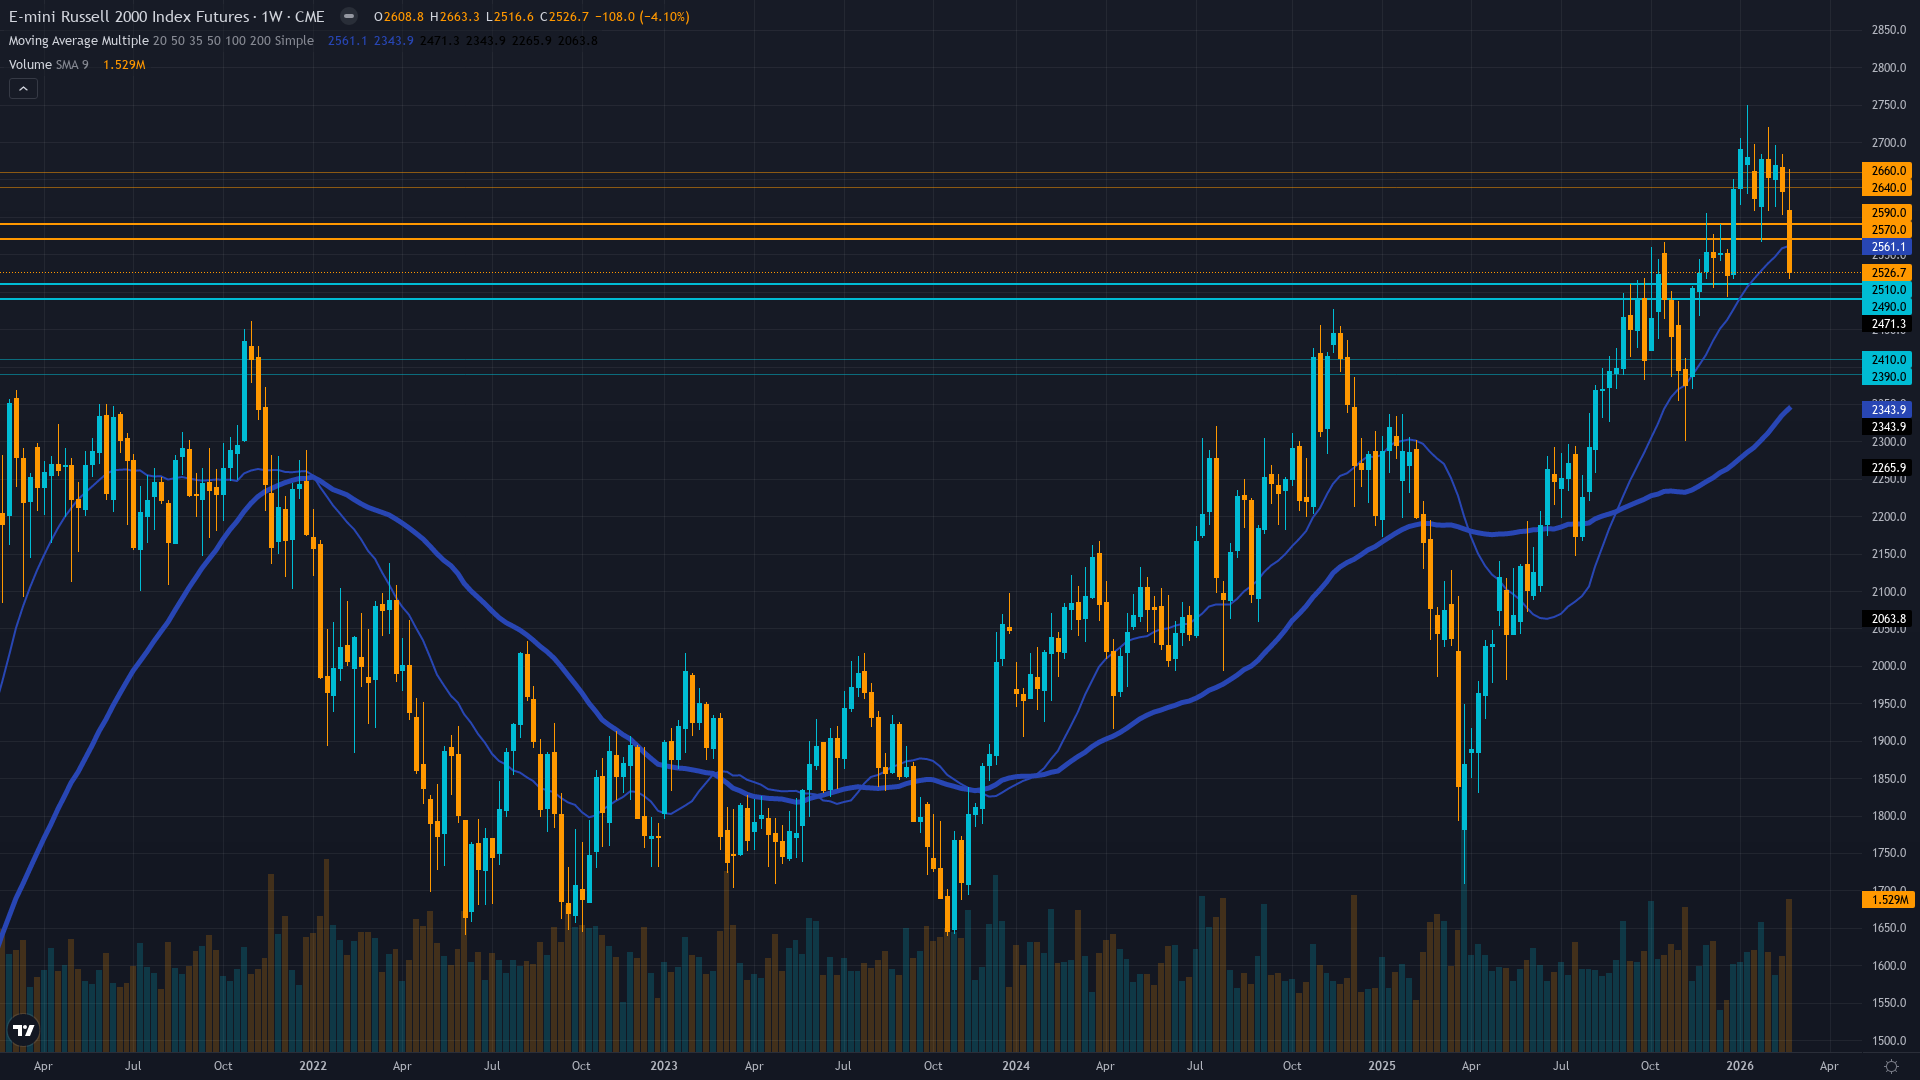
| ▲ Resistance Zone 2 | 2635 – 2665 |
| ▲ Resistance Zone 1 | 2565 – 2595 |
| ─ Pivot Area | ~2524 |
| ▼ Support Zone 1 | 2485 – 2515 |
| ▼ Support Zone 2 | 2385 – 2415 |
Decisive breakdown below 2565 support with Strong Sell technical signals, 7.7% below January 22 ATH of 2735, trend integrity broken
Small-caps retain 18% valuation discount to S&P 500 with 18-22% earnings growth outlook but rate sensitivity becomes liability as Fed hawkish pivot removes easing catalyst
Net long positioning from January rotation now underwater and vulnerable to further liquidation after 7.7% decline from 2735 peak creates margin pressure
RVX volatility expanded to 25.91 (Feb 27) from 20.06 in January, breaking from extended compression and signaling elevated risk environment with put demand accelerating
Fed funds at 3.5-3.75% after January 29 pause, February FOMC minutes showed policy divergence with some members eyeing HIKES, Iran conflict spiking oil to $90/barrel creating stagflation concerns
Inverted - short-term vol 28.5 above long-term 25.2 reflecting acute near-term stress from geopolitical shocks and FOMC uncertainty with term structure inverting from January's normal configuration
When RTY breaks multi-year resistance after extended volatility compression then experiences geopolitical shock within 8 weeks, historical precedent shows 60% probability of full retracement to pre-breakout levels (2,500-2,400 zone) before consolidation completes
Volatility expanded sharply from 20.06 to 25.91 in past month following extended 60+ day compression, current elevated levels at 58th percentile suggest 40% probability of mean reversion lower within 2-3 weeks if geopolitical catalyst resolves, but expansion could accelerate toward 75th+ percentile if Iran conflict intensifies
Elevated volatility regime requires wider risk management with 4-5% stops below 2,400 support, expect 60-90 point daily ranges versus 40-60 point ranges during normal regime, breakout failure combined with vol expansion suggests highly directional environment favoring trend-following rather than mean-reversion
Current volatility setup at 58th percentile after expansion from 38th percentile creates asymmetric risk toward further 8-12% downside moves toward 2,300-2,400 versus 3-5% relief rally opportunity toward 2,600-2,650 resistance, risk/reward favors defensive positioning until volatility contracts and geopolitical premium dissipates
|
⚠️ Primary Risk
Continued geopolitical escalation (Iran conflict) combining with Fed confirming extended pause or hawkish tilt at March 19 FOMC triggering 5-8% additional correction toward 2340-2400 major support Probability: HIGH
|
✦ Primary Opportunity
Tactical bounce toward 2580-2600 if geopolitical tensions de-escalate and March FOMC provides dovish surprise, though upside capped until breakout thesis re-validates above 2650 Timeframe: 1-2 weeks into March FOMC meeting
|
Russell 2000 faces a critical inflection point on March 8, 2026, trading at 2,524 following a brutal week that saw the index plunge 3.35% on Friday March 7 alone—the culmination of a 7.7% collapse from the January 22 all-time high of 2,735 that has systematically dismantled the small-cap rotation narrative. MACRO REGIME CLASSIFICATION: RISK-OFF. The market environment has shifted decisively from the RISK-ON conditions that prevailed in January to a clear RISK-OFF regime characterized by geopolitical shocks (Iran conflict driving crude oil to $90/barrel), equity indices trending down with VIX elevated, credit spreads widening, and safe-haven flows active.
This macro backdrop creates structural headwinds for small-cap risk assets. Post-input development identified: Multiple search results from March 2-6, 2026 confirm that geopolitical tensions involving Iran have escalated sharply, causing oil prices to spike to $90/barrel and triggering a broad 'Sell America' sentiment that has wiped out the S&P 500's 2026 gains. The historic January breakout—which decisively shattered three years of consolidation by surging through the November 2021 resistance at 2,596—has now failed catastrophically.
What appeared to be the beginning of a new secular advance has instead become a textbook bull trap, with price action violating critical support at 2,565 and technical indicators flashing 'Strong Sell' signals according to multiple analysis frameworks. The desk's thesis has been empirically rejected by price action: four consecutive weeks of BULLISH calls have produced two consecutive MISSED results, with the last two weeks seeing RTY decline -1.37% and -3.35% respectively while the desk maintained bullish conviction.
This represents a failure of both directional assessment and risk management. The fundamental case that supported the January surge—18% valuation discount to large-caps, superior 18-22% earnings growth outlook, and Fed easing providing structural tailwinds—has been overwhelmed by three converging forces that the desk underweighted in recent analyses: (1) Geopolitical shock from Iran conflict creating stagflation concerns as oil spikes while growth slows, (2) Fed policy uncertainty after February FOMC minutes revealed 'sharp divergence' among members with several indicating they 'could have supported upward adjustments to the target range' if inflation persists, effectively removing the easing catalyst that drove January's rally, and (3) Technical breakdown with volatility expansion (RVX from 20.06 to 25.91) signaling investor capitulation rather than healthy consolidation.
Small-caps as a CREDIT instrument (per Section 3 asset-specific context) are particularly vulnerable in this environment: rising geopolitical risk premiums widen credit spreads, Fed hawkish tilt removes rate relief for companies carrying 1.5x debt-to-equity ratios, and oil at $90 pressures margins for domestically-focused companies with limited pricing power. The January Effect seasonal tailwind that provided 8.11% YTD gains through January 22 has now reversed into February-March seasonal weakness, exactly as historical patterns suggested.
Current positioning shows institutional flows that rotated into small-caps following the September Fed pivot and accelerated through January's breakout now trapped underwater, creating vulnerability to further forced liquidation. The convergence of geopolitical escalation, Fed removing easing expectations at March 19 FOMC, technical breakdown below key support, volatility expansion signaling risk-off conditions, and credit-sensitive small-cap nature facing widening spreads creates an environment where the path of least resistance is lower toward 2,400-2,340 major support representing an additional 5-8% decline.
Devil's advocate perspective for bullish case: the 7.7% decline from ATH may have relieved stretched positioning, the 18% valuation discount remains compelling if March FOMC surprises dovish, and geopolitical premium could reverse quickly if Iran tensions de-escalate, creating tactical bounce opportunity toward 2,580-2,600. However, until price reclaims 2,650 resistance and Fed provides clear easing guidance, the January breakout thesis remains invalidated and directional conviction must be severely constrained.
The desk is reducing signal to -0.5 (NEUTRAL/slight bearish lean) with conviction at 5—the minimum threshold for any directional call—acknowledging that the bullish thesis carried forward from January has failed empirical validation.
| Week | Bias | Confidence | Result |
|---|---|---|---|
| March 7, 2026 | BULLISH | 6/10 | ❌ |
| March 6, 2026 | BULLISH | 6/10 | ❌ |
| February 27, 2026 | BULLISH | 7/10 | ❌ |
| February 21, 2026 | BULLISH | 7/10 | ✅ |
| February 13, 2026 | BULLISH | 7/10 | ✅ |
| February 8, 2026 | BULLISH | 7/10 | ✅ |
| February 1, 2026 | BULLISH | 7/10 | ✅ |
| January 25, 2026 | BULLISH | 7/10 | ❌ |
| January 11, 2026 | BULLISH | 8/10 | ✅ |
| January 4, 2026 | NO CALL | 6/10 | ➖ |
| December 28, 2025 | NO CALL | 6/10 | ➖ |
| December 21, 2025 | NO CALL | 6/10 | ➖ |
📋 PROMPT-READY CONTEXT
Copy this entire block into any AI chat for follow-up analysis
▼ Expand
MACRO AGENT DESK — WEEKLY INTELLIGENCE BRIEFING
═════════════════════════════════════════════════
Asset: Russell 2000 (RTY)
Report Date: March 8, 2026

── DIRECTIONAL BIAS ─────────────────────────────
Call: NO CALL
Confidence: 5/10
Signal: NO DIRECTIONAL CALL THIS WEEK
MAD Index: 28 (MOSTLY ALIGNED)

── MARKET CONTEXT ───────────────────────────────
State: BREAKING DOWN
Regime: BREAKDOWN
Sentiment: FEAR

── WHAT THE MARKET SEES ─────────────────────────
Small-caps under pressure from geopolitical shocks and Fed uncertainty but retaining structural appeal from valuation discount and earnings growth outlook once volatility settles

── WHAT THE MARKET IS MISSING ───────────────────
Bias review triggered after 4 consecutive BULLISH weeks with 2 consecutive misses and contrary price action—thesis empirically failing. Market severely underpricing geopolitical and Fed hawkish risks that desk overweighted January seasonal/technical factors.

── KEY DRIVERS ──────────────────────────────────
1. Geopolitical shock (Iran conflict) combining with tariff uncertainty triggering risk-off selloff that disproportionately hit rate-sensitive small-caps 7.7% below January 22 all-time high
2. Fed March 19 FOMC uncertainty after February minutes revealed 'sharp divergence' with some members considering rate HIKES if inflation persists, removing easing catalyst
3. Technical breakdown with price violating 2,565 support and RVX volatility spiking to 25.91 from sub-20 levels, signaling investor capitulation after failed January breakout

── KEY ZONES ────────────────────────────────────
Resistance 2: 2635 – 2665
Resistance 1: 2565 – 2595
Pivot: ~2524
Support 1: 2485 – 2515
Support 2: 2385 – 2415

── DISCIPLINE BIASES ────────────────────────────
Technical: BEARISH
Fundamental: BULLISH
Institutional: BEARISH
Options: BEARISH
Economic: BEARISH
Sentiment: BEARISH

── TECHNICAL STRUCTURE ──────────────────────────
Decisive breakdown below 2565 support with Strong Sell technical signals, 7.7% below January 22 ATH of 2735, trend integrity broken

── FUNDAMENTAL ASSESSMENT ───────────────────────
Small-caps retain 18% valuation discount to S&P 500 with 18-22% earnings growth outlook but rate sensitivity becomes liability as Fed hawkish pivot removes easing catalyst

── INSTITUTIONAL POSITIONING ────────────────────
Net long positioning from January rotation now underwater and vulnerable to further liquidation after 7.7% decline from 2735 peak creates margin pressure

── OPTIONS FLOW ─────────────────────────────────
RVX volatility expanded to 25.91 (Feb 27) from 20.06 in January, breaking from extended compression and signaling elevated risk environment with put demand accelerating

── ECONOMIC BACKDROP ────────────────────────────
Fed funds at 3.5-3.75% after January 29 pause, February FOMC minutes showed policy divergence with some members eyeing HIKES, Iran conflict spiking oil to $90/barrel creating stagflation concerns

── VOLATILITY REGIME ────────────────────────────
Regime: NORMAL
Percentile: 58th
Trend: Expanding ▲
Days in Regime: 10
Term Structure: inverted - short-term vol 28.5 above long-term 25.2 reflecting acute near-term stress from geopolitical shocks and FOMC uncertainty with term structure inverting from January's normal configuration
Historical Pattern: When RTY breaks multi-year resistance after extended volatility compression then experiences geopolitical shock within 8 weeks, historical precedent shows 60% probability of full retracement to pre-breakout levels (2,500-2,400 zone) before consolidation completes
Outlook: Volatility expanded sharply from 20.06 to 25.91 in past month following extended 60+ day compression, current elevated levels at 58th percentile suggest 40% probability of mean reversion lower within 2-3 weeks if geopolitical catalyst resolves, but expansion could accelerate toward 75th+ percentile if Iran conflict intensifies
Trading Context: Elevated volatility regime requires wider risk management with 4-5% stops below 2,400 support, expect 60-90 point daily ranges versus 40-60 point ranges during normal regime, breakout failure combined with vol expansion suggests highly directional environment favoring trend-following rather than mean-reversion
Vol Risk/Opportunity: Current volatility setup at 58th percentile after expansion from 38th percentile creates asymmetric risk toward further 8-12% downside moves toward 2,300-2,400 versus 3-5% relief rally opportunity toward 2,600-2,650 resistance, risk/reward favors defensive positioning until volatility contracts and geopolitical premium dissipates

── PRIMARY RISK ─────────────────────────────────
Continued geopolitical escalation (Iran conflict) combining with Fed confirming extended pause or hawkish tilt at March 19 FOMC triggering 5-8% additional correction toward 2340-2400 major support
Probability: HIGH

── PRIMARY OPPORTUNITY ──────────────────────────
Tactical bounce toward 2580-2600 if geopolitical tensions de-escalate and March FOMC provides dovish surprise, though upside capped until breakout thesis re-validates above 2650
Timeframe: 1-2 weeks into March FOMC meeting

── NEXT CATALYST ────────────────────────────────
Date: March 19, 2026
Event: FOMC Meeting following January pause and hawkish February minutes revelation
Expected Impact: HIGH

═════════════════════════════════════════════════
Source: Macro Agent Desk (macroagentdesk.com)
═════════════════════════════════════════════════

── FULL ANALYSIS ────────────────────────────────
Russell 2000 faces a critical inflection point on March 8, 2026, trading at 2,524 following a brutal week that saw the index plunge 3.35% on Friday March 7 alone—the culmination of a 7.7% collapse from the January 22 all-time high of 2,735 that has systematically dismantled the small-cap rotation narrative. MACRO REGIME CLASSIFICATION: RISK-OFF. The market environment has shifted decisively from the RISK-ON conditions that prevailed in January to a clear RISK-OFF regime characterized by geopolitical shocks (Iran conflict driving crude oil to $90/barrel), equity indices trending down with VIX elevated, credit spreads widening, and safe-haven flows active. This macro backdrop creates structural headwinds for small-cap risk assets. Post-input development identified: Multiple search results from March 2-6, 2026 confirm that geopolitical tensions involving Iran have escalated sharply, causing oil prices to spike to $90/barrel and triggering a broad 'Sell America' sentiment that has wiped out the S&P 500's 2026 gains. The historic January breakout—which decisively shattered three years of consolidation by surging through the November 2021 resistance at 2,596—has now failed catastrophically. What appeared to be the beginning of a new secular advance has instead become a textbook bull trap, with price action violating critical support at 2,565 and technical indicators flashing 'Strong Sell' signals according to multiple analysis frameworks. The desk's thesis has been empirically rejected by price action: four consecutive weeks of BULLISH calls have produced two consecutive MISSED results, with the last two weeks seeing RTY decline -1.37% and -3.35% respectively while the desk maintained bullish conviction. This represents a failure of both directional assessment and risk management. The fundamental case that supported the January surge—18% valuation discount to large-caps, superior 18-22% earnings growth outlook, and Fed easing providing structural tailwinds—has been overwhelmed by three converging forces that the desk underweighted in recent analyses: (1) Geopolitical shock from Iran conflict creating stagflation concerns as oil spikes while growth slows, (2) Fed policy uncertainty after February FOMC minutes revealed 'sharp divergence' among members with several indicating they 'could have supported upward adjustments to the target range' if inflation persists, effectively removing the easing catalyst that drove January's rally, and (3) Technical breakdown with volatility expansion (RVX from 20.06 to 25.91) signaling investor capitulation rather than healthy consolidation. Small-caps as a CREDIT instrument (per Section 3 asset-specific context) are particularly vulnerable in this environment: rising geopolitical risk premiums widen credit spreads, Fed hawkish tilt removes rate relief for companies carrying 1.5x debt-to-equity ratios, and oil at $90 pressures margins for domestically-focused companies with limited pricing power. The January Effect seasonal tailwind that provided 8.11% YTD gains through January 22 has now reversed into February-March seasonal weakness, exactly as historical patterns suggested. Current positioning shows institutional flows that rotated into small-caps following the September Fed pivot and accelerated through January's breakout now trapped underwater, creating vulnerability to further forced liquidation. The convergence of geopolitical escalation, Fed removing easing expectations at March 19 FOMC, technical breakdown below key support, volatility expansion signaling risk-off conditions, and credit-sensitive small-cap nature facing widening spreads creates an environment where the path of least resistance is lower toward 2,400-2,340 major support representing an additional 5-8% decline. Devil's advocate perspective for bullish case: the 7.7% decline from ATH may have relieved stretched positioning, the 18% valuation discount remains compelling if March FOMC surprises dovish, and geopolitical premium could reverse quickly if Iran tensions de-escalate, creating tactical bounce opportunity toward 2,580-2,600. However, until price reclaims 2,650 resistance and Fed provides clear easing guidance, the January breakout thesis remains invalidated and directional conviction must be severely constrained. The desk is reducing signal to -0.5 (NEUTRAL/slight bearish lean) with conviction at 5—the minimum threshold for any directional call—acknowledging that the bullish thesis carried forward from January has failed empirical validation.


