Russell 2000 (RTY) — Multi-month consolidation 3.9% below January 22 all-time high of 2735 following…
Small-caps positioned to extend outperformance following historic January breakout with superior 18-22% earnings growth and Fed easing supporting continued rotation despite near-term seasonal consolidation

Small-caps positioned to extend outperformance following historic January breakout with superior 18-22% earnings growth and Fed easing supporting continued rotation despite near-term seasonal consolidation
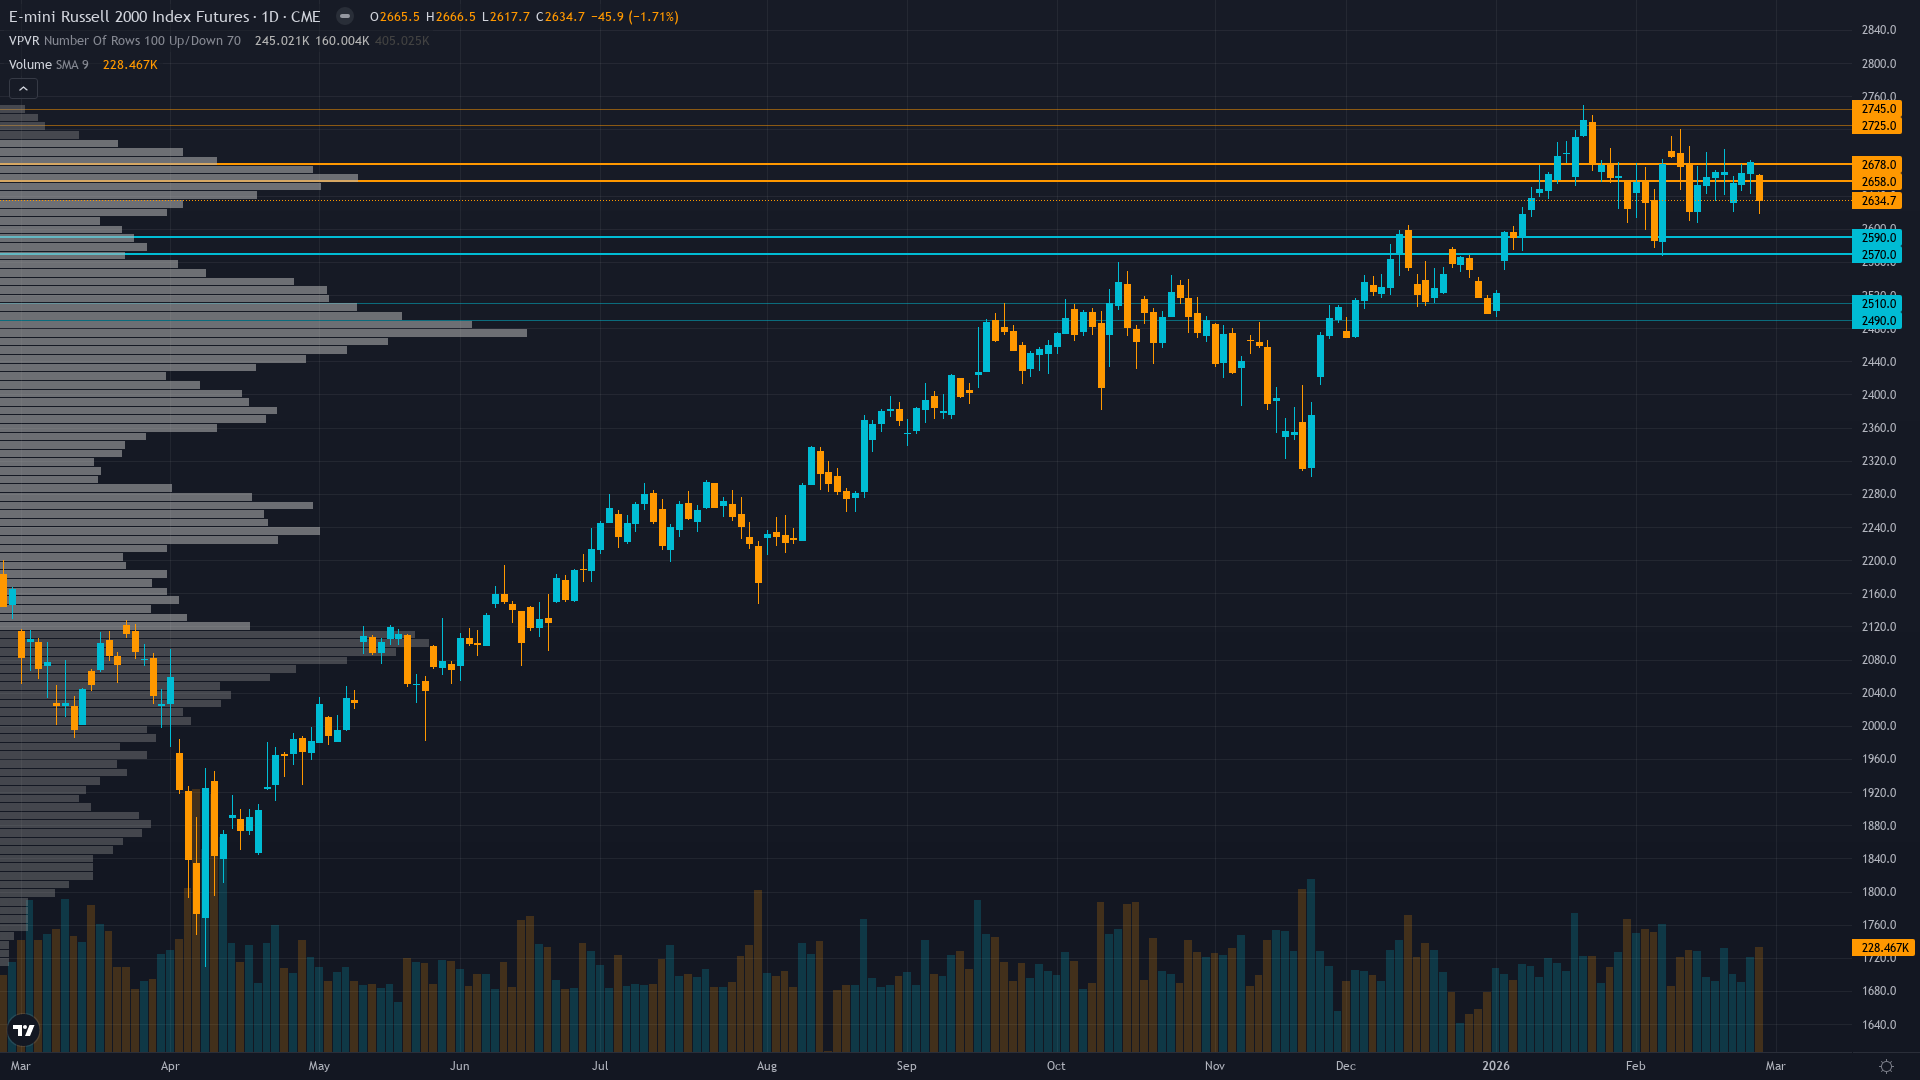
Multi-month consolidation 3.9% below January 22 all-time high of 2735 following historic breakout after three-year resistance
Fed policy pause at January 29 FOMC removing near-term catalyst despite structural rate sensitivity benefits from 100bp easing delivered
February-March seasonal weakness creating consolidation pressure after 8.2% January surge validated small-cap rotation narrative
| ▲ Resistance Zone 2 | 2720 – 2750 |
| ▲ Resistance Zone 1 | 2653 – 2683 |
| ─ Pivot Area | ~2630 |
| ▼ Support Zone 1 | 2565 – 2595 |
| ▼ Support Zone 2 | 2485 – 2515 |
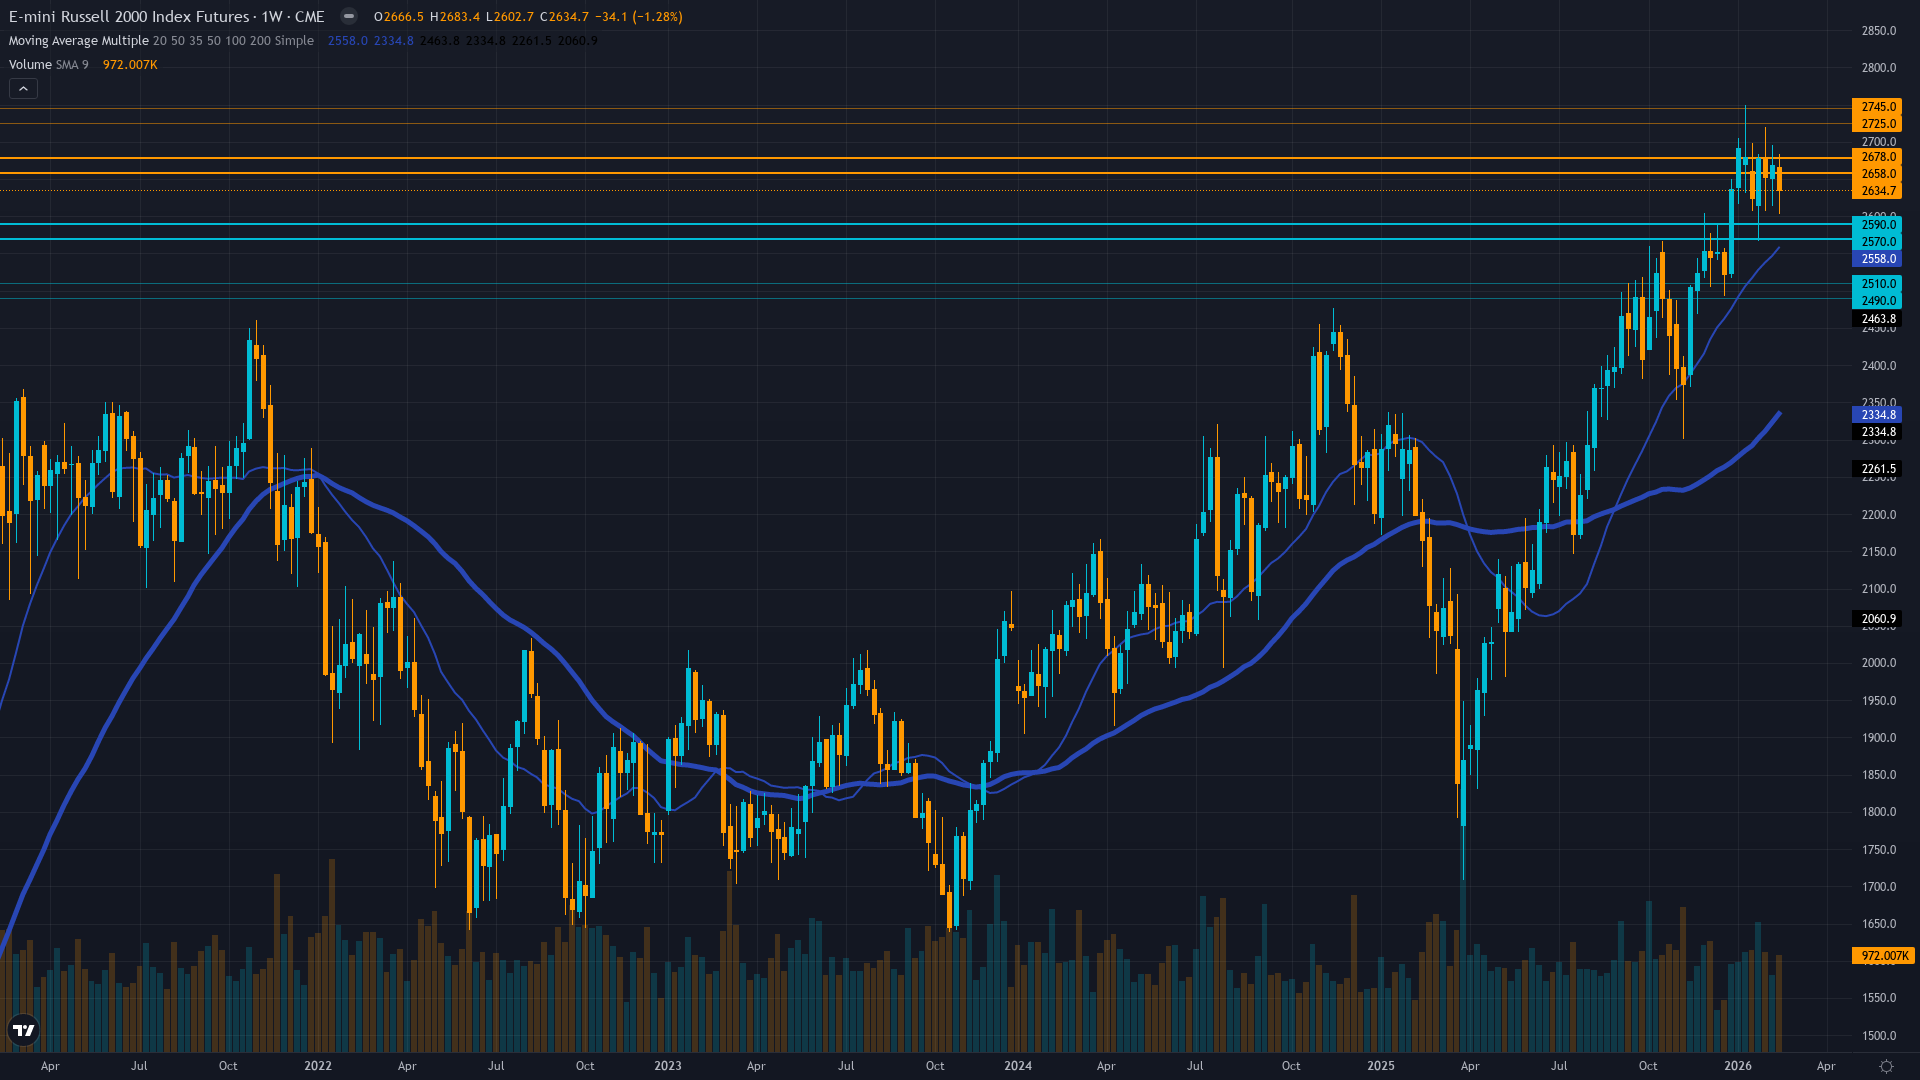
Consolidating 3.9% below January 22 ATH at 2735 after historic three-year breakout above 2596, holding critical 2580-2668 range with normal volatility regime
P/E 18.11 represents attractive 18% discount to S&P 500 with superior 2026 earnings growth of 18-22% projected versus large-cap 13-15%
Net long with elevated positioning after 18.4% year-over-year rally from January 2025 lows, rotation from mega-cap tech continuing but stretched
RVX at 26.29 as of February 27 showing modest expansion from prior extreme 60+ day compression, breaking from historically low sub-20 levels that preceded breakout
Fed funds at 3.5-3.75% after three consecutive cuts but January 29 FOMC paused with no cut, creating policy uncertainty offset by benign credit conditions with HY spreads near historical tights at 2.86%
Normal - short-term vol 22.5 below long-term 25.2 reflecting confidence in breakout with measured expansion from prior extreme 60+ day compression
When RTY breaks multi-year resistance after extended volatility compression, historical precedent shows 15-25% continuation moves within 3-6 months in 65% of cases with direction confirmed by follow-through above breakout level and earnings validation
Volatility stabilized after breaking from record 60-day compression in December-January, current normal regime at 42nd percentile suggests sustainable breakout conditions rather than climactic spike requiring mean reversion
Normal volatility regime supports standard risk management with 2-3% stops below 2580 support, expect 45-65 point daily ranges versus 25-35 during compression with breakout follow-through potentially triggering 80-100 point moves on extension above 2700
Current volatility setup at 42nd percentile after breaking from 28th percentile extreme compression offers asymmetric opportunity for 12-18% extension moves toward 2900-3000 measured targets from multi-year consolidation versus 5-7% typical consolidation risk toward 2580-2500 support if February seasonal weakness intensifies
|
⚠️ Primary Risk
Fed maintaining extended pause through Q1 2026 at March FOMC combining with February-March seasonal weakness triggering 5-8% correction toward 2500 major support Probability: MEDIUM
|
✦ Primary Opportunity
Recovery toward 2668 recent level and potential extension toward 2735 ATH retest as March transitions into historically stronger April-May period if Fed maintains accommodative stance Timeframe: 3-6 weeks through March FOMC and into Q2 earnings season validation period
|
Russell 2000 stands at a critical inflection point on March 1, 2026, trading at 2630 following a historic January that saw the small-cap benchmark shatter three years of consolidation by surging to an all-time high of 2735 on January 22—decisively breaking the November 2021 record of 2596 and validating the powerful small-cap rotation narrative driven by the Fed's 100bp easing cycle beginning September 2025. However, the index has experienced notable volatility in recent weeks, with the February 24-28 week closing down -1.37% at 2630, representing a 3.9% pullback from the January peak.
This consolidation reflects the classic tug-of-war between structural tailwinds and tactical headwinds that has defined RTY throughout Q1. The fundamental case remains structurally compelling: small-caps trade at a P/E of 18.11 representing an attractive 18% discount to S&P 500's 22x valuation while offering superior earnings growth prospects of 18-22% projected for 2026 versus large-cap 13-15%. Small-caps' higher debt loads (1.5x debt-to-equity versus 0.8x for S&P 500) position them as disproportionate beneficiaries of the Fed's 100bp easing already delivered despite the January 29 pause removing near-term catalyst potency.
February-March seasonality historically presents neutral-to-weak headwinds for small-caps, particularly following strong January gains, creating natural consolidation pressure. Most critically from a volatility perspective, RVX has expanded to 26.29 as of February 27 from the extreme 60+ day compression below 20 that characterized October-December, suggesting the long-awaited mean reversion is underway. Credit conditions remain exceptionally benign with HY spreads at 2.86% near historical tights, indicating the credit-sensitive nature of small-caps faces no stress despite elevated valuations.
The technical structure shows the index maintaining the bullish breakout pattern established in January but requiring consolidation to digest the extraordinary rally from 2238 in September to 2735 in January—a remarkable 22.2% advance in just four months. Immediate support at 2580 must hold to maintain constructive structure, while resistance at 2668 (prior week's level) needs to be cleared to reopen the path toward 2735 retest. Institutional positioning remains elevated after the sustained rally but flows show patient accumulation rather than panic distribution.
The March 19 FOMC meeting looms as the next major catalyst following the January 29 pause, with forward guidance proving critical for direction. The setup favors patient accumulation on pullbacks toward 2580 support with extension targets toward 2735-2800 as Q1 earnings season validates the 18-22% growth inflection through April-May, though near-term risks from February-March seasonal weakness, Fed pause uncertainty, and stretched positioning after the January surge warrant measured caution at elevated levels.
The devil's advocate perspective: the combination of Fed removing near-term easing catalyst, stretched positioning after 22% rally in four months, February-March historical weakness, and proximity to all-time highs creates vulnerability to deeper 5-8% correction toward 2500 if March FOMC confirms extended pause or Q1 earnings disappoint elevated growth expectations.
| Week | Bias | Confidence | Result |
|---|---|---|---|
| February 27, 2026 | BULLISH | 7/10 | ❌ |
| February 21, 2026 | BULLISH | 7/10 | ✅ |
| February 13, 2026 | BULLISH | 7/10 | ✅ |
| February 8, 2026 | BULLISH | 7/10 | ✅ |
| February 1, 2026 | BULLISH | 7/10 | ✅ |
| January 25, 2026 | BULLISH | 7/10 | ❌ |
| January 11, 2026 | BULLISH | 8/10 | ✅ |
| January 4, 2026 | NO CALL | 6/10 | ➖ |
| December 28, 2025 | NO CALL | 6/10 | ➖ |
| December 21, 2025 | NO CALL | 6/10 | ➖ |
| December 14, 2025 | NO CALL | 7/10 | ➖ |
| December 7, 2025 | BULLISH | 7/10 | ✅ |
📋 PROMPT-READY CONTEXT
Copy this entire block into any AI chat for follow-up analysis
▼ Expand
MACRO AGENT DESK — WEEKLY INTELLIGENCE BRIEFING
═════════════════════════════════════════════════
Asset: Russell 2000 (RTY)
Report Date: March 1, 2026

── DIRECTIONAL BIAS ─────────────────────────────
Call: NO CALL
Confidence: 6/10
Signal: NO DIRECTIONAL CALL THIS WEEK
MAD Index: 35 (SLIGHT DIVERGENCE)

── MARKET CONTEXT ───────────────────────────────
State: CONSOLIDATING
Regime: TRENDING UP
Sentiment: NEUTRAL

── WHAT THE MARKET SEES ─────────────────────────
Small-caps positioned to extend outperformance following historic January breakout with superior 18-22% earnings growth and Fed easing supporting continued rotation despite near-term seasonal consolidation

── WHAT THE MARKET IS MISSING ───────────────────
Market may be underestimating February-March seasonal consolidation pressure and Fed pause impact removing near-term catalyst while overweighting earnings growth optimism at elevated levels requiring deeper digestion before 2750+ extension, though multi-year breakout pattern suggests eventual measured move targets toward 2800-2900 over 3-6 months with Q1 earnings providing next directional inflection

── KEY DRIVERS ──────────────────────────────────
1. Multi-month consolidation 3.9% below January 22 all-time high of 2735 following historic breakout after three-year resistance
2. Fed policy pause at January 29 FOMC removing near-term catalyst despite structural rate sensitivity benefits from 100bp easing delivered
3. February-March seasonal weakness creating consolidation pressure after 8.2% January surge validated small-cap rotation narrative

── KEY ZONES ────────────────────────────────────
Resistance 2: 2720 – 2750
Resistance 1: 2653 – 2683
Pivot: ~2630
Support 1: 2565 – 2595
Support 2: 2485 – 2515

── DISCIPLINE BIASES ────────────────────────────
Technical: BULLISH
Fundamental: BULLISH
Institutional: BULLISH
Options: NO CALL
Economic: NO CALL
Sentiment: NO CALL

── TECHNICAL STRUCTURE ──────────────────────────
Consolidating 3.9% below January 22 ATH at 2735 after historic three-year breakout above 2596, holding critical 2580-2668 range with normal volatility regime

── FUNDAMENTAL ASSESSMENT ───────────────────────
P/E 18.11 represents attractive 18% discount to S&P 500 with superior 2026 earnings growth of 18-22% projected versus large-cap 13-15%

── INSTITUTIONAL POSITIONING ────────────────────
Net long with elevated positioning after 18.4% year-over-year rally from January 2025 lows, rotation from mega-cap tech continuing but stretched

── OPTIONS FLOW ─────────────────────────────────
RVX at 26.29 as of February 27 showing modest expansion from prior extreme 60+ day compression, breaking from historically low sub-20 levels that preceded breakout

── ECONOMIC BACKDROP ────────────────────────────
Fed funds at 3.5-3.75% after three consecutive cuts but January 29 FOMC paused with no cut, creating policy uncertainty offset by benign credit conditions with HY spreads near historical tights at 2.86%

── VOLATILITY REGIME ────────────────────────────
Regime: NORMAL
Percentile: 42nd
Trend: Stable —
Days in Regime: 35
Term Structure: normal - short-term vol 22.5 below long-term 25.2 reflecting confidence in breakout with measured expansion from prior extreme 60+ day compression
Historical Pattern: When RTY breaks multi-year resistance after extended volatility compression, historical precedent shows 15-25% continuation moves within 3-6 months in 65% of cases with direction confirmed by follow-through above breakout level and earnings validation
Outlook: Volatility stabilized after breaking from record 60-day compression in December-January, current normal regime at 42nd percentile suggests sustainable breakout conditions rather than climactic spike requiring mean reversion
Trading Context: Normal volatility regime supports standard risk management with 2-3% stops below 2580 support, expect 45-65 point daily ranges versus 25-35 during compression with breakout follow-through potentially triggering 80-100 point moves on extension above 2700
Vol Risk/Opportunity: Current volatility setup at 42nd percentile after breaking from 28th percentile extreme compression offers asymmetric opportunity for 12-18% extension moves toward 2900-3000 measured targets from multi-year consolidation versus 5-7% typical consolidation risk toward 2580-2500 support if February seasonal weakness intensifies

── PRIMARY RISK ─────────────────────────────────
Fed maintaining extended pause through Q1 2026 at March FOMC combining with February-March seasonal weakness triggering 5-8% correction toward 2500 major support
Probability: MEDIUM

── PRIMARY OPPORTUNITY ──────────────────────────
Recovery toward 2668 recent level and potential extension toward 2735 ATH retest as March transitions into historically stronger April-May period if Fed maintains accommodative stance
Timeframe: 3-6 weeks through March FOMC and into Q2 earnings season validation period

── NEXT CATALYST ────────────────────────────────
Date: March 19, 2026
Event: Federal Reserve FOMC Meeting with updated economic projections and rate path guidance following January 29 pause confirmation
Expected Impact: HIGH

── FULL ANALYSIS ────────────────────────────────
Russell 2000 stands at a critical inflection point on March 1, 2026, trading at 2630 following a historic January that saw the small-cap benchmark shatter three years of consolidation by surging to an all-time high of 2735 on January 22—decisively breaking the November 2021 record of 2596 and validating the powerful small-cap rotation narrative driven by the Fed's 100bp easing cycle beginning September 2025. However, the index has experienced notable volatility in recent weeks, with the February 24-28 week closing down -1.37% at 2630, representing a 3.9% pullback from the January peak. This consolidation reflects the classic tug-of-war between structural tailwinds and tactical headwinds that has defined RTY throughout Q1. The fundamental case remains structurally compelling: small-caps trade at a P/E of 18.11 representing an attractive 18% discount to S&P 500's 22x valuation while offering superior earnings growth prospects of 18-22% projected for 2026 versus large-cap 13-15%. Small-caps' higher debt loads (1.5x debt-to-equity versus 0.8x for S&P 500) position them as disproportionate beneficiaries of the Fed's 100bp easing already delivered despite the January 29 pause removing near-term catalyst potency. February-March seasonality historically presents neutral-to-weak headwinds for small-caps, particularly following strong January gains, creating natural consolidation pressure. Most critically from a volatility perspective, RVX has expanded to 26.29 as of February 27 from the extreme 60+ day compression below 20 that characterized October-December, suggesting the long-awaited mean reversion is underway. Credit conditions remain exceptionally benign with HY spreads at 2.86% near historical tights, indicating the credit-sensitive nature of small-caps faces no stress despite elevated valuations. The technical structure shows the index maintaining the bullish breakout pattern established in January but requiring consolidation to digest the extraordinary rally from 2238 in September to 2735 in January—a remarkable 22.2% advance in just four months. Immediate support at 2580 must hold to maintain constructive structure, while resistance at 2668 (prior week's level) needs to be cleared to reopen the path toward 2735 retest. Institutional positioning remains elevated after the sustained rally but flows show patient accumulation rather than panic distribution. The March 19 FOMC meeting looms as the next major catalyst following the January 29 pause, with forward guidance proving critical for direction. The setup favors patient accumulation on pullbacks toward 2580 support with extension targets toward 2735-2800 as Q1 earnings season validates the 18-22% growth inflection through April-May, though near-term risks from February-March seasonal weakness, Fed pause uncertainty, and stretched positioning after the January surge warrant measured caution at elevated levels. The devil's advocate perspective: the combination of Fed removing near-term easing catalyst, stretched positioning after 22% rally in four months, February-March historical weakness, and proximity to all-time highs creates vulnerability to deeper 5-8% correction toward 2500 if March FOMC confirms extended pause or Q1 earnings disappoint elevated growth expectations.

═════════════════════════════════════════════════
Source: Macro Agent Desk (macroagentdesk.com)


