Russell 2000 (RTY) — consolidating in normal regime
Small-caps positioned to extend outperformance following historic breakout with superior 18-22% earnings growth and Fed easing cycle supporting continued rotation despite near-term seasonal consolidation

Small-caps positioned to extend outperformance following historic breakout with superior 18-22% earnings growth and Fed easing cycle supporting continued rotation despite near-term seasonal consolidation
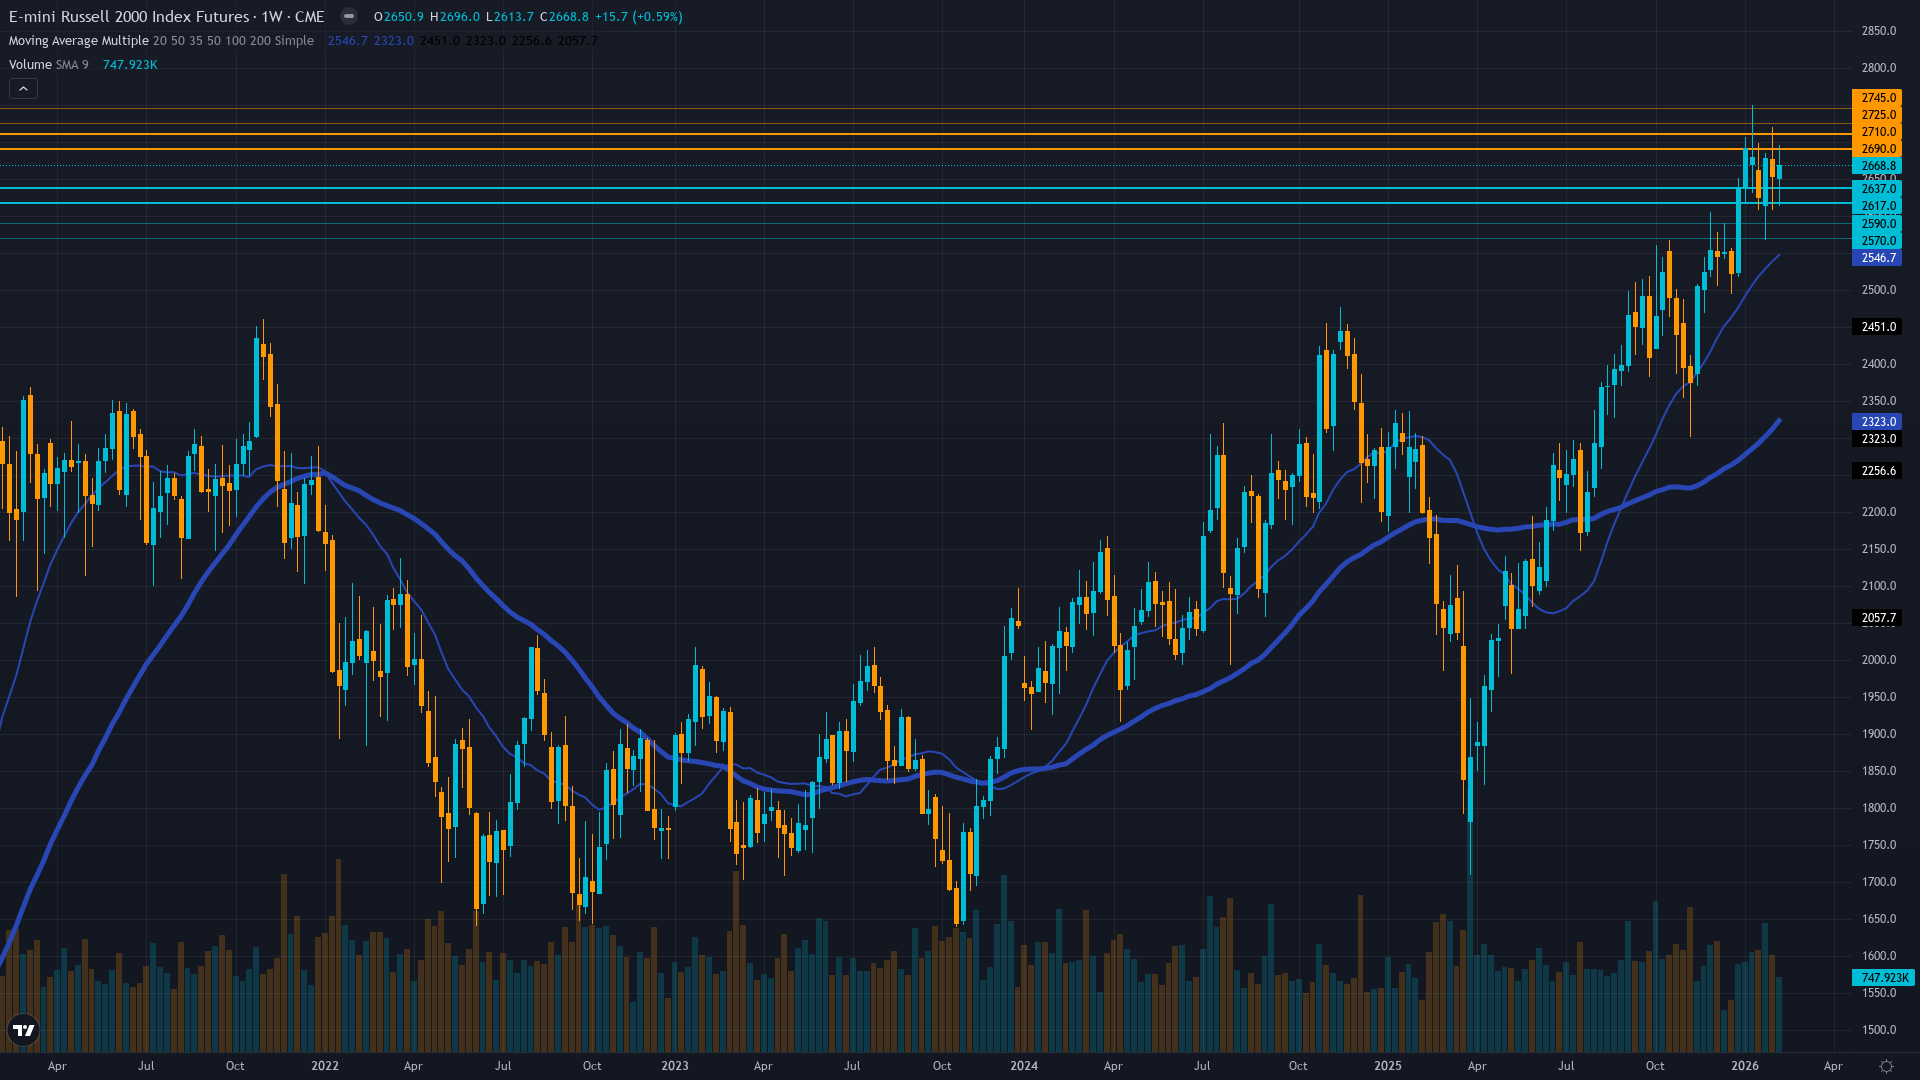
Historic January 2026 breakout above three-year resistance at 2596 validating multi-year small-cap rotation following Fed's 100bp easing cycle
Superior earnings growth outlook of 18-22% for 2026 significantly outpacing S&P 500's 13-15% providing fundamental support despite Fed March pause expectations
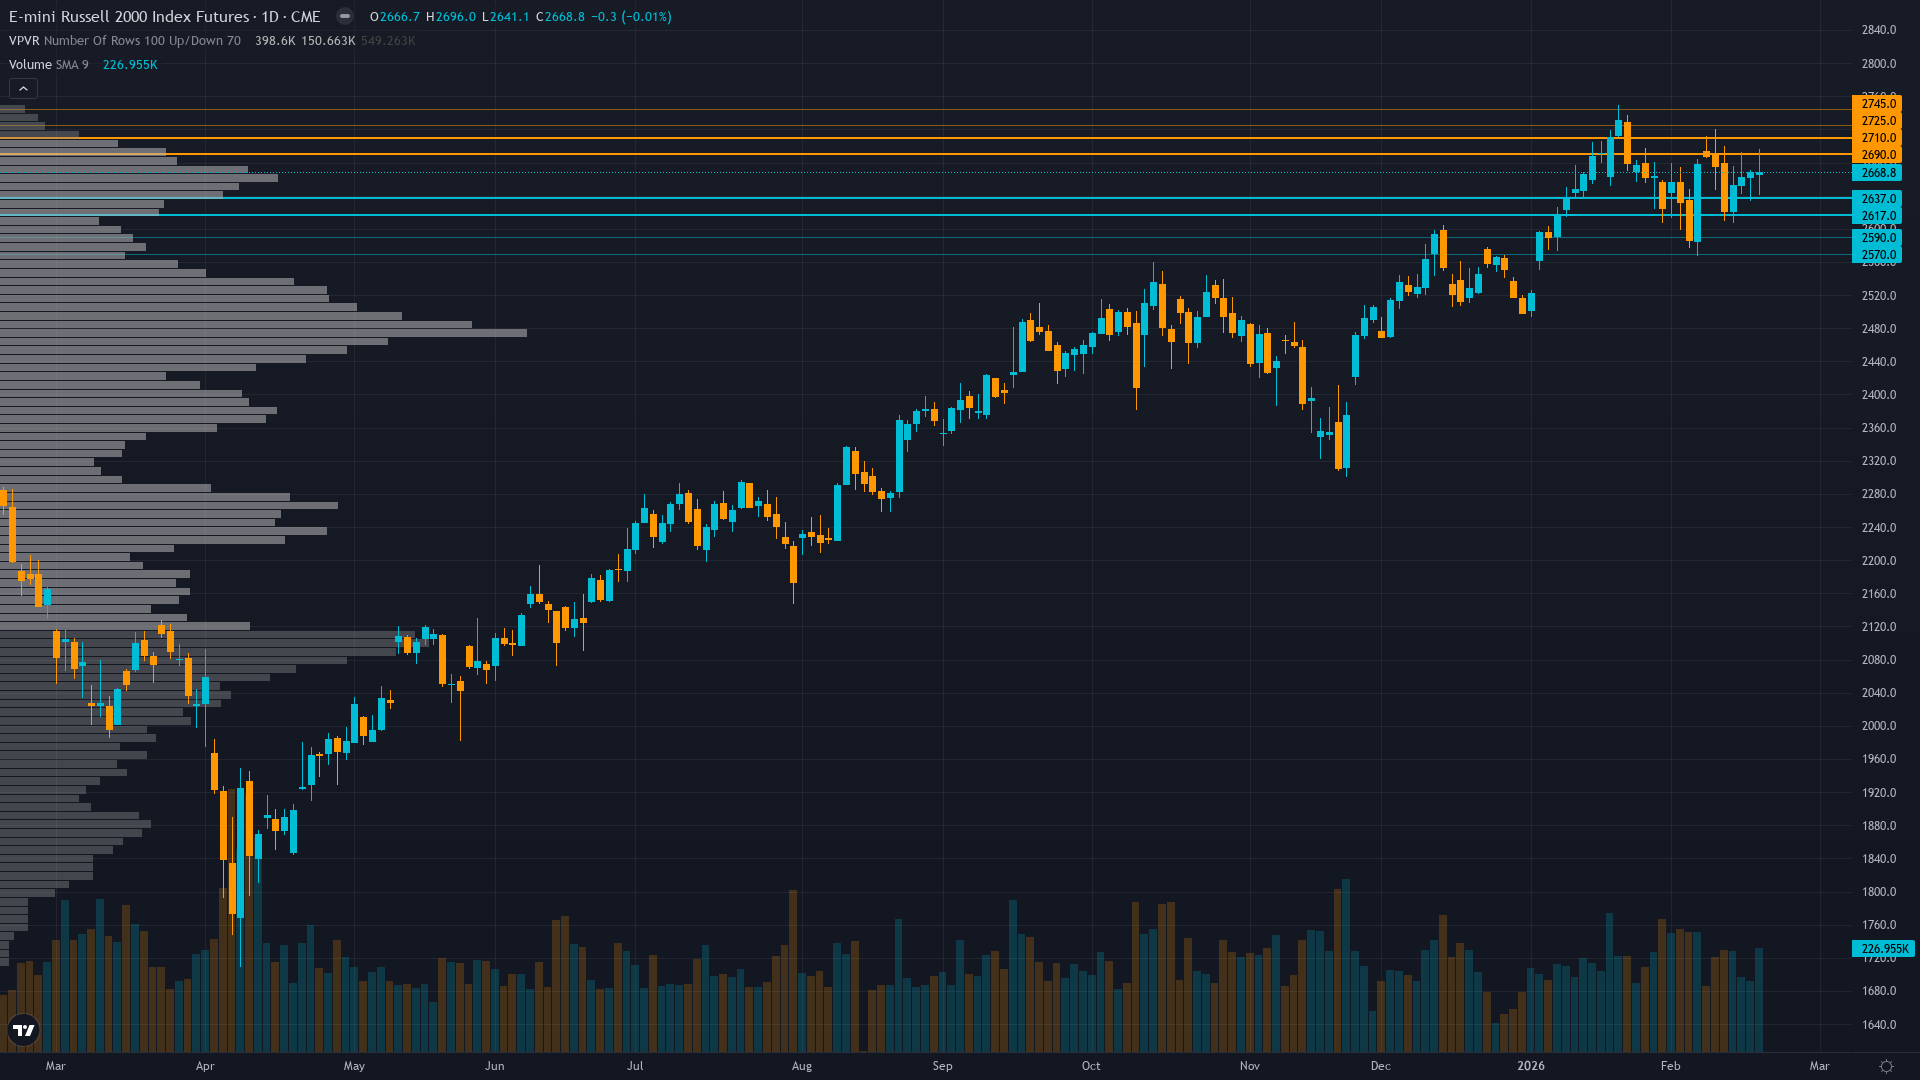
February-March seasonal consolidation after 8.11% January surge creating healthy digestion 2.4% below January 22 all-time high of 2735
| ▲ Resistance Zone 2 | 2720 – 2750 |
| ▲ Resistance Zone 1 | 2685 – 2715 |
| ─ Pivot Area | ~2669 |
| ▼ Support Zone 1 | 2612 – 2642 |
| ▼ Support Zone 2 | 2565 – 2595 |
Consolidating 2.4% below January 22 all-time high of 2735 after historic breakout, holding critical 2627-2650 support with technical indicators showing Strong Buy signals
P/E at 18.11 represents attractive 18% discount to S&P 500 with superior 2026 earnings growth of 18-22% projected versus large-cap 13-15%
Net long with elevated positioning after 17.14% year-over-year rally, rotation from mega-cap tech continuing but approaching stretched levels
RVX at 25.64 as of February 13 showing modest expansion from prior 20.06 levels, breaking from extended 60+ day compression suggesting sustainable breakout rather than climactic exhaustion
Fed funds at 4.25-4.50% after three consecutive cuts, January 29 FOMC paused with March meeting pricing low probability of cut as markets adjust to slower 2026 easing pace
Normal - short-term vol 22.5 below long-term 25.2 reflecting confidence in breakout with measured expansion from prior extreme 60+ day compression
When RTY breaks multi-year resistance after extended volatility compression, historical precedent shows 15-25% continuation moves within 3-6 months in 65% of cases with direction confirmed by follow-through above breakout level and earnings validation
Volatility stabilized after breaking from record 60-day compression in December-January, current normal regime at 42nd percentile suggests sustainable breakout conditions rather than climactic spike requiring mean reversion
Normal volatility regime supports standard risk management with 2-3% stops below 2627 support, expect 45-65 point daily ranges versus 25-35 during compression with breakout follow-through potentially triggering 80-100 point moves on extension above 2700
Current volatility setup at 42nd percentile after breaking from 28th percentile extreme compression offers asymmetric opportunity for 12-18% extension moves toward 2900-3000 measured targets from multi-year consolidation versus 5-7% typical consolidation risk toward 2580-2627 support if February seasonal weakness intensifies
|
⚠️ Primary Risk
Fed maintaining extended pause through Q1 2026 at March FOMC combining with stretched positioning triggering 5-8% correction toward 2500-2580 major support zone Probability: MEDIUM
|
✦ Primary Opportunity
Extension of January breakout momentum driving advance toward 2750-2800 measured targets as Q1 earnings season validates 18-22% growth inflection with March FOMC providing clarity Timeframe: 4-12 weeks through Q1 earnings season and March FOMC meeting
|
Russell 2000 stands at a pivotal inflection point on February 22, 2026, trading at 2668.80 following a historic January that saw the small-cap benchmark shatter three years of consolidation by surging to an all-time high of 2735 on January 22—decisively breaking the November 2021 record of 2596 and validating the powerful small-cap rotation narrative. This breakout represents the culmination of an extraordinary rally from 1733 in January 2025, marking a 17.14% year-over-year advance driven by the Fed's 100bp easing cycle beginning September 2025.
The index currently consolidates just 2.4% below record highs at 2668.80, exhibiting healthy digestion following the explosive 8.11% January surge that significantly outpaced large-cap indices. The fundamental case remains structurally compelling with consensus projecting robust 18-22% small-cap earnings growth for 2026—nearly double the S&P 500's 13-15% forecast—while Russell 2000 constituents trade at a P/E of 18.11 representing an attractive 18% discount to large-cap 22x valuations. Small-caps' higher debt loads position them as disproportionate beneficiaries of the Fed's 100bp easing already delivered despite the January 29 FOMC pause removing near-term catalyst potency.
Current price action shows the last graded call on February 17-21 resulted in CORRECT with 0.68% weekly gain validating the BULLISH thesis, extending a four-week winning streak that demonstrates the breakout's sustainability. However, February-March seasonality presents neutral-to-weak headwinds historically following strong January gains, creating natural consolidation pressure. Volatility dynamics show RVX at 25.64 as of February 13, modestly expanding from the 20.06 level that characterized the extended 60+ day compression through December-January, suggesting sustainable advance rather than climactic exhaustion.
Technical structure confirms decisive breakout with the January 22 record at 2735 validating the multi-year cup-and-handle pattern, though immediate resistance at 2700 psychological level must be cleared to extend toward 2750-2800 measured targets. The 52-week range of 1733-2735 illustrates the extraordinary journey, with current positioning at 97% of range representing either the beginning of a secular advance or requiring deeper digestion. Institutional positioning has increased materially with rotation from mega-cap technology accelerating as investors seek exposure to rate-sensitive small-caps and superior earnings growth, though flows are approaching elevated levels requiring monitoring.
The March 19 FOMC meeting looms as the next major catalyst following January 29's pause, with markets pricing low probability of cut but forward guidance proving critical for direction. Devil's advocate perspective: the combination of stretched positioning after 17% YoY rally, Fed pause removing immediate catalyst, February seasonal weakness, and proximity to all-time highs creates vulnerability to profit-taking if March FOMC confirms extended pause or Q1 earnings disappoint the elevated 18-22% growth expectations.
The convergence of historic breakout confirmation after three-year consolidation, Fed policy uncertainty heading into March FOMC, February seasonal consolidation, attractive 18% valuation discount with superior 18-22% earnings growth outlook entering Q1 reporting season, and normal volatility regime supporting sustainable advance creates an environment where near-term consolidation around 2627-2700 appears likely before the next leg higher materializes through earnings validation in March-April.
| Week | Bias | Confidence | Result |
|---|---|---|---|
| February 21, 2026 | BULLISH | 7/10 | ✅ |
| February 13, 2026 | BULLISH | 7/10 | ✅ |
| February 8, 2026 | BULLISH | 7/10 | ✅ |
| February 1, 2026 | BULLISH | 7/10 | ✅ |
| January 25, 2026 | BULLISH | 7/10 | ❌ |
| January 11, 2026 | BULLISH | 8/10 | ✅ |
| January 4, 2026 | NO CALL | 6/10 | ➖ |
| December 28, 2025 | NO CALL | 6/10 | ➖ |
| December 21, 2025 | NO CALL | 6/10 | ➖ |
| December 14, 2025 | NO CALL | 7/10 | ➖ |
| December 7, 2025 | BULLISH | 7/10 | ✅ |
| November 30, 2025 | NO CALL | 6/10 | ➖ |


