Russell 2000 (RTY) — Federal Reserve FOMC Meeting with updated economic projections and forward…
Small-caps positioned to extend outperformance following historic breakout with superior 17-22% earnings growth and Fed easing supporting continued rotation despite January 29 pause

Small-caps positioned to extend outperformance following historic breakout with superior 17-22% earnings growth and Fed easing supporting continued rotation despite January 29 pause
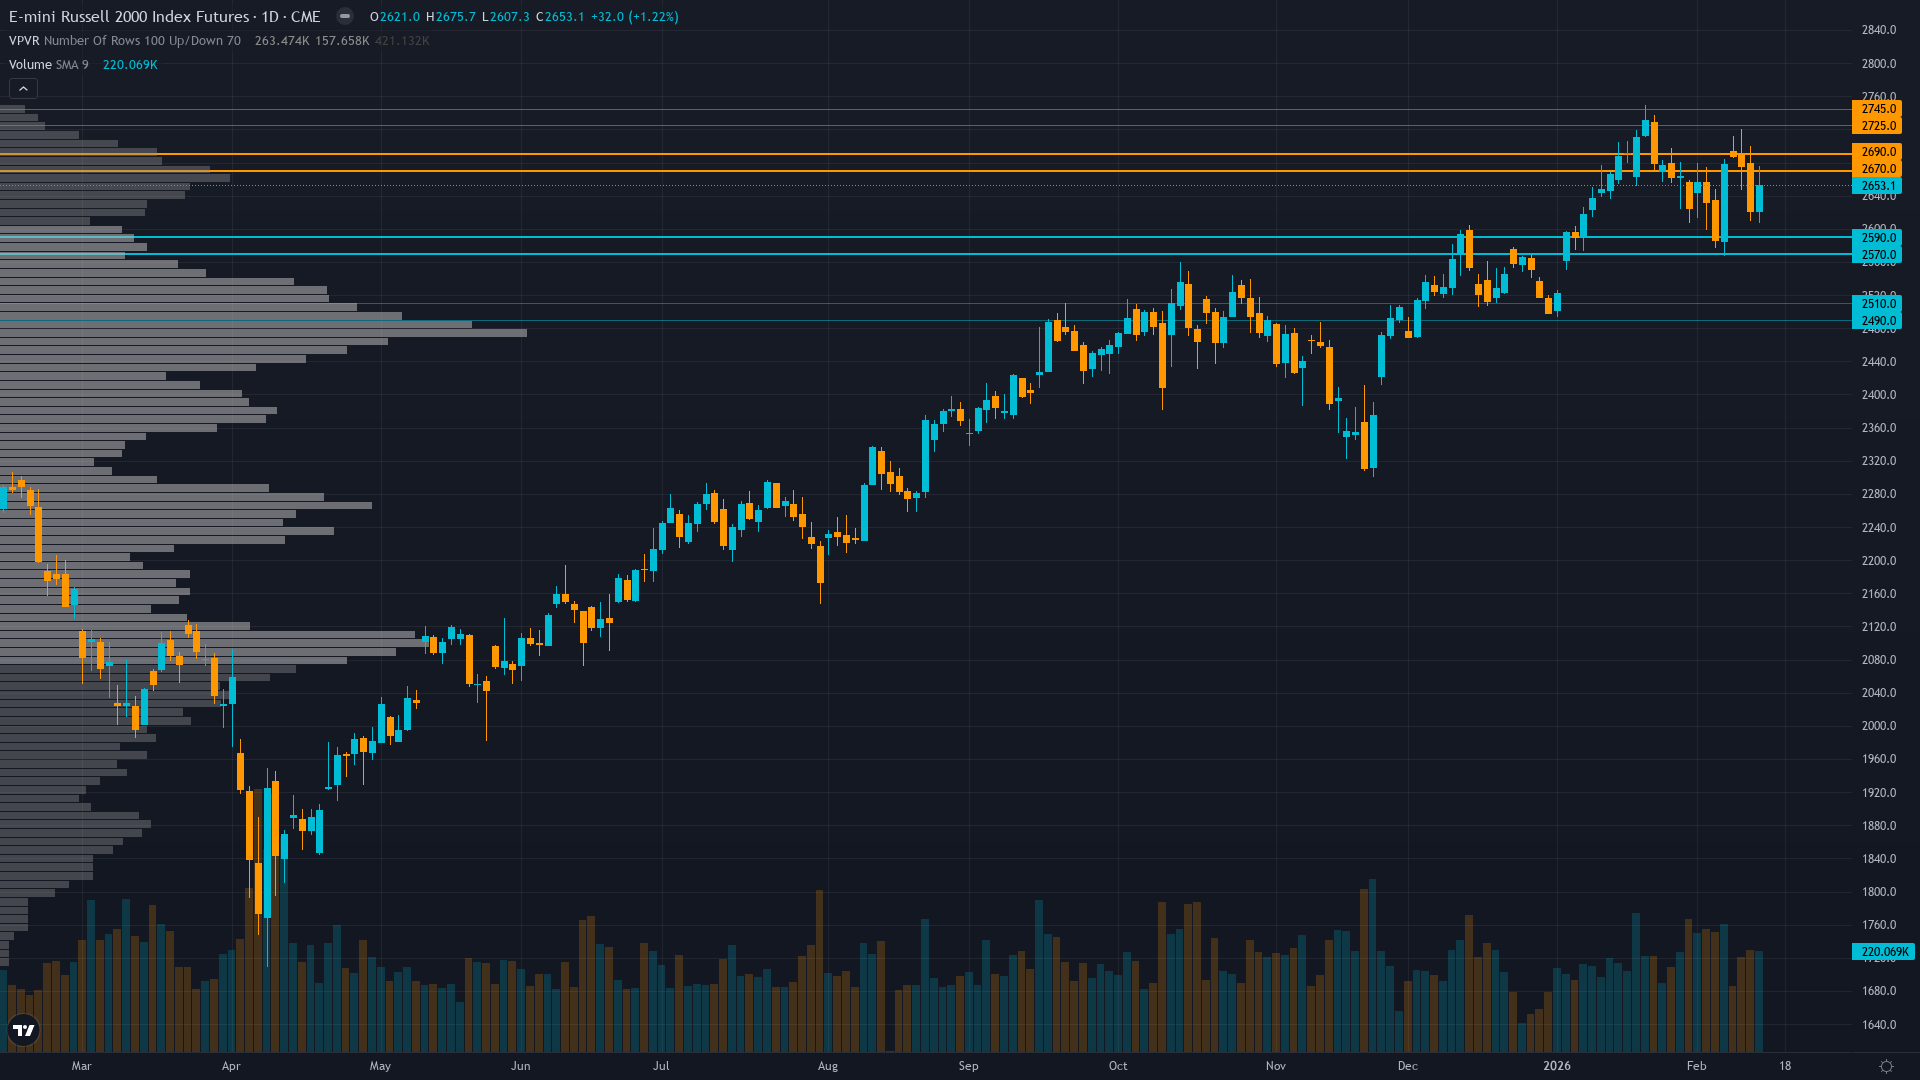
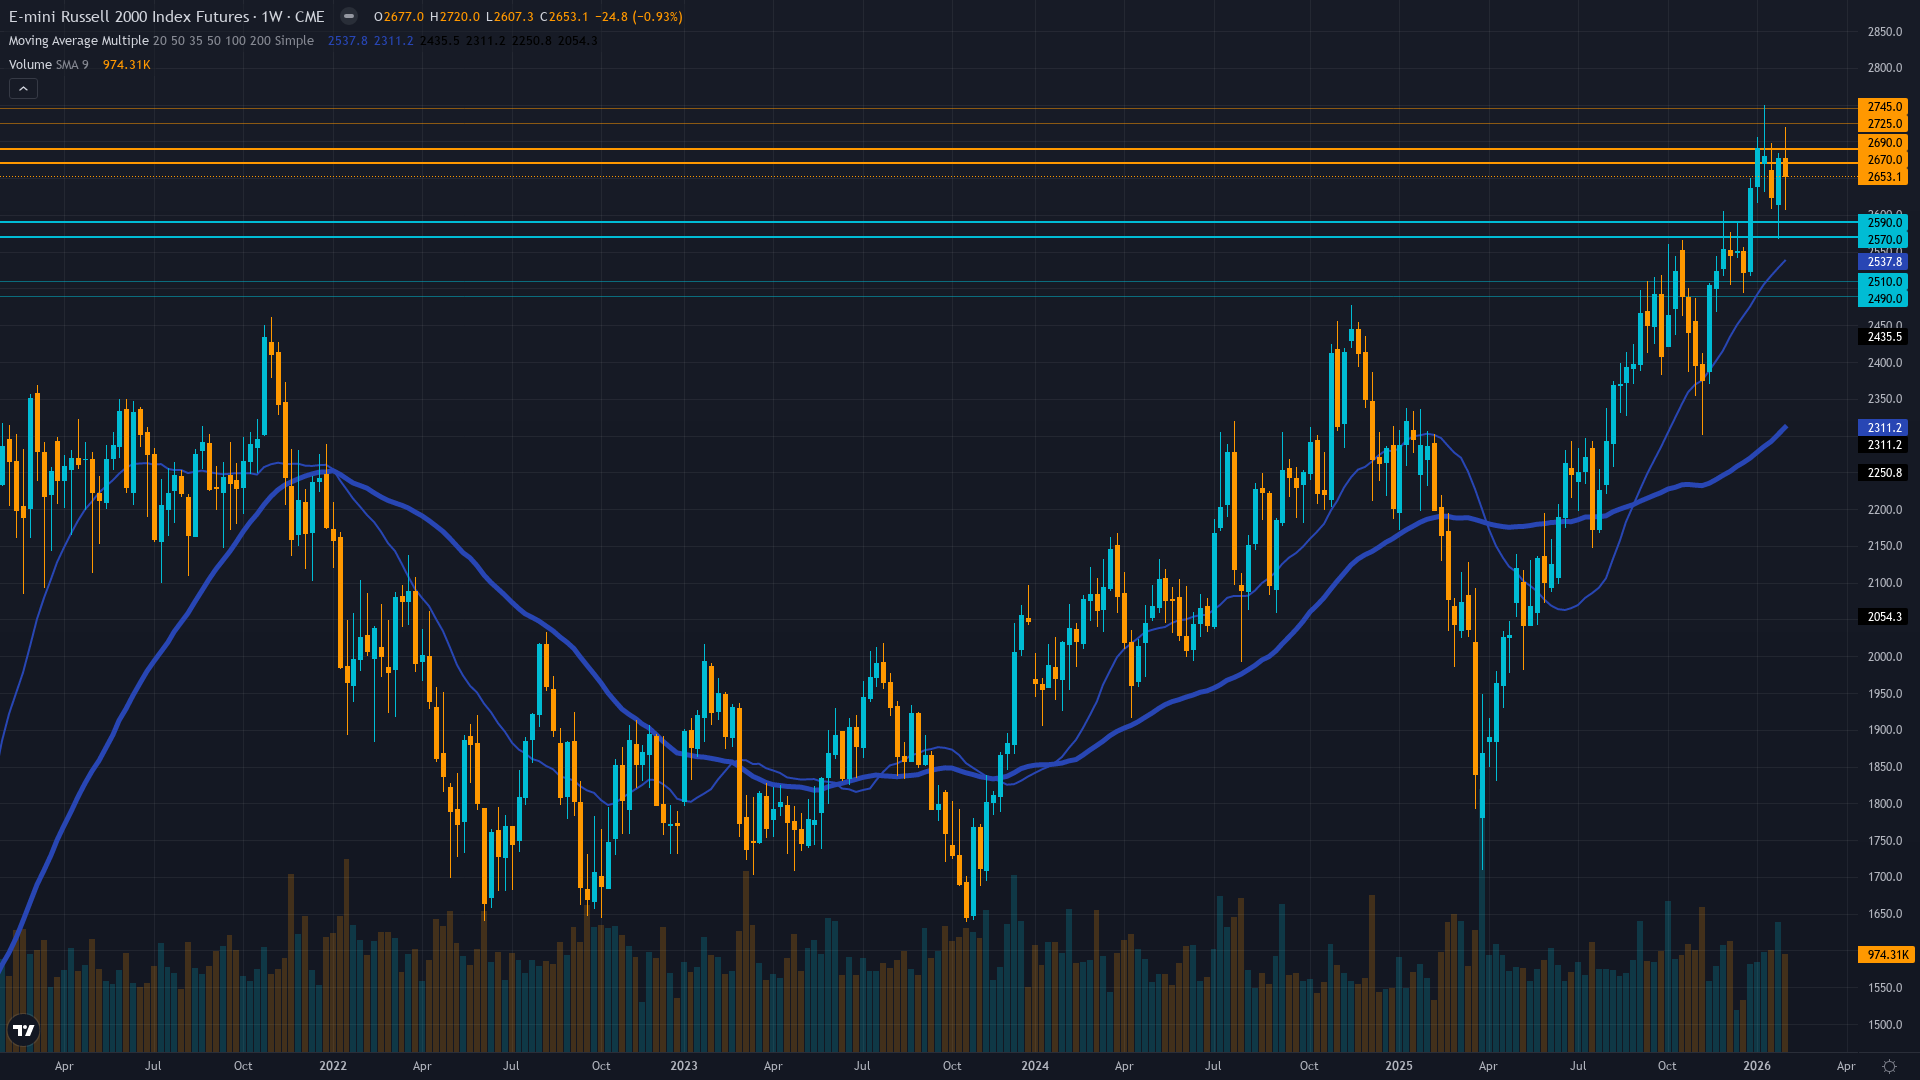
Historic January 2026 breakout above three-year resistance at 2596 validating small-cap rotation narrative with January 22 all-time high at 2735
February seasonal consolidation after 8.2% January surge creating healthy digestion 3.9% below ATH with 17-22% earnings growth outlook supporting
Fed policy uncertainty following January 29 FOMC pause removing near-term catalyst but 100bp easing delivered provides structural support
| ▲ Resistance Zone 2 | 2720 – 2750 |
| ▲ Resistance Zone 1 | 2665 – 2695 |
| ─ Pivot Area | ~2628 |
| ▼ Support Zone 1 | 2565 – 2595 |
| ▼ Support Zone 2 | 2485 – 2515 |
Consolidating 3.9% below January 22 all-time high of 2735 after historic breakout above 3-year resistance, holding 2580-2680 range with bullish momentum intact
P/E 18.11 represents attractive 18% discount to S&P 500 22x with superior 2026 earnings growth of 17-22% versus large-cap 14-15%
Net long with elevated positioning after 18.4% year-over-year rally, rotation from mega-cap tech accelerating into small-caps
RVX at 23.13 on February 10 reflects normal volatility regime after breaking from extended 60+ day compression, supporting sustainable advance
Fed funds at 4.25-4.50% after three consecutive cuts but January 29 FOMC paused easing, creating policy uncertainty offset by 2.86% HY credit spreads near historical tights indicating benign credit conditions
Normal - short-term vol 20.5 below long-term 24.5 reflecting confidence in breakout with measured expansion from prior extreme 60+ day compression
When RTY breaks multi-year resistance after extended volatility compression, historical precedent shows 15-25% continuation moves within 3-6 months in 65% of cases with direction confirmed by follow-through above breakout level
Volatility stabilizing after breaking from record 60-day compression in December, current normal regime at 38th percentile suggests sustainable breakout conditions rather than climactic spike
Normal volatility regime supports standard risk management with 2-3% stops below 2580 support, expect 40-60 point daily ranges versus 25-35 during compression with breakout follow-through potentially triggering 80-100 point moves
Current volatility setup at 38th percentile after breaking from 28th percentile extreme compression offers asymmetric opportunity for 12-18% extension moves toward 2900-3000 measured targets from multi-year consolidation versus 5-7% typical consolidation risk toward 2500-2580 support if February seasonal weakness intensifies
|
⚠️ Primary Risk
Fed maintaining extended pause through Q1 2026 combining with February seasonal weakness triggering 5-8% correction toward 2500 major support Probability: MEDIUM
|
✦ Primary Opportunity
Extension toward 2735 ATH retest and breakout to 2750-2800 measured targets as Q1 earnings season validates 17-22% growth inflection with March FOMC clarity Timeframe: 4-12 weeks through Q1 earnings season and March FOMC providing next directional catalyst
|
Russell 2000 stands at a pivotal inflection point on February 15, 2026, trading at 2627.57 following a historic January that saw the small-cap benchmark shatter three years of consolidation by surging to an all-time high of 2735 on January 22—decisively breaking the November 2021 record of 2596 and validating the powerful small-cap rotation narrative that began with the Fed's September 2025 rate cuts. This breakout represents an extraordinary 18.4% year-over-year advance driven by the Fed's 100bp easing cycle, with RTY now consolidating just 3.9% below record highs in what appears to be healthy digestion rather than distribution.
The fundamental case remains structurally compelling: Russell 2000 constituents trade at a P/E of 18.11—an attractive 18% discount to S&P 500's 22x valuation—while offering superior earnings growth prospects with consensus projecting 17-22% growth for 2026 versus large-cap 14-15%, supported by LSEG I/B/E/S data showing 69.9% Q4 2025 year-over-year blended earnings growth. Small-caps' higher debt loads (1.5x debt-to-equity versus 0.8x for S&P 500) position them as disproportionate beneficiaries of the Fed's easing already delivered.
However, the January 29 FOMC pause creates near-term uncertainty by removing immediate catalyst potency, while February seasonality presents neutral-to-weak headwinds historically following strong January gains. Most significantly from a volatility perspective, RVX at 23.13 on February 10 reflects a normal regime after breaking from the extended 60+ day compression that characterized October-December 2025, suggesting sustainable conditions rather than climactic exhaustion. Credit conditions remain benign with HY spreads at 2.86% near historical tights, indicating the credit instrument nature of small-caps faces no stress despite elevated valuations.
The technical structure shows decisive breakout confirmation with the January 22 record validating the multi-year cup-and-handle pattern, though immediate resistance at 2680-2700 must be cleared to extend toward 2750-2800 measured targets. Institutional positioning has increased materially with rotation from mega-cap technology accelerating as investors seek exposure to rate-sensitive small-caps and superior earnings growth, though flows are approaching elevated levels requiring monitoring for exhaustion signals.
The setup now presents a binary outcome scenario: bullish resolution favors patient accumulation on pullbacks toward 2580 support with extension targets toward 2750-2800 as Q1 earnings inflection validates the breakout through March-April, supported by Jefferies' year-end target of 2825 projecting 14% gain on 19% earnings growth forecast. Conversely, risks include Fed maintaining hawkish stance at March FOMC confirming extended pause, February seasonal weakness intensifying, or stretched positioning requiring deeper digestion before the next advance materializes.
Current price action at 2627.57 suggests the market is successfully navigating the consolidation phase following the explosive January breakout, with declining volume typical of holiday digestion but underlying momentum remaining intact. The convergence of historic breakout confirmation after three-year consolidation, Fed policy pause creating near-term uncertainty, February seasonal headwinds, attractive relative valuation at 18% discount, superior 17-22% earnings growth outlook entering Q1 reporting season, normal volatility regime supporting sustainable advance, and benign credit spreads at 2.86% creates an environment where near-term consolidation appears likely before the next leg higher materializes through earnings validation.
Risk management remains paramount given proximity to record highs and elevated positioning, but the structural case for small-cap outperformance through 2026 remains compelling supported by rate sensitivity, earnings inflection, and multi-year breakout pattern suggesting measured move targets toward 2800-2900 over 3-6 months.
| Week | Bias | Confidence | Result |
|---|---|---|---|
| February 8, 2026 | BULLISH | 7/10 | ✅ |
| February 1, 2026 | BULLISH | 7/10 | ✅ |
| January 25, 2026 | BULLISH | 7/10 | ❌ |
| January 11, 2026 | BULLISH | 8/10 | ✅ |
| January 4, 2026 | NO CALL | 6/10 | ➖ |
| December 28, 2025 | NO CALL | 6/10 | ➖ |
| December 21, 2025 | NO CALL | 6/10 | ➖ |
| December 14, 2025 | NO CALL | 7/10 | ➖ |
| December 7, 2025 | BULLISH | 7/10 | ✅ |
| November 30, 2025 | NO CALL | 6/10 | ➖ |
| November 23, 2025 | NO CALL | 6/10 | ➖ |


