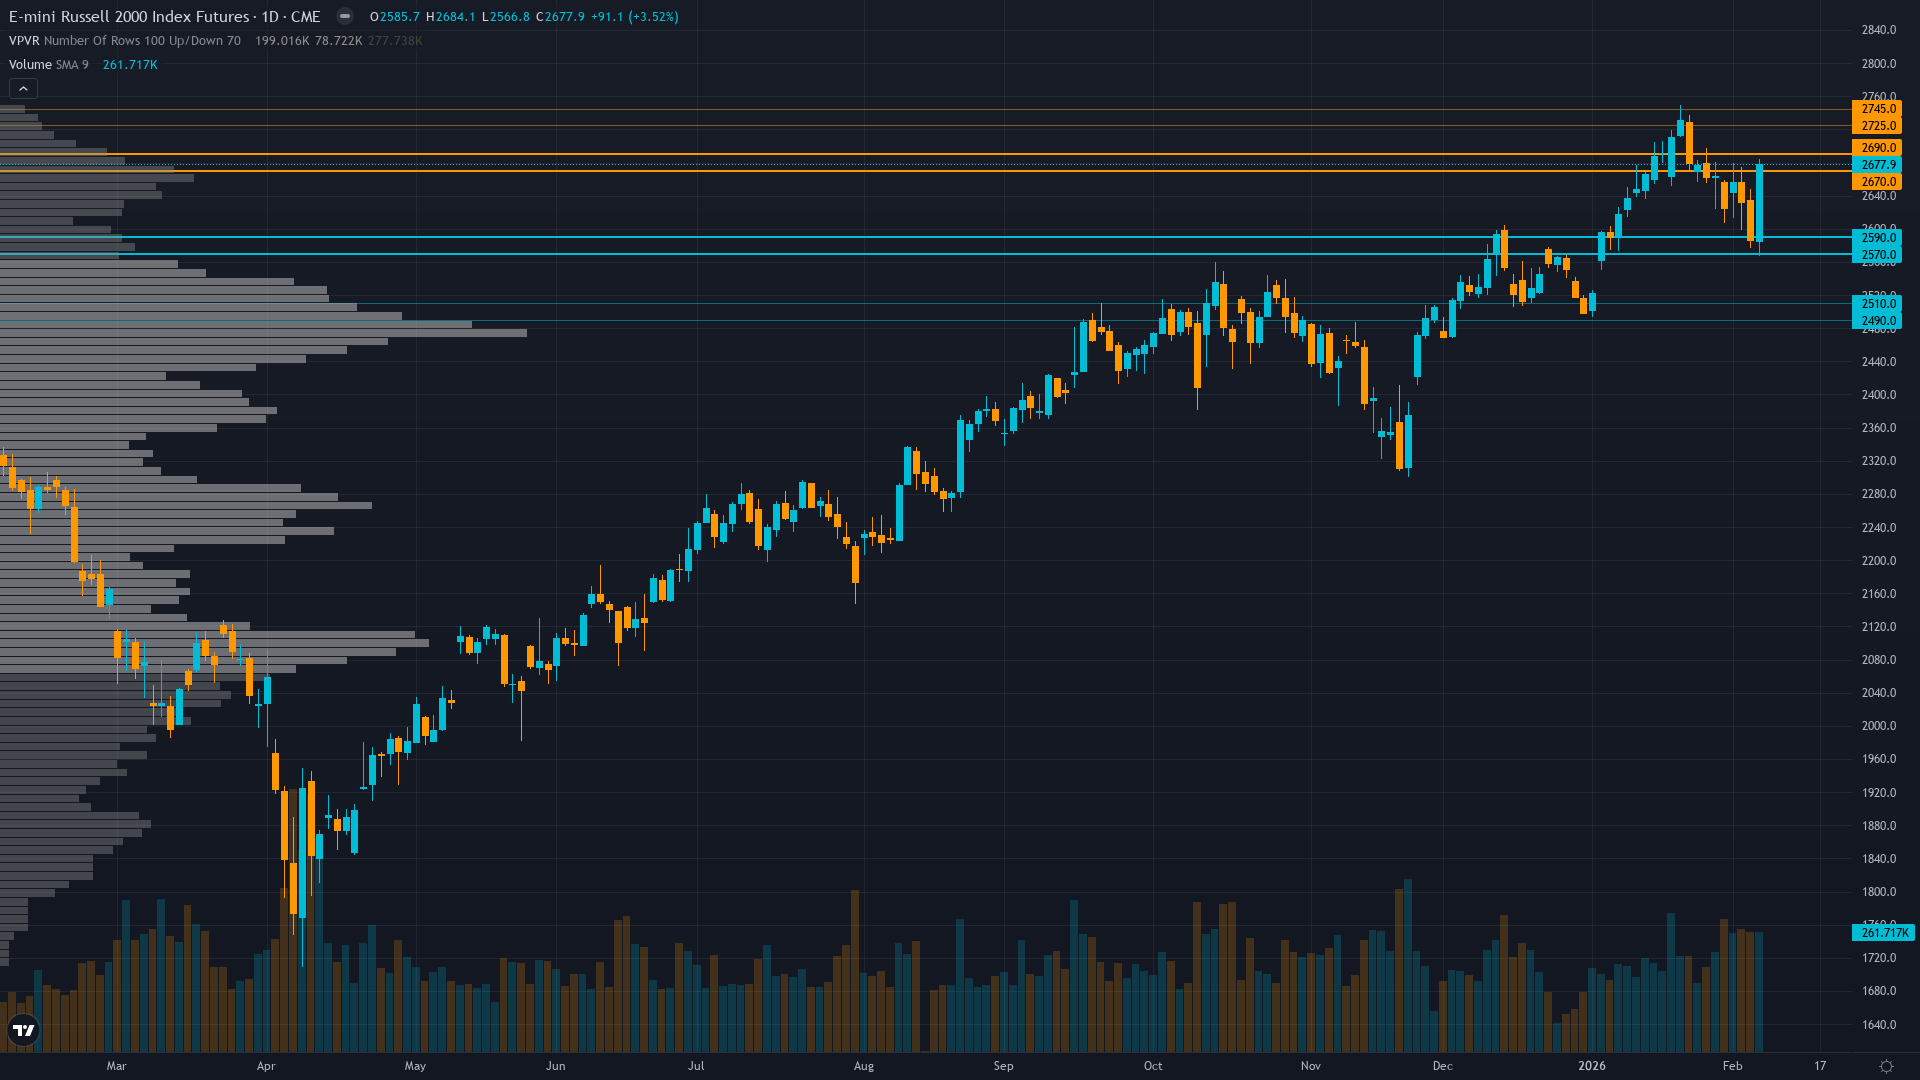
Russell 2000 (RTY) — Historic January breakout above 3-year resistance at 2596 validating small-cap…
Small-caps positioned to extend outperformance following historic breakout with superior 17-22% earnings growth and Fed easing supporting continued rotation despite January 29 pause

Small-caps positioned to extend outperformance following historic breakout with superior 17-22% earnings growth and Fed easing supporting continued rotation despite January 29 pause
Historic January breakout above 3-year resistance at 2596 validating small-cap rotation narrative with January 22 all-time high at 2735
February seasonal consolidation after 8.2% January surge creating healthy digestion at elevated levels 3.9% below ATH
Small-cap earnings inflection with 17-22% growth projected for 2026 significantly outpacing S&P 500 14-15% forecast providing fundamental support
| ▲ Resistance Zone 2 | 2720 – 2750 |
| ▲ Resistance Zone 1 | 2665 – 2695 |
| ─ Pivot Area | ~2628 |
| ▼ Support Zone 1 | 2565 – 2595 |
| ▼ Support Zone 2 | 2485 – 2515 |
Consolidating 3.9% below January 22 all-time high of 2735 after historic breakout above 3-year resistance, holding 2580-2680 range with bullish momentum intact
P/E 18.11 represents attractive 18% discount to S&P 500 22x with superior 2026 earnings growth of 17-22% projected versus large-cap 14-15%
Net long with elevated positioning after 18.4% year-over-year rally, rotation from mega-cap tech accelerating into small-caps on rate sensitivity
RVX at 20.06 as of January 7 reflects relatively low volatility after breaking from extended 60+ day compression, suggesting market confidence in breakout sustainability
Fed funds at 4.25-4.50% after three consecutive cuts but January 29 FOMC paused easing, creating policy uncertainty offset by strong economic growth outlook
Normal - short-term vol 20.5 below long-term 24.5 reflecting confidence in breakout with measured expansion from prior extreme 60+ day compression
When RTY breaks multi-year resistance after extended volatility compression, historical precedent shows 15-25% continuation moves within 3-6 months in 65% of cases with direction confirmed by follow-through above breakout level
Volatility stabilizing after breaking from record 60-day compression in December, current normal regime suggests sustainable breakout conditions rather than climactic spike
Normal volatility regime supports standard risk management with 2-3% stops below 2580 support, expect 40-60 point daily ranges versus 25-35 during compression with breakout follow-through potentially triggering 80-100 point moves
Current volatility setup at 38th percentile after breaking from 28th percentile extreme compression offers asymmetric opportunity for 12-18% extension moves toward 2900-3000 measured targets from multi-year consolidation versus 5-7% typical consolidation risk toward 2500-2580 support if February seasonal weakness intensifies
|
⚠️ Primary Risk
Fed maintaining extended pause through Q1 2026 combining with February seasonal weakness triggering 5-8% correction toward 2500 major support Probability: MEDIUM
|
✦ Primary Opportunity
Extension of January Effect momentum driving breakout toward 2750-2800 measured targets as small-cap earnings inflection materializes with 17-22% growth through Q1-Q2 2026 Timeframe: 4-12 weeks through Q1 earnings season and March FOMC providing next directional catalyst
|
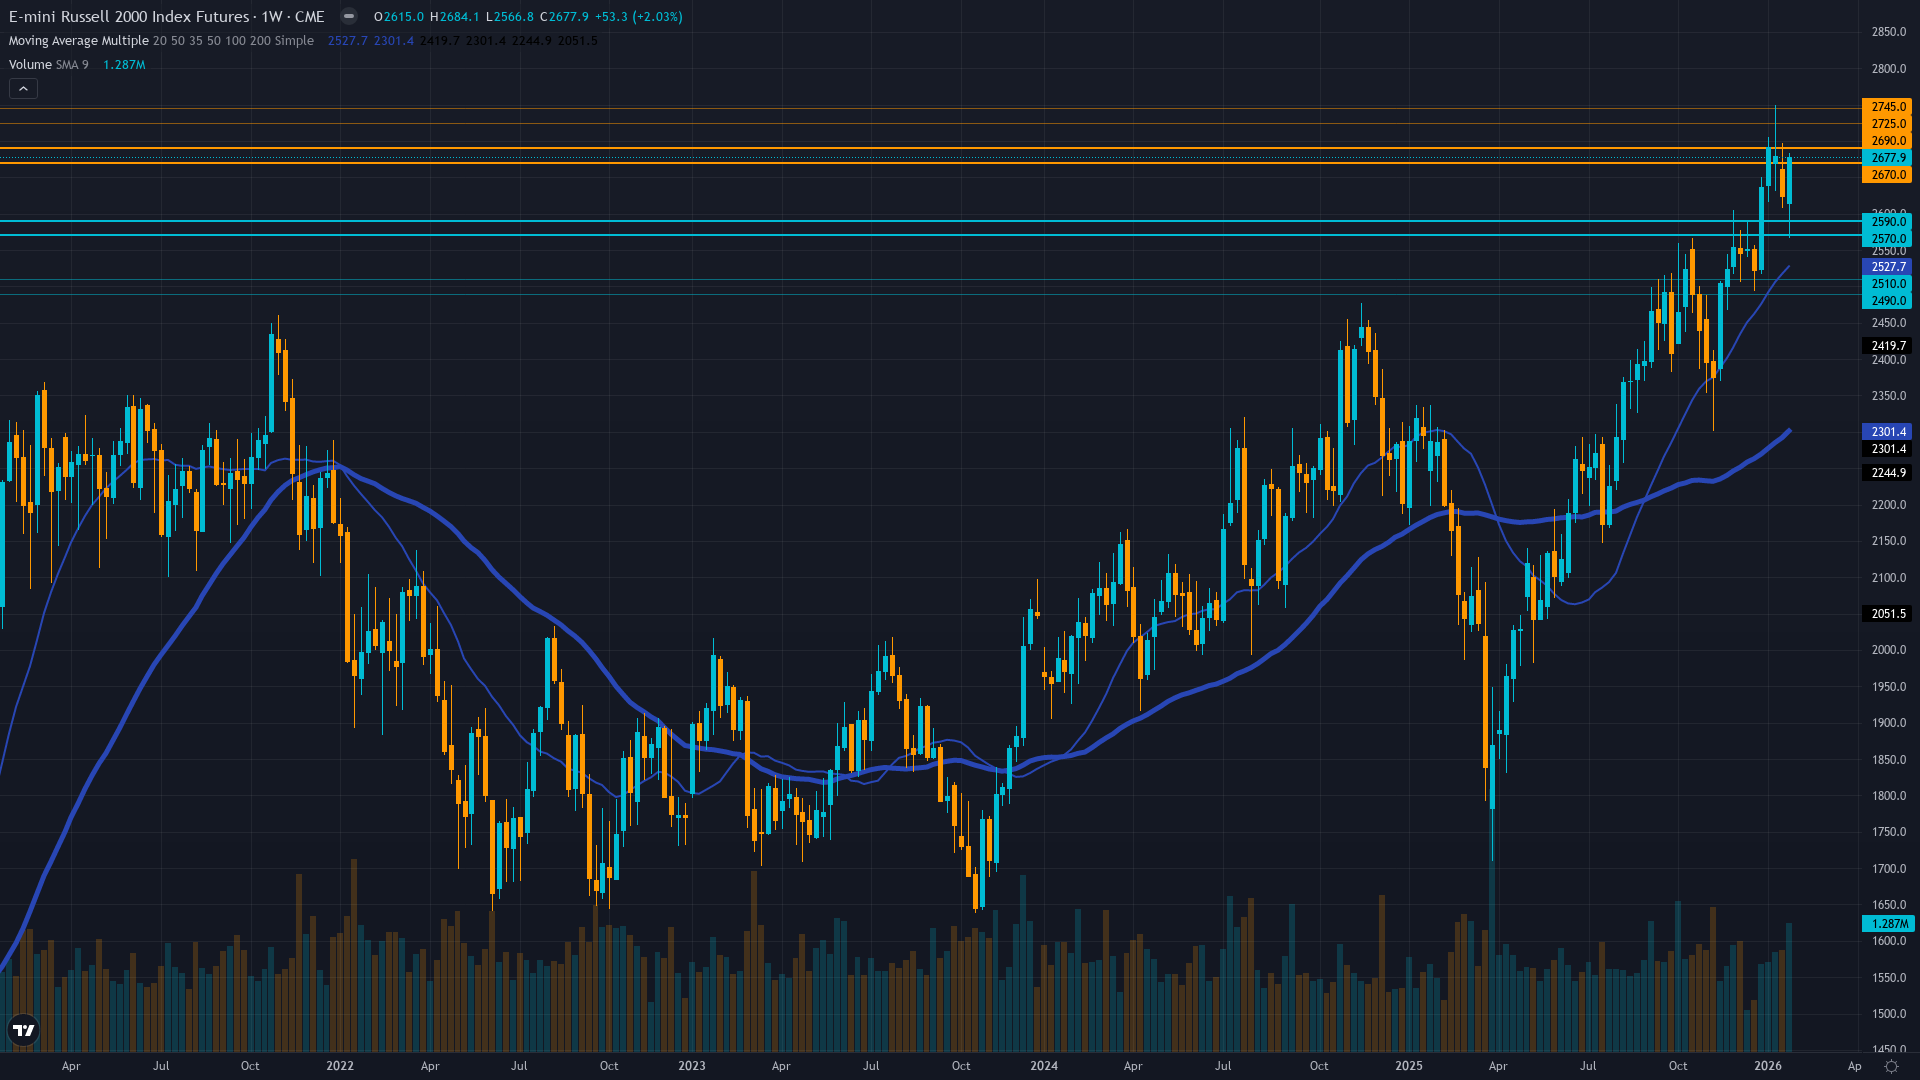
Russell 2000 stands at a watershed moment on February 8, 2026, trading at 2628 following a historic January that saw the small-cap benchmark shatter three years of consolidation by surging to an all-time high of 2735 on January 22—decisively breaking the November 2021 record of 2596 and validating the powerful small-cap rotation narrative. This breakout represents the culmination of an extraordinary rally from 2238 in late September 2025 to the January peak, marking an 18.4% year-over-year advance driven by the Fed's 100bp easing cycle.
The index currently consolidates just 3.9% below record highs, exhibiting healthy digestion after the explosive 8.2% January surge. The fundamental case remains structurally compelling: Russell 2000 constituents trade at a P/E of 18.11—an attractive 18% discount to S&P 500's 22x valuation—while offering superior earnings growth prospects of 17-22% projected for 2026 versus large-cap 14-15%. Small-caps' higher debt loads position them as disproportionate beneficiaries of the Fed's easing already delivered.
However, the January 29 FOMC pause creates near-term uncertainty, removing immediate catalyst potency despite structural tailwinds remaining intact. February seasonality presents neutral-to-weak headwinds historically, creating natural consolidation pressure after January's strength. The 52-week range of 1733-2735 illustrates the extraordinary journey, with current positioning at 96% of the range representing either the beginning of a secular advance or requiring deeper digestion. Technical structure shows decisive breakout confirmation with the January 22 record validating the multi-year cup-and-handle pattern, though immediate resistance at 2680-2700 must be cleared to extend toward 2750-2800 measured targets.
Institutional positioning has increased materially with rotation from mega-cap technology accelerating as investors seek exposure to rate-sensitive small-caps and superior earnings growth, though flows are approaching elevated levels requiring monitoring. Volatility dynamics show RVX at 20.06 stabilizing after breaking from extended 60+ day compression, suggesting sustainable conditions rather than climactic exhaustion. The convergence of historic breakout confirmation after three-year consolidation, Fed policy pause at January 29 creating near-term uncertainty, February seasonal headwinds entering historically weaker period, attractive relative valuation at 18% discount with superior 17-22% earnings growth, and normal volatility regime supporting sustainable advance creates an environment where near-term consolidation appears likely before the next leg higher materializes through Q1 earnings season.
The setup favors patient accumulation on pullbacks toward 2580 support with extension targets toward 2750-2800 as earnings inflection validates the breakout through Q1-Q2 2026.
| Week | Bias | Confidence |
|---|---|---|
| February 8, 2026 | BULLISH | 7/10 |
| February 1, 2026 | BULLISH | 7/10 |
| January 25, 2026 | BULLISH | 7/10 |
| January 18, 2026 | BULLISH | 8/10 |
| January 11, 2026 | BULLISH | 8/10 |
| January 4, 2026 | NEUTRAL | 6/10 |
| December 28, 2025 | NEUTRAL | 6/10 |
| December 21, 2025 | NEUTRAL | 6/10 |
| December 14, 2025 | NEUTRAL | 7/10 |
| December 7, 2025 | NEUTRAL | 7/10 |
| November 30, 2025 | NEUTRAL | 6/10 |
| November 23, 2025 | NEUTRAL | 6/10 |


