Russell 2000 (RTY) — Historic January 8-25 breakout above 3-year resistance at 2596 validating…
Small-caps positioned to extend outperformance following historic breakout with superior earnings growth and Fed easing supporting continued rotation despite January 28 pause

Small-caps positioned to extend outperformance following historic breakout with superior earnings growth and Fed easing supporting continued rotation despite January 28 pause
Historic January 8-25 breakout above 3-year resistance at 2596 validating multi-year small-cap rotation with January 28 FOMC pause confirmed
February seasonality historically neutral-to-weak for small-caps creating near-term headwind after 8.2% January surge through first three weeks
Earnings growth outlook of 17-22% for 2026 providing fundamental support despite Fed signaling extended pause at January 28 FOMC meeting
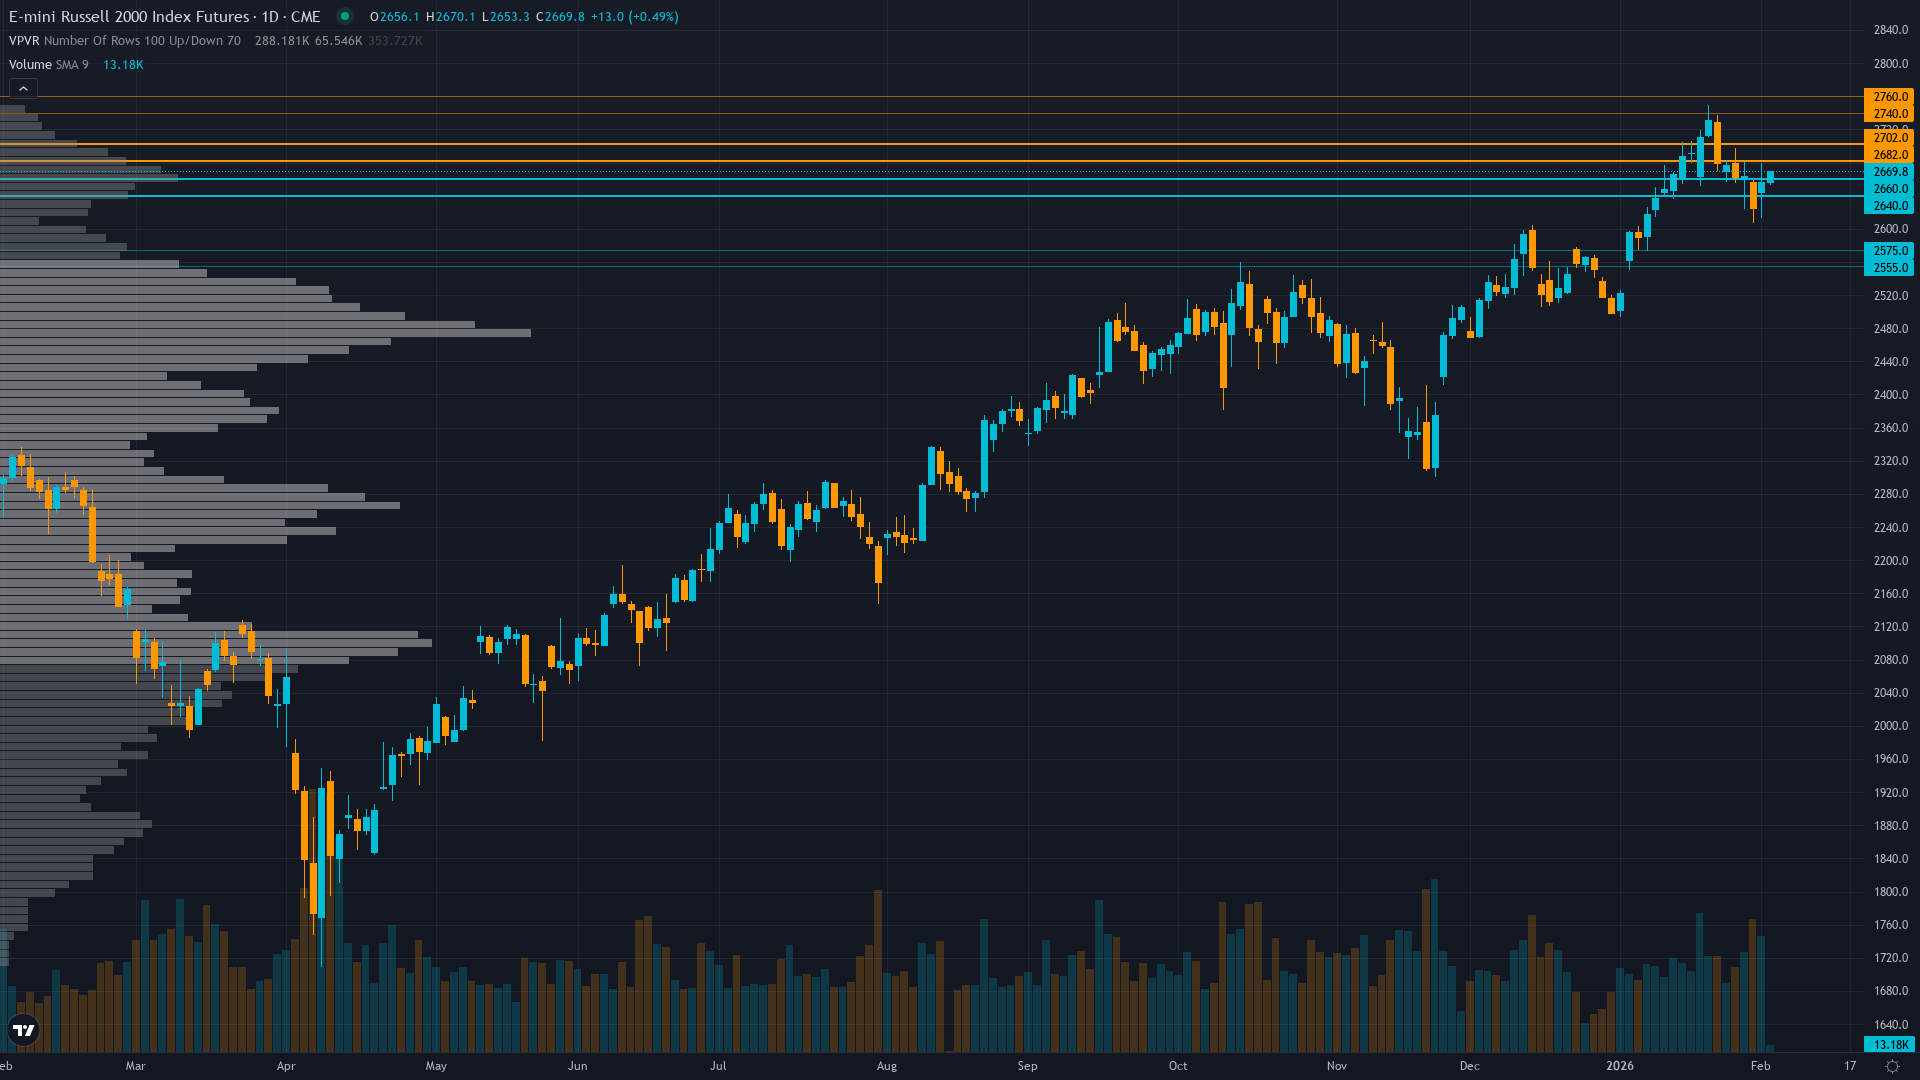
| ▲ Resistance Zone 2 | 2735 – 2765 |
| ▲ Resistance Zone 1 | 2677 – 2707 |
| ─ Pivot Area | ~2670 |
| ▼ Support Zone 1 | 2635 – 2665 |
| ▼ Support Zone 2 | 2550 – 2580 |
Historic breakout confirmed January 8 above 2596 prior ATH extending to 2692 January 16 record, consolidating 0.9% below peak with support holding 2650-2670
P/E 18.11 represents attractive 18% discount to S&P 500 with superior 2026 earnings growth of 17-22% projected versus large-cap 14-15% offsetting Fed pause concerns
Net long with elevated positioning after 18.4% year-over-year rally from January 2025 lows, rotation from mega-cap tech continuing but stretched
RVX at 20.06 as of January 7 reflecting relatively low volatility after breaking from extended 60+ day compression, suggesting market confidence in breakout sustainability
Fed funds at 4.25-4.50% after three consecutive cuts but January 28 FOMC confirmed pause with no cut delivered despite earlier expectations, creating policy uncertainty into March meeting
Normal - short-term vol 20.5 below long-term 24.5 reflecting confidence in breakout with measured expansion from prior extreme 60+ day compression
When RTY breaks multi-year resistance after extended volatility compression, historical precedent shows 15-25% continuation moves within 3-6 months in 65% of cases with direction confirmed by follow-through above breakout level
Volatility stabilizing after breaking from record 60-day compression in December, current normal regime at 38th percentile suggests sustainable breakout conditions rather than climactic spike
Normal volatility regime supports standard risk management with 2-3% stops below 2650 support, expect 40-60 point daily ranges versus 25-35 during compression with breakout follow-through potentially triggering 80-100 point moves on extension above 2700
Current volatility setup at 38th percentile after breaking from 28th percentile extreme compression offers asymmetric opportunity for 12-18% extension moves toward 2900-3000 measured targets from multi-year consolidation versus 5-7% typical consolidation risk toward 2565-2600 support if February seasonal weakness intensifies
|
⚠️ Primary Risk
February seasonal weakness combining with Fed extended pause confirmed January 28 triggering profit-taking from record highs toward 2565 support representing 4-5% correction Probability: MEDIUM
|
✦ Primary Opportunity
Extension of January Effect momentum driving breakout toward 2750-2800 measured targets as small-cap earnings inflection materializes with 17-22% growth through Q1-Q2 2026 Timeframe: 4-12 weeks through Q1 earnings season and March FOMC providing next directional catalyst
|
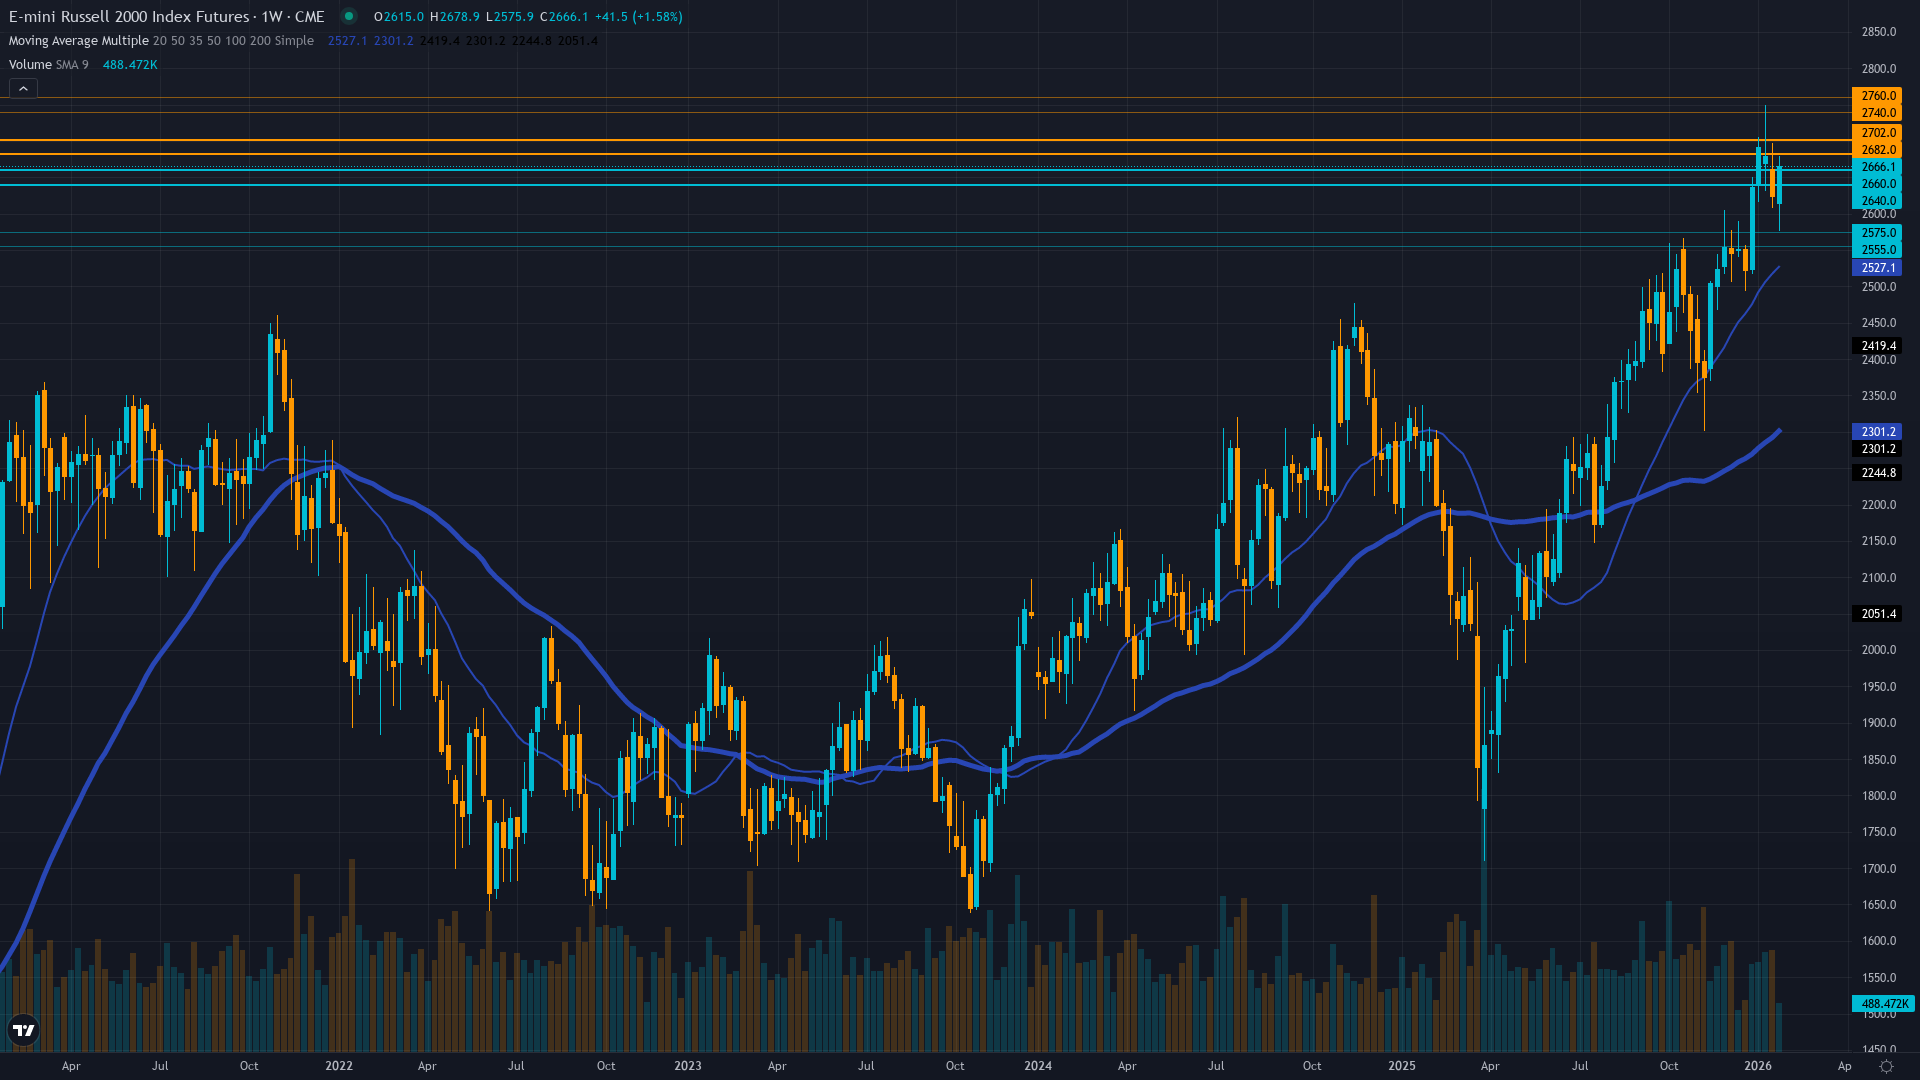
Russell 2000 stands at a historic inflection point on February 1, 2026, trading at 2669 just 23 points (0.9%) below its January 16 all-time high of 2692—the culmination of an extraordinary breakout that shattered three years of consolidation below the November 2021 peak of 2596. The January 8 breakout above this resistance level validated the powerful small-cap rotation narrative that began with the Fed's September 2025 rate cut initiating a 100bp easing cycle. RTY has rallied 18.4% over the past 52 weeks from January 2025 lows near 1733, with an explosive 8.2% surge in the first three weeks of January 2026 significantly outpacing large-cap indices.
However, the market now confronts a critical crossroads as multiple powerful forces converge. The January 28 FOMC meeting confirmed a pause with no rate cut delivered, marking a shift from the December meeting that delivered the third consecutive cut to 4.25-4.50%. This removes near-term catalyst potency despite the fundamental case remaining structurally compelling: small-caps trade at a P/E of 18.11—an attractive 18% discount to the S&P 500's 22x valuation—while offering superior earnings growth prospects of 17-22% projected for 2026 versus large-cap 14-15%.
Small-caps' higher debt loads (1.5x debt-to-equity versus 0.8x for S&P 500) position them as disproportionate beneficiaries of the 100bp Fed easing already delivered. February seasonality presents near-term headwinds as historically the month ranks as neutral-to-weak for small-cap performance, particularly following strong January gains. This seasonal pattern creates natural consolidation pressure after the January surge. Volatility dynamics show RVX at 20.06 as of January 7, breaking from the extended 60+ day compression that characterized October-December 2025, with the relatively low reading suggesting market confidence in the breakout's sustainability rather than extreme positioning vulnerability.
Technical structure shows decisive breakout confirmation following three-year consolidation with the January 16 record at 2692 representing immediate resistance, while support at 2650-2670 must hold to maintain bullish momentum. Institutional positioning has increased materially with rotation from mega-cap technology stocks accelerating as investors seek exposure to the rate-sensitive small-cap story and superior earnings growth, though positioning is approaching elevated levels after the sustained rally requiring monitoring.
The convergence of historic breakout confirmation following three-year consolidation below 2596, Fed policy pause at January 28 FOMC removing near-term catalyst, February seasonal headwinds entering historically weaker period, attractive relative valuation at 18% discount with superior 17-22% earnings growth, and normal volatility regime supporting sustainable advance creates an environment where near-term consolidation appears likely before the next leg higher materializes through Q1 earnings season. The setup favors patient accumulation on pullbacks toward 2650 support with extension targets toward 2750-2800 as earnings inflection validates the breakout through Q1-Q2 2026, though risk management remains paramount given proximity to record highs and Fed pause creating near-term uncertainty.
| Week | Bias | Confidence |
|---|---|---|
| February 1, 2026 | BULLISH | 7/10 |
| January 25, 2026 | BULLISH | 7/10 |
| January 18, 2026 | BULLISH | 8/10 |
| January 11, 2026 | BULLISH | 8/10 |
| January 4, 2026 | NEUTRAL | 6/10 |
| December 28, 2025 | NEUTRAL | 6/10 |
| December 21, 2025 | NEUTRAL | 6/10 |
| December 14, 2025 | NEUTRAL | 7/10 |
| December 7, 2025 | NEUTRAL | 7/10 |
| November 30, 2025 | NEUTRAL | 6/10 |
| November 23, 2025 | NEUTRAL | 6/10 |
| November 16, 2025 | NEUTRAL | 6/10 |


