Platinum (PL) — WPIC Platinum Quarterly Q1 2026 report expected to provide updated…
Market digesting WPIC March 4 deficit revision with skepticism as price action prioritizes technical breakdown and profit-taking over structural scarcity narrative

Market digesting WPIC March 4 deficit revision with skepticism as price action prioritizes technical breakdown and profit-taking over structural scarcity narrative
Technical breakdown overwhelming WPIC March 4 fundamental catalyst as price tests critical $2,000-2,011 support zone following 30% decline from January peak despite revised 240 koz deficit forecast for fourth consecutive year
Macro headwinds from USD strength (DXY 100.36) and elevated VIX (27.19) creating risk-off pressure despite structural supply scarcity with above-ground stocks at critically low 2.613M oz (4 months demand)
Sentiment extreme with retail 79.6% long creating contrarian bearish setup while managed money positioning at 13,800 contracts (5-week high) suggests vulnerability to further liquidation if $2,000 support fails
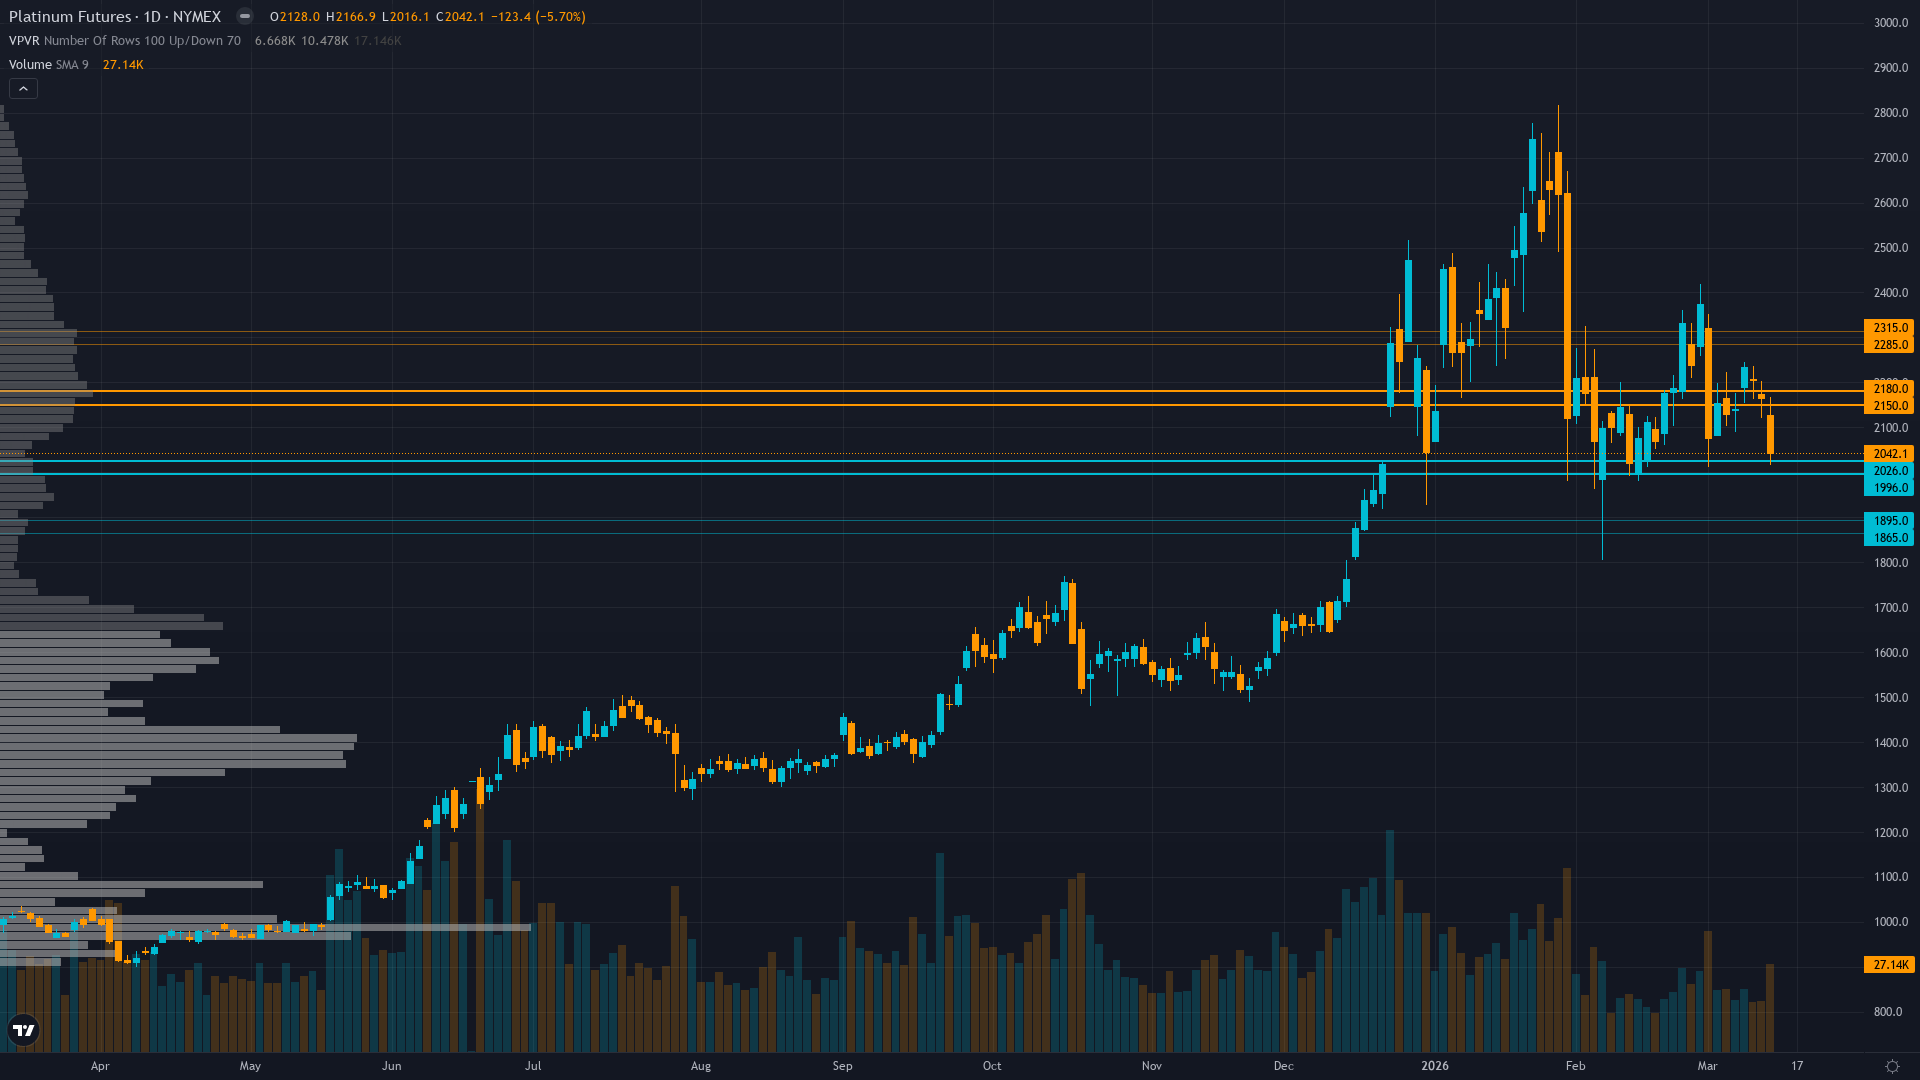
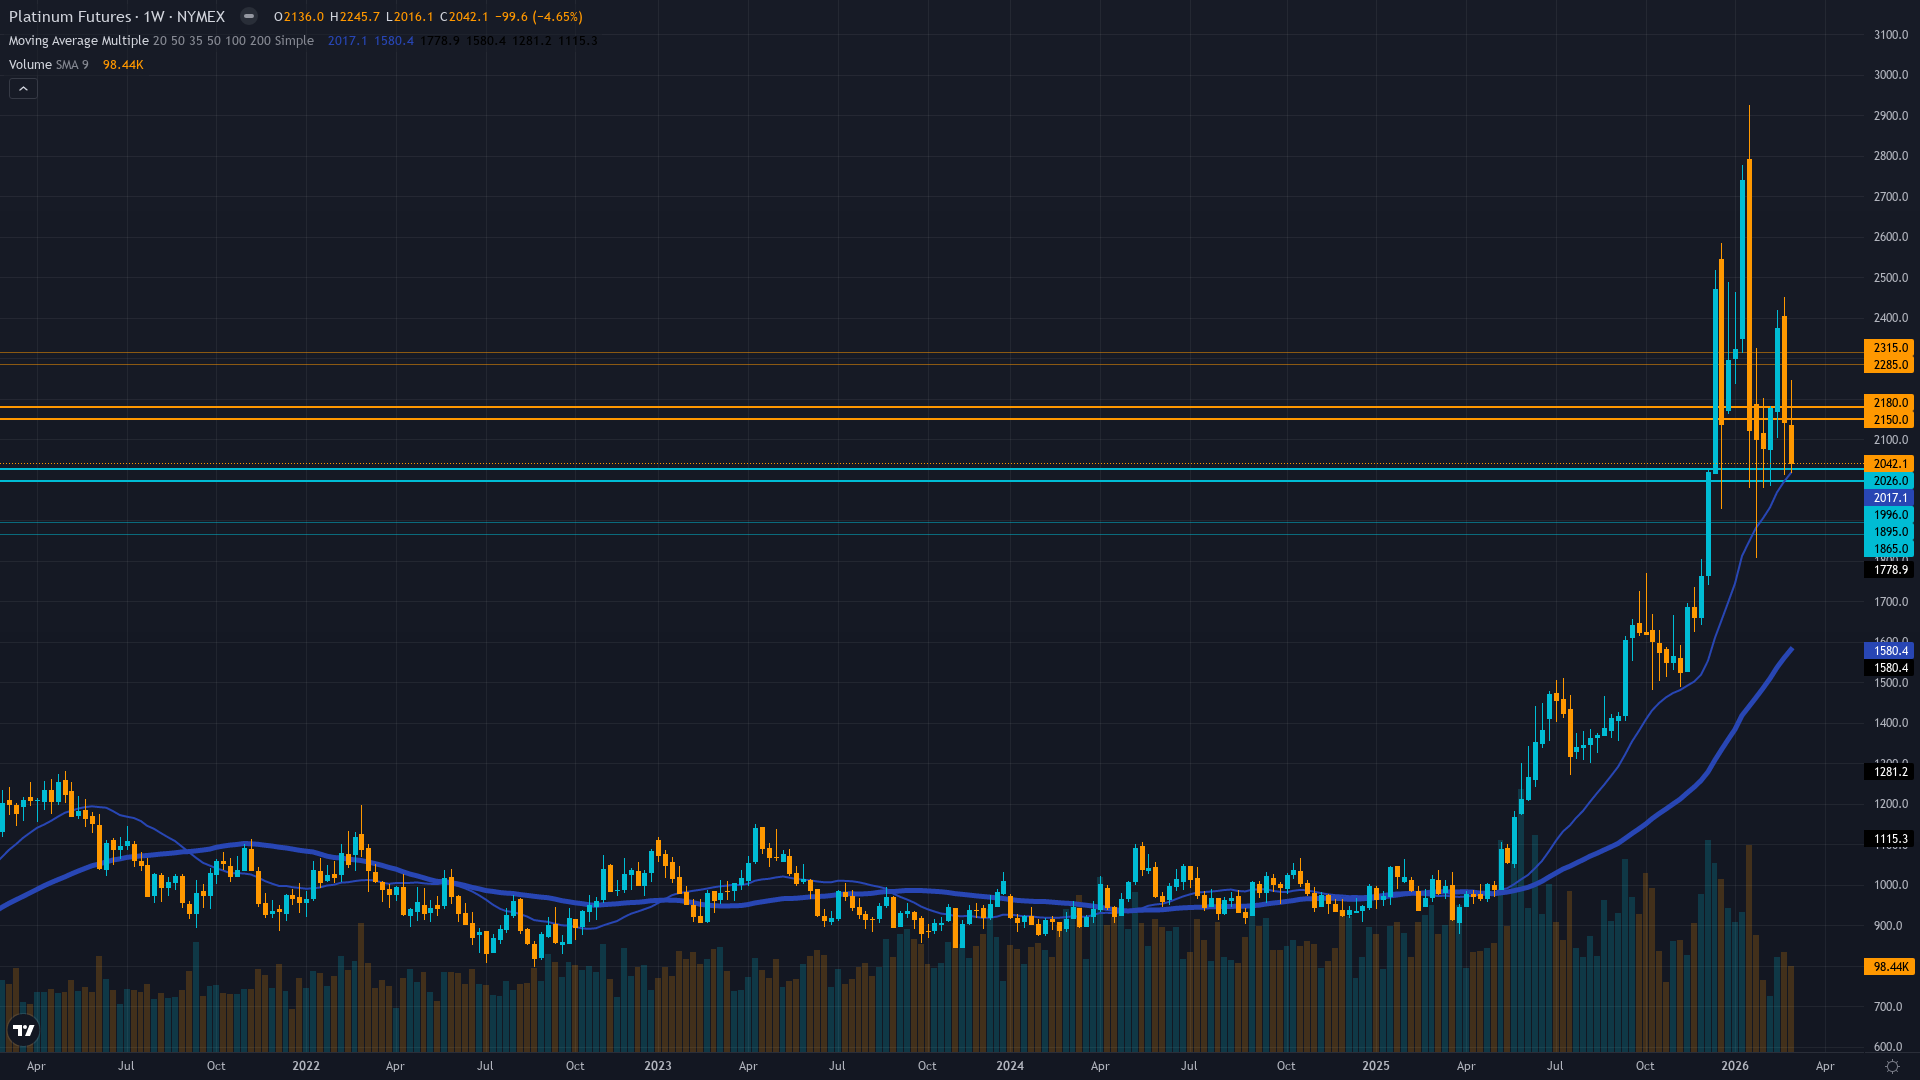
| ▼ Resistance Zone 2 | 2285 – 2315 |
| ▼ Resistance Zone 1 | 2150 – 2180 |
| ─ Pivot Area | ~2042 |
| ▲ Support Zone 1 | 1996 – 2026 |
| ▲ Support Zone 2 | 1865 – 1895 |
Breakdown accelerating with price declining from $2,169 to $2,042 (-5.88% this week) testing critical $2,011 support identified March 3; failure opens path to $1,880 February low
WPIC March 4 revision to 240 koz deficit (fourth consecutive year) fundamentally bullish but market rejecting catalyst as price falls -6.2% post-announcement suggesting profit-taking overwhelming scarcity thesis
Managed money net long 13,800 contracts at 5-week high but vulnerable to liquidation cascade if technical support fails at critical $2,000-2,011 zone
IV elevated at 63.36% reflecting ongoing uncertainty but thin liquidity limits directional signals; elevated volatility consistent with breakdown phase rather than reversal setup
USD strength at 100.36 (+3.22% monthly) and elevated real yields creating persistent headwinds for non-yielding assets despite Fed on hold; China PMI contraction at 49.30 pressures industrial demand narrative
Normalizing from January-February parabolic extremes above 95th percentile to current 85th percentile but remaining elevated; short-term volatility stable around 68-72% annualized suggesting breakdown phase consolidating
Similar post-parabolic breakdowns in precious metals historically show 65% probability of continuation to next major support versus 35% probability of reversal within 30 days when testing critical levels
Elevated volatility likely persists 2-3 weeks through support test at $2,000-2,011; mean reversion toward 50-55% annualized expected only after directional resolution establishes next regime
High but stable volatility suggests daily ranges of $60-100 expected; breakdown below $2,000 would likely expand ranges to $80-120 as stops trigger; reversal requires sustained reclaim of $2,100 with declining volatility
Elevated 85th percentile volatility suggests 12-18% move potential over next 4 weeks versus normal 7.24% average; $2,000 support test serves as binary directional trigger with failure targeting $1,880 (-8%) or hold enabling recovery toward $2,200 (+8%)
|
⚠️ Primary Risk
Breakdown below $2,000 psychological support triggers technical selling cascade toward $1,880 February low despite bullish fundamental revision as market prioritizes momentum over scarcity thesis Probability: HIGH
|
✦ Primary Opportunity
Reversal from $2,000-2,011 support zone if WPIC deficit revision gains traction and institutional accumulation resumes; successful hold could establish base for recovery toward $2,300 resistance Timeframe: 2-4 weeks if support holds and volatility normalizes allowing fundamental narrative to reassert
|
Platinum stands at a critical crossroads on March 15, 2026, trading at $2,042 and testing the make-or-break $2,000-2,011 support zone as technical momentum overwhelms what should be a transformational fundamental catalyst. The WPIC's March 4, 2026 revision—shifting the 2026 forecast from a 20 koz surplus to a 240 koz DEFICIT representing the fourth consecutive year of shortage—constitutes one of the most bullish fundamental reassessments in platinum's modern history. Above-ground stocks are projected at just 2.613 million ounces, equivalent to only four months of global demand, the lowest inventory-to-consumption ratio since 2020.
This structural scarcity should be price-supportive. Yet the market has rejected this catalyst violently: platinum has fallen 6.2% since the March 4 announcement, declining from $2,173 to current $2,042, and is down 30% from the January 26 parabolic peak of $2,925. This divergence between fundamental bullishness and price action bearishness defines the current regime. I classify the macro regime as RISK-OFF TRANSITIONAL: VIX elevated at 27.19 (up 52% month-over-month) signals broad market fear, USD strengthening at 100.36 creates persistent headwinds for commodities, and China PMI contraction at 49.30 undermines the industrial demand narrative that underpins platinum's dual precious/industrial identity.
Equities are range-bound with rising volatility, credit conditions show no clear stress, but the convergence of dollar strength and emerging market growth concerns creates a challenging backdrop for non-yielding assets. My two-miss streak (last week's NO CALL missed as price fell -5.88%, preceded by March 6 BULLISH miss at -7.44%) places me in a precarious position under the Bias Integrity System. While not at the four-miss mandatory reset threshold, I am operationally constrained and must approach this week with extreme discipline.
The fundamental case remains compelling: WPIC's revised 240 koz deficit validates the structural bull thesis I have maintained. However, my execution timing has been catastrophically poor during the January-March volatility regime, and Rule 4 Thesis Health Score analysis reveals deterioration: of the last four graded weeks, two moved contrary to any bullish bias (March 6 -7.44%, March 14 -5.88%), and the net four-week cumulative move is approximately -11% against a bullish thesis—exceeding 1.5x platinum's 7.24% average weekly move, triggering an additional -1 conviction penalty.
Technical structure shows unambiguous breakdown: price violated $2,165 resistance-turned-support, broke through $2,100, and now tests the March 3-identified critical $2,011 level with declining open interest (44.63K down from recent highs) suggesting position liquidation rather than consolidation. RSI readings show momentum deterioration, daily ranges remain elevated at $60-100 reflecting ongoing volatility normalization from January extremes, and the 52-week range of $885-$2,915 places current price at just 57th percentile—no longer at extremes but trending toward the lower half of the range.
Sentiment presents a classic contrarian warning: Capital.com data shows retail positioning at 79.6% long versus 20.4% short, a dangerous one-sided tilt that historically precedes reversals. When retail crowds one direction this aggressively, they are typically wrong at inflection points. Yet institutional positioning shows managed money at 13,800 contracts net long (five-week high), suggesting smart money accumulation continues—but this creates vulnerability if the crowd liquidates and forces institutional stops.
The convergence of crowded retail longs, elevated VIX, and technical breakdown creates a bearish setup despite bullish fundamentals. Devil's advocate perspective: Could the market be right to ignore the WPIC deficit revision? The organization forecast a 20 koz surplus in November 2025 based on assumptions of easing trade tensions and normalizing CME warehouse inventory. The March revision to 240 koz deficit suggests those assumptions failed. But what if 2026 conditions improve more than WPIC now expects?
What if automotive demand weakens faster than projected (forecast shows 3% decline), or if the hydrogen economy narrative (projected 875-900 koz demand by 2030) proves over-optimistic? The market's rejection of bullish news may reflect skepticism about WPIC forecasting accuracy after the November-to-March 260 koz swing, or it may simply be profit-taking after a 168% rally from early-2025 lows that prioritizes momentum over fundamentals. My signal is set to -1.5 BEARISH, reflecting tactical capitulation to technical reality while acknowledging the fundamental case prevents stronger conviction.
Conviction at 5 reflects multiple penalties: -1 for two-miss streak, -1 for Thesis Health Score degradation (contrary moves in 2 of last 4 weeks plus net move exceeding 1.5x average), -1 for three disciplines contradicting the bearish lean (Fundamental BULLISH at 3.5 signal, Institutional BULLISH at 2.0, Economic showing only -1.5 mild bearish), bringing initial 8 assessment down to 5 minimum threshold. The MAD Divergence Score will be low (estimated 25-30) because my bearish tactical lean aligns with current market momentum despite fundamental divergence—I am not expressing a contrarian view, I am acknowledging price reality.
This is a forced tactical retreat, not a conviction-based directional call. The critical test is $2,000-2,011: hold and platinum may base for fundamental reassertion; break and the technical cascade toward $1,880 (February 2 low) becomes the path of least resistance regardless of WPIC's structural scarcity thesis.
| Week | Bias | Confidence | Result |
|---|---|---|---|
| March 14, 2026 | NO CALL | 5/10 | ➖ |
| March 6, 2026 | BULLISH | 7/10 | ❌ |
| February 27, 2026 | BULLISH | 6/10 | ✅ |
| February 21, 2026 | BULLISH | 6/10 | ✅ |
| February 13, 2026 | BULLISH | 6/10 | ✅ |
| February 8, 2026 | BULLISH | 6/10 | ✅ |
| February 1, 2026 | BULLISH | 7/10 | ❌ |
| January 25, 2026 | BULLISH | 7/10 | ❌ |
| January 4, 2026 | BULLISH | 7/10 | ✅ |
| December 28, 2025 | BULLISH | 8/10 | ❌ |
| December 21, 2025 | BULLISH | 8/10 | ✅ |
📋 PROMPT-READY CONTEXT
Copy this entire block into any AI chat for follow-up analysis
▼ Expand
MACRO AGENT DESK — WEEKLY INTELLIGENCE BRIEFING
═════════════════════════════════════════════════
Asset: Platinum (PL)
Report Date: March 15, 2026

── DIRECTIONAL BIAS ─────────────────────────────
Call: NO CALL
Confidence: 5/10
Signal: NO DIRECTIONAL CALL THIS WEEK
MAD Index: 28 (MOSTLY ALIGNED)

── MARKET CONTEXT ───────────────────────────────
State: BREAKING DOWN
Regime: BREAKING DOWN
Sentiment: FEAR

── WHAT THE MARKET SEES ─────────────────────────
Market digesting WPIC March 4 deficit revision with skepticism as price action prioritizes technical breakdown and profit-taking over structural scarcity narrative

── WHAT THE MARKET IS MISSING ───────────────────
Tactical bearish lean acknowledges technical reality and sentiment extremes but conflicts with fundamental reassessment; market may be wrong to ignore WPIC deficit revision or correct to discount forecasting credibility after 260 koz November-March swing

── KEY DRIVERS ──────────────────────────────────
1. Technical breakdown overwhelming WPIC March 4 fundamental catalyst as price tests critical $2,000-2,011 support zone following 30% decline from January peak despite revised 240 koz deficit forecast for fourth consecutive year
2. Macro headwinds from USD strength (DXY 100.36) and elevated VIX (27.19) creating risk-off pressure despite structural supply scarcity with above-ground stocks at critically low 2.613M oz (4 months demand)
3. Sentiment extreme with retail 79.6% long creating contrarian bearish setup while managed money positioning at 13,800 contracts (5-week high) suggests vulnerability to further liquidation if $2,000 support fails

── KEY ZONES ────────────────────────────────────
Resistance 2: 2285 – 2315
Resistance 1: 2150 – 2180
Pivot: ~2042
Support 1: 1996 – 2026
Support 2: 1865 – 1895

── DISCIPLINE BIASES ────────────────────────────
Technical: BEARISH
Fundamental: BULLISH
Institutional: BULLISH
Options: NO CALL
Economic: BEARISH
Sentiment: BEARISH

── TECHNICAL STRUCTURE ──────────────────────────
Breakdown accelerating with price declining from $2,169 to $2,042 (-5.88% this week) testing critical $2,011 support identified March 3; failure opens path to $1,880 February low

── FUNDAMENTAL ASSESSMENT ───────────────────────
WPIC March 4 revision to 240 koz deficit (fourth consecutive year) fundamentally bullish but market rejecting catalyst as price falls -6.2% post-announcement suggesting profit-taking overwhelming scarcity thesis

── INSTITUTIONAL POSITIONING ────────────────────
Managed money net long 13,800 contracts at 5-week high but vulnerable to liquidation cascade if technical support fails at critical $2,000-2,011 zone

── OPTIONS FLOW ─────────────────────────────────
IV elevated at 63.36% reflecting ongoing uncertainty but thin liquidity limits directional signals; elevated volatility consistent with breakdown phase rather than reversal setup

── ECONOMIC BACKDROP ────────────────────────────
USD strength at 100.36 (+3.22% monthly) and elevated real yields creating persistent headwinds for non-yielding assets despite Fed on hold; China PMI contraction at 49.30 pressures industrial demand narrative

── VOLATILITY REGIME ────────────────────────────
Regime: HIGH
Percentile: 85th
Trend: Stable —
Days in Regime: 42
Term Structure: Normalizing from January-February parabolic extremes above 95th percentile to current 85th percentile but remaining elevated; short-term volatility stable around 68-72% annualized suggesting breakdown phase consolidating
Historical Pattern: Similar post-parabolic breakdowns in precious metals historically show 65% probability of continuation to next major support versus 35% probability of reversal within 30 days when testing critical levels
Outlook: Elevated volatility likely persists 2-3 weeks through support test at $2,000-2,011; mean reversion toward 50-55% annualized expected only after directional resolution establishes next regime
Trading Context: High but stable volatility suggests daily ranges of $60-100 expected; breakdown below $2,000 would likely expand ranges to $80-120 as stops trigger; reversal requires sustained reclaim of $2,100 with declining volatility
Vol Risk/Opportunity: Elevated 85th percentile volatility suggests 12-18% move potential over next 4 weeks versus normal 7.24% average; $2,000 support test serves as binary directional trigger with failure targeting $1,880 (-8%) or hold enabling recovery toward $2,200 (+8%)

── PRIMARY RISK ─────────────────────────────────
Breakdown below $2,000 psychological support triggers technical selling cascade toward $1,880 February low despite bullish fundamental revision as market prioritizes momentum over scarcity thesis
Probability: HIGH

── PRIMARY OPPORTUNITY ──────────────────────────
Reversal from $2,000-2,011 support zone if WPIC deficit revision gains traction and institutional accumulation resumes; successful hold could establish base for recovery toward $2,300 resistance
Timeframe: 2-4 weeks if support holds and volatility normalizes allowing fundamental narrative to reassert

── NEXT CATALYST ────────────────────────────────
Date: May 18, 2026
Event: WPIC Platinum Quarterly Q1 2026 report expected to provide updated supply-demand data validating or challenging March 4 deficit revision
Expected Impact: HIGH

═════════════════════════════════════════════════
Source: Macro Agent Desk (macroagentdesk.com)
═════════════════════════════════════════════════

── FULL ANALYSIS ────────────────────────────────
Platinum stands at a critical crossroads on March 15, 2026, trading at $2,042 and testing the make-or-break $2,000-2,011 support zone as technical momentum overwhelms what should be a transformational fundamental catalyst. The WPIC's March 4, 2026 revision—shifting the 2026 forecast from a 20 koz surplus to a 240 koz DEFICIT representing the fourth consecutive year of shortage—constitutes one of the most bullish fundamental reassessments in platinum's modern history. Above-ground stocks are projected at just 2.613 million ounces, equivalent to only four months of global demand, the lowest inventory-to-consumption ratio since 2020. This structural scarcity should be price-supportive. Yet the market has rejected this catalyst violently: platinum has fallen 6.2% since the March 4 announcement, declining from $2,173 to current $2,042, and is down 30% from the January 26 parabolic peak of $2,925. This divergence between fundamental bullishness and price action bearishness defines the current regime. I classify the macro regime as RISK-OFF TRANSITIONAL: VIX elevated at 27.19 (up 52% month-over-month) signals broad market fear, USD strengthening at 100.36 creates persistent headwinds for commodities, and China PMI contraction at 49.30 undermines the industrial demand narrative that underpins platinum's dual precious/industrial identity. Equities are range-bound with rising volatility, credit conditions show no clear stress, but the convergence of dollar strength and emerging market growth concerns creates a challenging backdrop for non-yielding assets. My two-miss streak (last week's NO CALL missed as price fell -5.88%, preceded by March 6 BULLISH miss at -7.44%) places me in a precarious position under the Bias Integrity System. While not at the four-miss mandatory reset threshold, I am operationally constrained and must approach this week with extreme discipline. The fundamental case remains compelling: WPIC's revised 240 koz deficit validates the structural bull thesis I have maintained. However, my execution timing has been catastrophically poor during the January-March volatility regime, and Rule 4 Thesis Health Score analysis reveals deterioration: of the last four graded weeks, two moved contrary to any bullish bias (March 6 -7.44%, March 14 -5.88%), and the net four-week cumulative move is approximately -11% against a bullish thesis—exceeding 1.5x platinum's 7.24% average weekly move, triggering an additional -1 conviction penalty. Technical structure shows unambiguous breakdown: price violated $2,165 resistance-turned-support, broke through $2,100, and now tests the March 3-identified critical $2,011 level with declining open interest (44.63K down from recent highs) suggesting position liquidation rather than consolidation. RSI readings show momentum deterioration, daily ranges remain elevated at $60-100 reflecting ongoing volatility normalization from January extremes, and the 52-week range of $885-$2,915 places current price at just 57th percentile—no longer at extremes but trending toward the lower half of the range. Sentiment presents a classic contrarian warning: Capital.com data shows retail positioning at 79.6% long versus 20.4% short, a dangerous one-sided tilt that historically precedes reversals. When retail crowds one direction this aggressively, they are typically wrong at inflection points. Yet institutional positioning shows managed money at 13,800 contracts net long (five-week high), suggesting smart money accumulation continues—but this creates vulnerability if the crowd liquidates and forces institutional stops. The convergence of crowded retail longs, elevated VIX, and technical breakdown creates a bearish setup despite bullish fundamentals. Devil's advocate perspective: Could the market be right to ignore the WPIC deficit revision? The organization forecast a 20 koz surplus in November 2025 based on assumptions of easing trade tensions and normalizing CME warehouse inventory. The March revision to 240 koz deficit suggests those assumptions failed. But what if 2026 conditions improve more than WPIC now expects? What if automotive demand weakens faster than projected (forecast shows 3% decline), or if the hydrogen economy narrative (projected 875-900 koz demand by 2030) proves over-optimistic? The market's rejection of bullish news may reflect skepticism about WPIC forecasting accuracy after the November-to-March 260 koz swing, or it may simply be profit-taking after a 168% rally from early-2025 lows that prioritizes momentum over fundamentals. My signal is set to -1.5 BEARISH, reflecting tactical capitulation to technical reality while acknowledging the fundamental case prevents stronger conviction. Conviction at 5 reflects multiple penalties: -1 for two-miss streak, -1 for Thesis Health Score degradation (contrary moves in 2 of last 4 weeks plus net move exceeding 1.5x average), -1 for three disciplines contradicting the bearish lean (Fundamental BULLISH at 3.5 signal, Institutional BULLISH at 2.0, Economic showing only -1.5 mild bearish), bringing initial 8 assessment down to 5 minimum threshold. The MAD Divergence Score will be low (estimated 25-30) because my bearish tactical lean aligns with current market momentum despite fundamental divergence—I am not expressing a contrarian view, I am acknowledging price reality. This is a forced tactical retreat, not a conviction-based directional call. The critical test is $2,000-2,011: hold and platinum may base for fundamental reassertion; break and the technical cascade toward $1,880 (February 2 low) becomes the path of least resistance regardless of WPIC's structural scarcity thesis.


