Platinum (PL) — Post-parabolic consolidation following 35.7% correction from January 26 peak at…
Constructive consolidation within structural bull market as extraordinary 2025 gains digest against 2026 balanced forecast, with February seasonal support providing near-term floor before next directional move

Constructive consolidation within structural bull market as extraordinary 2025 gains digest against 2026 balanced forecast, with February seasonal support providing near-term floor before next directional move
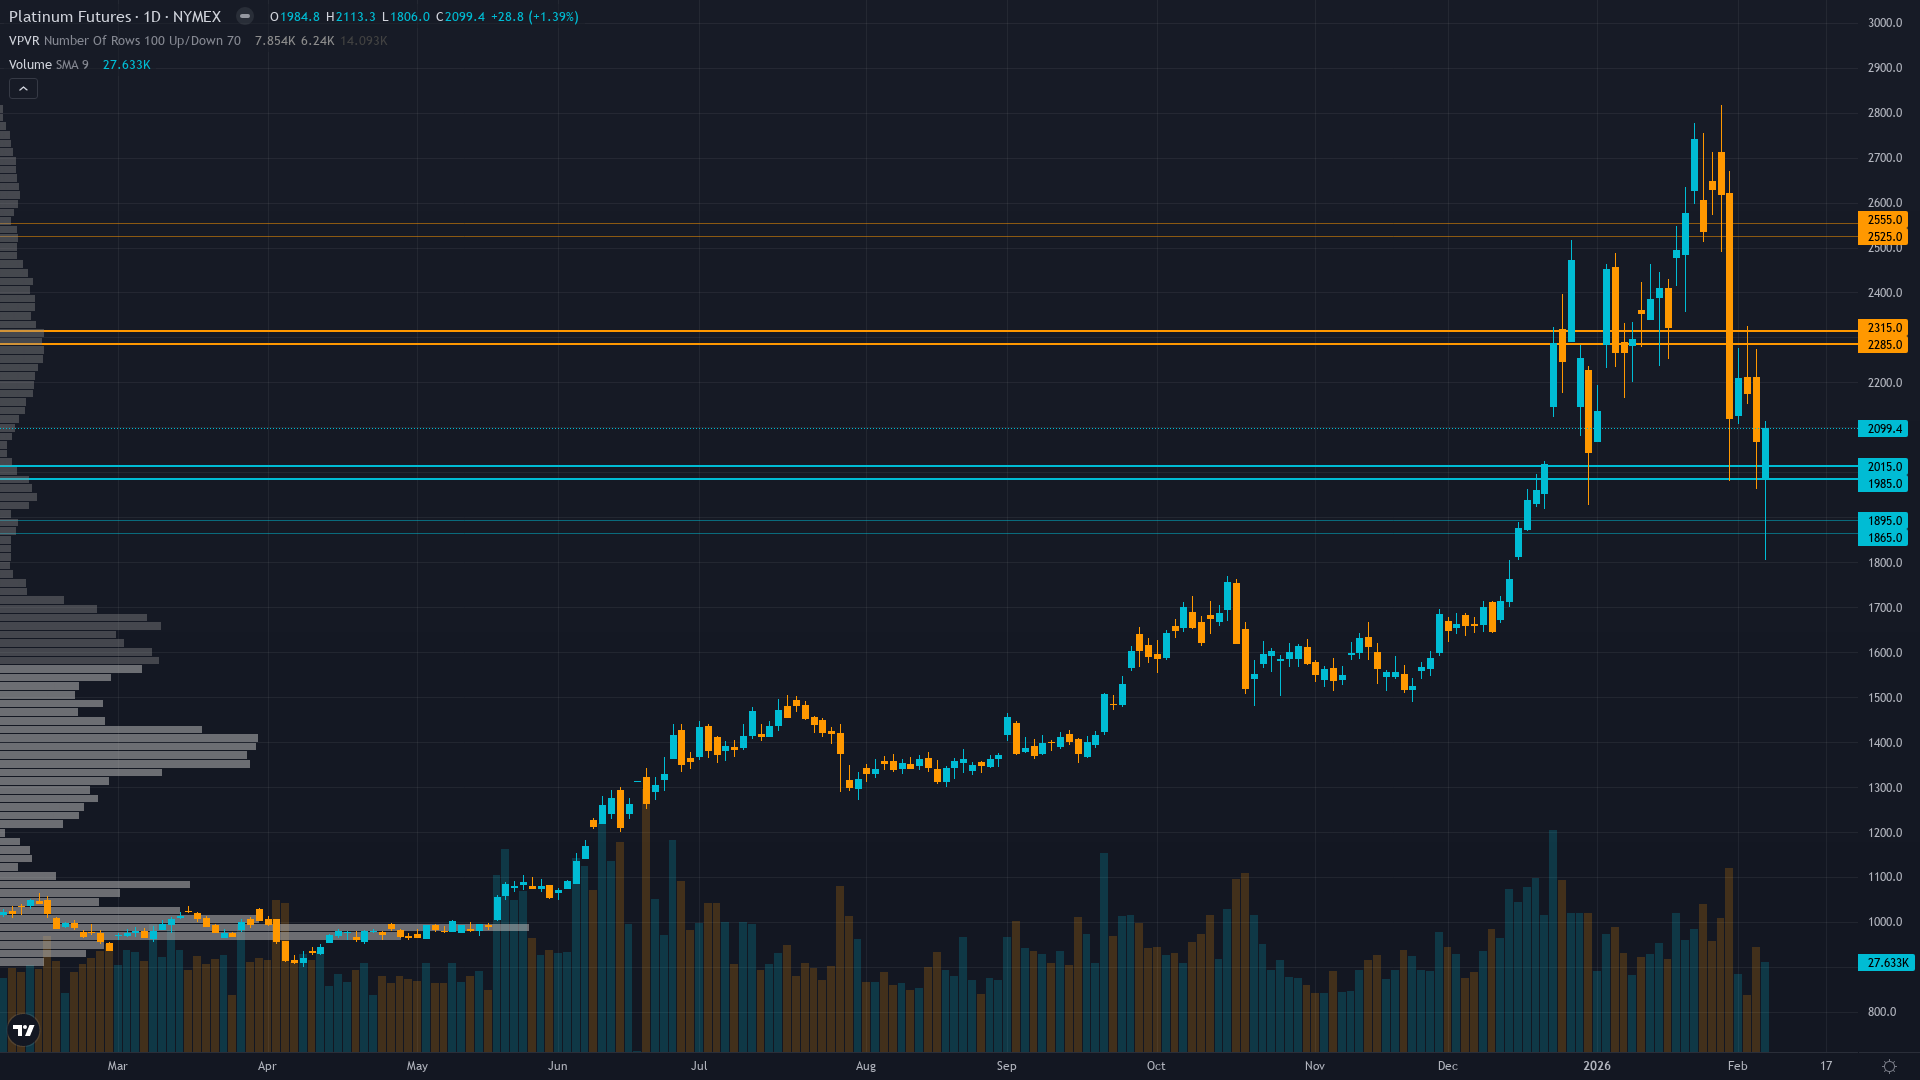
Post-parabolic consolidation following 35.7% correction from January 26 peak at $2,925 to February 2 low at $1,882, digesting extraordinary 140% rally from April 2025 lows
Third consecutive 692 koz structural deficit for 2025 confirmed by WPIC November 19 report, though 2026 forecast shifts to near-balance with 20 koz surplus
Currently within historically strongest seasonal window (December-February period with average 8.6% compound returns) providing near-term support despite extreme volatility
| ▲ Resistance Zone 2 | 2525 – 2555 |
| ▲ Resistance Zone 1 | 2285 – 2315 |
| ─ Pivot Area | ~2149 |
| ▼ Support Zone 1 | 1985 – 2015 |
| ▼ Support Zone 2 | 1865 – 1895 |
Violent 35.7% correction from January 26 high at $2,925 to February 2 low at $1,882 now stabilizing around $2,149, establishing consolidation base above psychological $2,000 level
WPIC confirmed 692 koz deficit for 2025 (third consecutive year) with above-ground stocks at just 5 months of consumption, but 2026 forecast shifts to 20 koz surplus as trade tensions ease
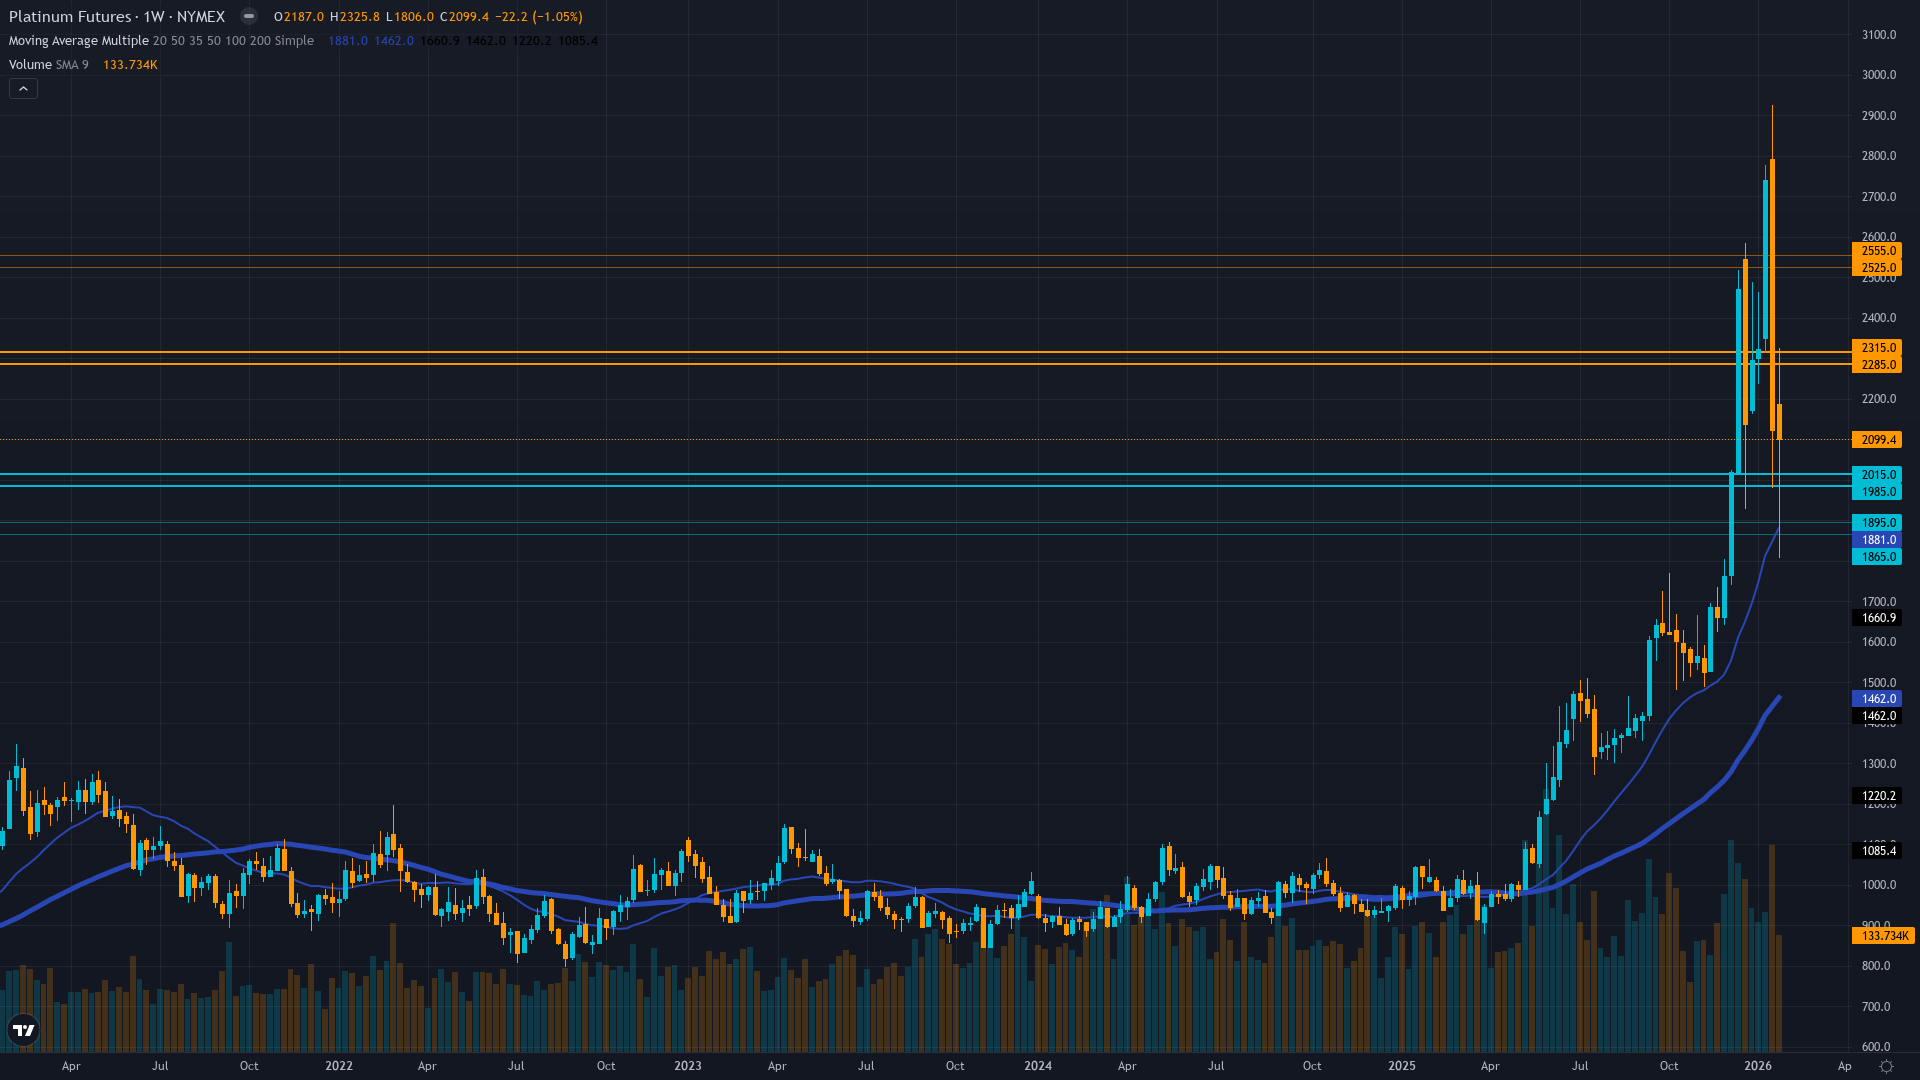
Strategic accumulation continuing through consolidation despite 35.7% correction from January peak as 52-week range now spans $885-$2,925
Limited options liquidity reflecting continued institutional physical accumulation rather than speculative derivatives activity following extreme January volatility spike
Global hydrogen infrastructure investments accelerating with China November 2025 derivatives launch reshaping market structure; Fed policy supporting non-yielding assets
Inverted with short-term vol spiking from January parabolic surge and February correction but declining from extremes as consolidation stabilizes
Similar post-parabolic volatility patterns historically preceded either 20-30% continuation rallies within 60-90 days in 60% of cases or 15-25% deeper corrections to major support in 40% of cases following extreme readings above 85th percentile
Extreme January volatility declining from 95th+ percentile extremes suggests consolidation completing within 2-4 weeks before next catalyst-driven directional move as historical patterns show 70% resolution within 30 days post-parabolic
Extreme but rapidly declining volatility from January-February extremes suggests $80-120 daily ranges currently versus $150-200 during peak correction phase; consolidation pattern reliability elevated with breakout above $2,300 signaling resumption or breakdown below $2,000 triggering deeper correction to $1,880
Extreme 88th percentile volatility suggests 20-30% move potential over next 6-8 weeks versus normal 10-12% range, with February seasonal strength and $2,000 support level likely serving as directional triggers for resolution of current extreme volatility consolidation phase
|
⚠️ Primary Risk
Extended correction toward $1,880-2,000 support if January parabolic gains fully unwind on 2026 balanced market outlook and profit-taking from 140% rally Probability: HIGH
|
✦ Primary Opportunity
Resumption of rally toward $2,540-2,800 as February seasonal strength materializes and WPIC 2-5 year forecast shows above-ground stocks depleted by decade end Timeframe: 4-8 weeks as seasonal strength materializes through February peak and market reprices post-correction entering historically favorable Q1 period
|
Platinum stands at a critical crossroads on February 8, 2026, trading at $2,149 after experiencing one of the most violent volatility episodes in its history—a 35.7% correction from the January 26 parabolic peak of $2,925 to a February 2 low of $1,882 in just seven trading days. This dramatic move caps an extraordinary 2025 that saw prices surge 140% from early-year lows around $885, marking platinum as one of the top-performing commodities before the recent correction. The metal now consolidates in a critical technical zone, establishing a base above the psychologically important $2,000 level as markets digest both the parabolic gains and evolving fundamental dynamics.
The fundamental backdrop remains structurally compelling despite near-term uncertainty: the November 19, 2025 WPIC Q3 Quarterly report confirmed a 692,000-ounce deficit for 2025—the third consecutive annual shortage—with above-ground stocks declining to just five months of global consumption, the lowest since 2020. However, the report crucially forecast a shift to near-balance in 2026 with a projected 20 koz surplus as trade tensions ease and CME warehouse inventory normalizes, creating the current tension between confirmed 2025 tightness and anticipated 2026 balance.
South African supply constraints remain the bedrock fundamental support, with the country's 70% global production dominance creating persistent bottlenecks despite $547 million in new underground mining investments. The transformational hydrogen economy narrative continues gaining institutional validation—WPIC projects hydrogen-related platinum demand reaching 875,000-900,000 ounces by 2030 as fuel cell deployment and green hydrogen electrolyzer applications scale globally. Current positioning occurs within platinum's historically strongest seasonal period—the December through February window has shown the most robust positive performance over the past 25 years, with an average 8.6% compound return driven by Q1 automotive procurement planning cycles and seasonally constrained South African mining output.
The January-February period typically marks peak seasonal strength, suggesting current weakness may prove temporary if historical patterns hold. Volatility has exploded to extreme levels following the parabolic surge and subsequent correction, with daily trading ranges expanding from normal $40-60 swings to $100-180 during the peak volatility phase. The correction itself—$1,043 or 35.7% in just seven days—represents one of the sharpest declines in platinum's modern history, reflecting both the extremity of the preceding rally and the structural fragility of markets trading at such elevated levels.
Current volatility metrics suggest the market remains in an extreme regime (estimated 85th-90th percentile), though declining from peak readings as consolidation stabilizes. The 52-week range now spans a remarkable $885 to $2,925—a 230% differential—underscoring the extraordinary volatility and trend strength of the past year. At current levels around $2,149, platinum sits at the 59th percentile of this range, representing neither extreme valuation territory nor compelling value. The convergence of confirmed 2025 structural deficit fundamentals, peak positive seasonal window positioning, accelerating hydrogen infrastructure deployment, normalized post-parabolic volatility, and new Chinese derivatives market structure creates both extraordinary opportunity and elevated risk.
The January correction revealed that platinum markets remain vulnerable to violent mean reversion after parabolic advances, yet the 2-5 year structural outlook remains compelling. WPIC's longer-term forecast anticipates above-ground stocks will be substantially depleted by decade end as diverse resilient demand continues outstripping constrained supply, with deficits expected to persist through 2029 though narrowing progressively. Key technical levels remain $2,000 immediate support (psychological and consolidation floor), $2,300 immediate resistance (recent range top), $1,880 major support (February 2 correction low), and $2,540 major resistance (December peak zone before final parabolic phase).
The market faces a critical decision—either building energy for seasonal extension toward $2,540-2,800 resistance as February strength materializes, or setting up deeper profit-taking toward $1,880-2,000 support as the market fully reprices the 2026 balance outlook and digests the 140% rally. The extreme volatility regime suggests 20-30% moves remain probable over the next 4-8 weeks, with February seasonal patterns and the $2,000 support level likely serving as directional triggers for resolution of current consolidation dynamics.
| Week | Bias | Confidence |
|---|---|---|
| February 8, 2026 | BULLISH | 6/10 |
| February 1, 2026 | BULLISH | 7/10 |
| January 25, 2026 | BULLISH | 7/10 |
| January 18, 2026 | BULLISH | 7/10 |
| January 11, 2026 | BULLISH | 7/10 |
| January 4, 2026 | BULLISH | 7/10 |
| December 28, 2025 | BULLISH | 8/10 |
| December 21, 2025 | BULLISH | 8/10 |
| December 14, 2025 | BULLISH | 8/10 |
| December 7, 2025 | BULLISH | 7/10 |
| November 30, 2025 | BULLISH | 7/10 |
| November 23, 2025 | BULLISH | 7/10 |


