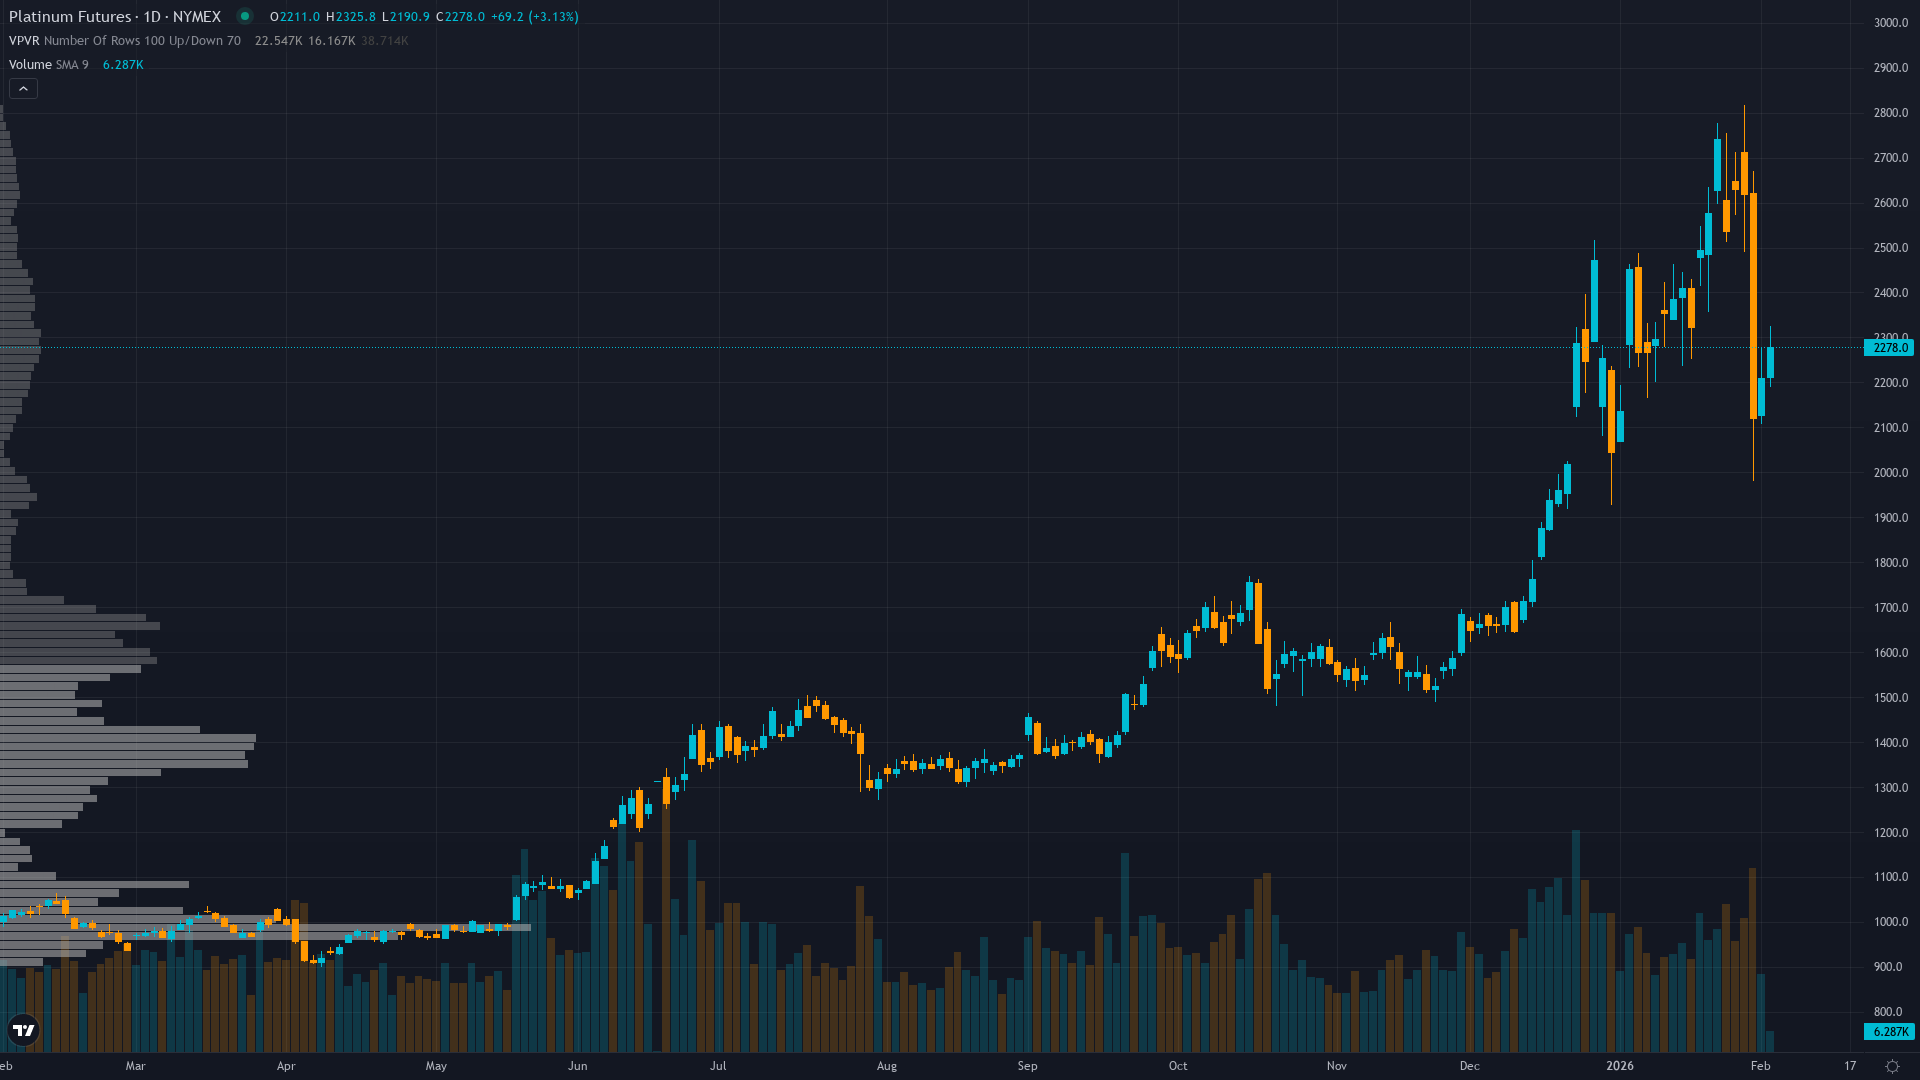
Platinum (PL) — Post-parabolic consolidation following 516% rally from April 2024 lows with…
Bullish on growth trajectory and backlog but cautious on valuation after 516% rally; analyst consensus $19.66 below current price suggests elevated risk-reward

Bullish on growth trajectory and backlog but cautious on valuation after 516% rally; analyst consensus $19.66 below current price suggests elevated risk-reward
Post-parabolic consolidation following 516% rally from April 2024 lows with $735M backlog (216% y/y) providing forward revenue visibility
December Q3 FY2026 earnings beat delivering $81.3M revenue (+32% y/y) with fiscal 2026 guidance raised to $260-280M range
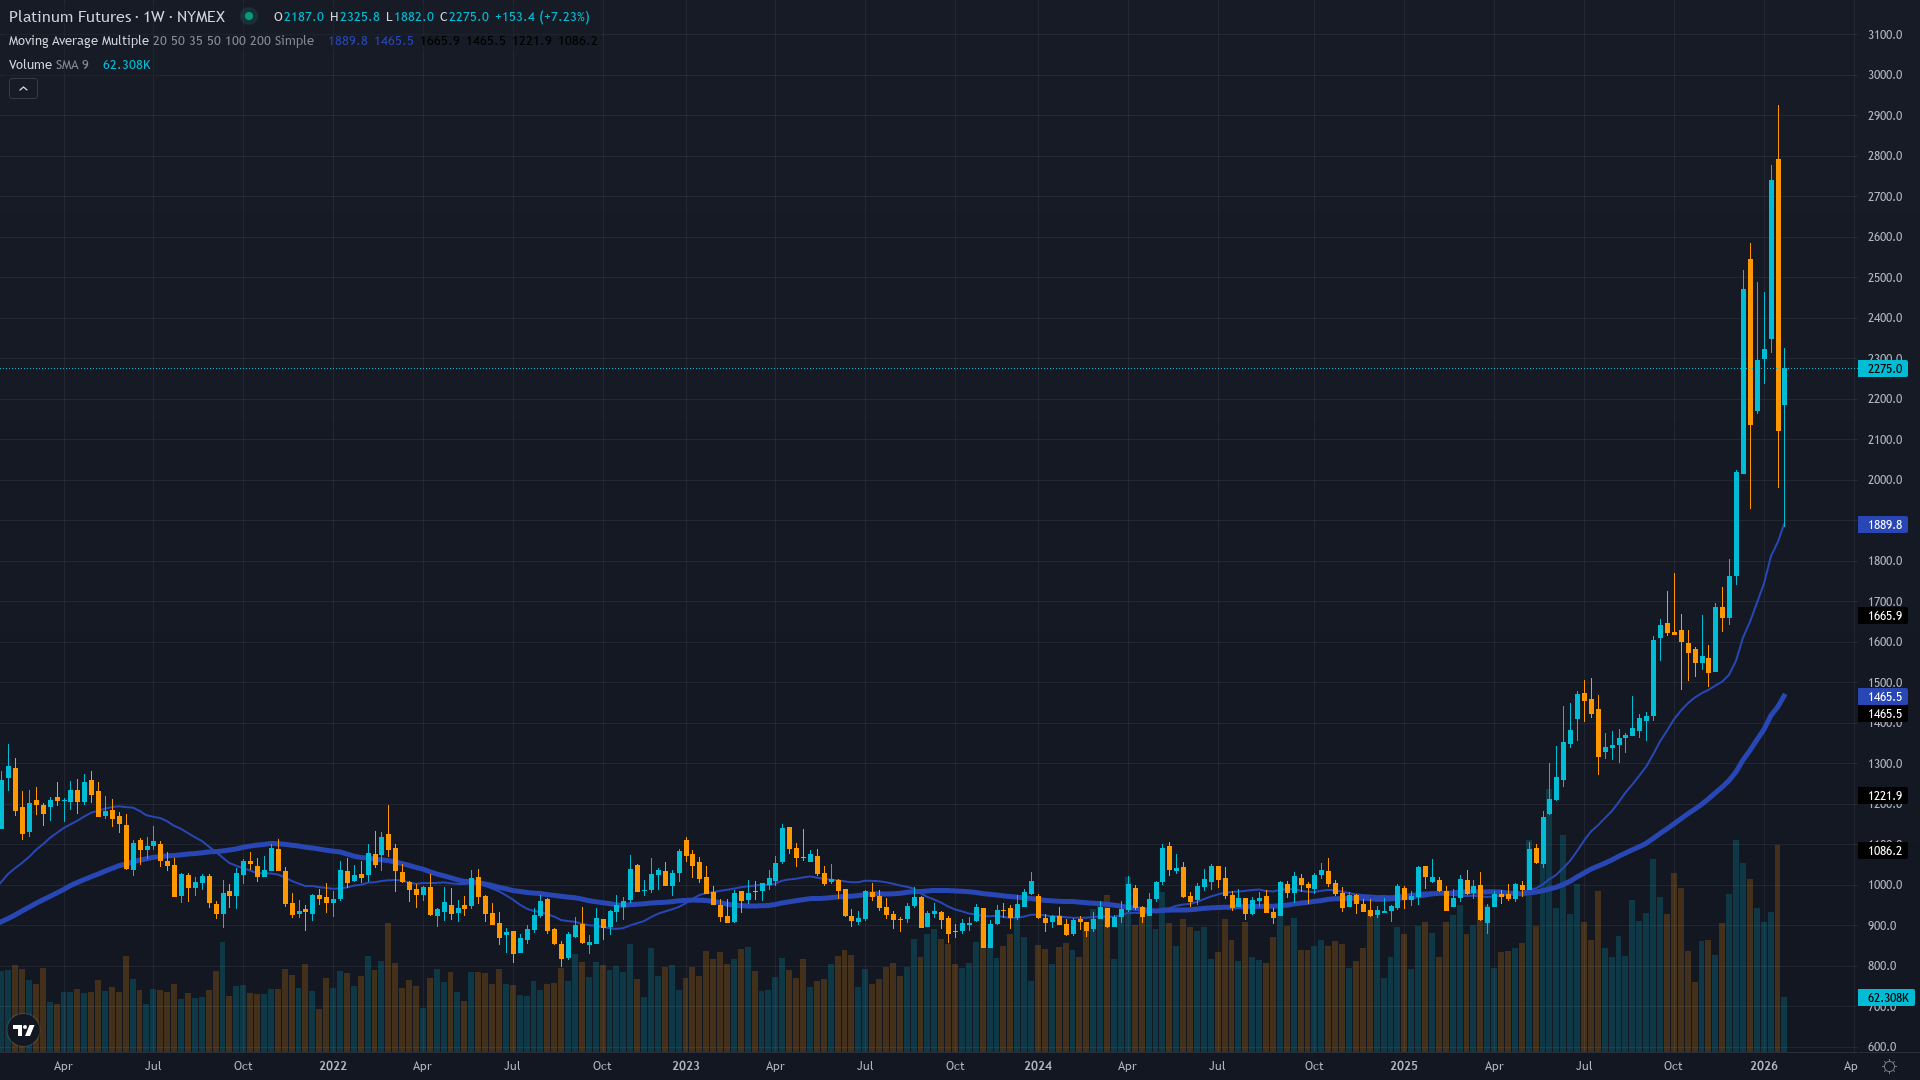
March 19, 2026 Q4 FY2026 earnings catalyst approaching as stock digests extraordinary 2025 gains from $1.67 low to $30.90 all-time high
| ▲ Resistance Zone 2 | 16 – 46 |
| ▲ Resistance Zone 1 | 15 – 45 |
| ─ Pivot Area | ~28 |
| ▼ Support Zone 1 | 10 – 40 |
| ▼ Support Zone 2 | 7 – 37 |
Consolidating 12% below January 16 all-time high of $30.90 after extraordinary 516% year-over-year rally; constructive digestion of gains above $25
Revenue growing 32% with $734.5M backlog (~2x annual run rate) providing visibility; still unprofitable (-$59.19M net income Q3) but margin improvement trajectory intact
Strong accumulation with beta of 2.07 and $8.78B market cap; recent director sale of 47K shares suggests profit-taking after parabolic move
February 2026 options available with 98% implied volatility on call contracts; limited liquidity reflecting growth stock profile with institutional accumulation
Government spending on satellite imagery accelerating amid geopolitical tensions; space sector benefiting from defense budgets and climate monitoring demand
Normal with slight backwardation as post-parabolic volatility elevated but normalizing from January extremes
Similar parabolic moves in small/mid-cap growth stocks historically show 60% continuation probability vs 40% correction probability within 30-60 days
Elevated volatility likely to persist 2-4 weeks given magnitude of move; mean reversion toward 25-30% annualized expected by March earnings
High volatility environment suggests daily ranges of $2-4 expected; breakout above $30 would signal resumption while break below $25 would indicate deeper consolidation to $22 support
Elevated 75th percentile volatility suggests 20-30% move potential over next 60 days versus normal 10-12% range; March 19 earnings likely directional catalyst for next major move
|
⚠️ Primary Risk
Valuation risk after 516% rally with stock trading at $27.11 versus analyst consensus price target of $19.66; commercial segment weakness (-8% y/y) increases government dependency Probability: MEDIUM
|
✦ Primary Opportunity
Continuation of government contract momentum with $735M backlog converting to revenue; potential upside to bull case analyst targets ranging $30-$35 Timeframe: 3-6 months through March 19 earnings and government budget cycle acceleration into Q2 2026
|
Planet Labs (PL) stands at a critical juncture on February 1, 2026, trading at $27.11 after one of the most spectacular stock transformations of 2025—surging 516% from the April 2024 low of $1.67 to an all-time high of $30.90 on January 16, 2026. Now consolidating 12% below that peak, the stock is exhibiting healthy digestion behavior following its parabolic ascent. The fundamental backdrop has dramatically improved: December's Q3 FY2026 earnings delivered a powerful beat with $81.3M revenue (+32% y/y exceeding estimates by 12.22%), while fiscal 2026 guidance was raised to $260-280M.
Most critically, backlog surged 216% year-over-year to $734.5M—now approximately 2x the annual revenue run rate—providing exceptional forward visibility and de-risking the growth trajectory. This backlog concentration in government contracts (37% applies to next 12 months, 61% beyond) creates both opportunity and dependency risk. While the company remains unprofitable with -$59.19M net income in Q3, the Satellite Services model reduces balance sheet burden via upfront customer commitments while enabling capital-light expansion and high-margin data resale.
Technical indicators show strong bullish momentum with the stock up 31.62% in the past month despite modest profit-taking, suggesting normal consolidation rather than trend reversal. Volatility metrics indicate elevated historical volatility with a beta of 2.07, meaning PL amplifies market moves significantly. The critical tension: analyst consensus shows a $19.66 price target (below current levels), though estimates range widely from $16.40 to $35.00, reflecting uncertainty about valuation sustainability.
The $8.78B market cap (up from recent lows) places it firmly in mid-cap territory with significant institutional ownership, though recent director sales signal some insider profit-taking after the extraordinary run. The approaching March 19, 2026 Q4 FY2026 earnings catalyst will be pivotal—the market will assess whether backlog conversion, margin improvement, and commercial segment recovery (currently weak at -8% y/y) can justify current valuations. The stock navigates the classic growth dilemma: strong fundamentals and backlog visibility argue for continued strength, but the magnitude of the 516% rally suggests consolidation risks before the next leg higher.
February seasonality data is limited for this recently volatile name, but the government contract cycle and March earnings setup create near-term catalysts.
| Week | Bias | Confidence |
|---|---|---|
| February 1, 2026 | BULLISH | 7/10 |
| January 25, 2026 | BULLISH | 7/10 |
| January 18, 2026 | BULLISH | 7/10 |
| January 11, 2026 | BULLISH | 7/10 |
| January 4, 2026 | BULLISH | 7/10 |
| December 28, 2025 | BULLISH | 8/10 |
| December 21, 2025 | BULLISH | 8/10 |
| December 14, 2025 | BULLISH | 8/10 |
| December 7, 2025 | BULLISH | 7/10 |
| November 30, 2025 | BULLISH | 7/10 |
| November 23, 2025 | BULLISH | 7/10 |
| November 16, 2025 | BULLISH | 7/10 |


