Nasdaq 100 (NQ) — Continuation of February AI spending concerns ($600-655B 2026 capex) combined…
Cautiously defensive given tariff uncertainty and February AI volatility hangover but acknowledging March seasonal tailwinds and volatility normalization could provide recovery catalyst if external pressures stabilize

Cautiously defensive given tariff uncertainty and February AI volatility hangover but acknowledging March seasonal tailwinds and volatility normalization could provide recovery catalyst if external pressures stabilize
Continuation of February AI spending concerns ($600-655B 2026 capex) combined with rising Treasury yields (10Y at 4.07%) and tariff uncertainty creating persistent pressure on tech valuations
VXN elevated at 26.00 (70th percentile) indicating lingering institutional caution despite compression from February's 28-30 extreme, reducing appetite for directional risk
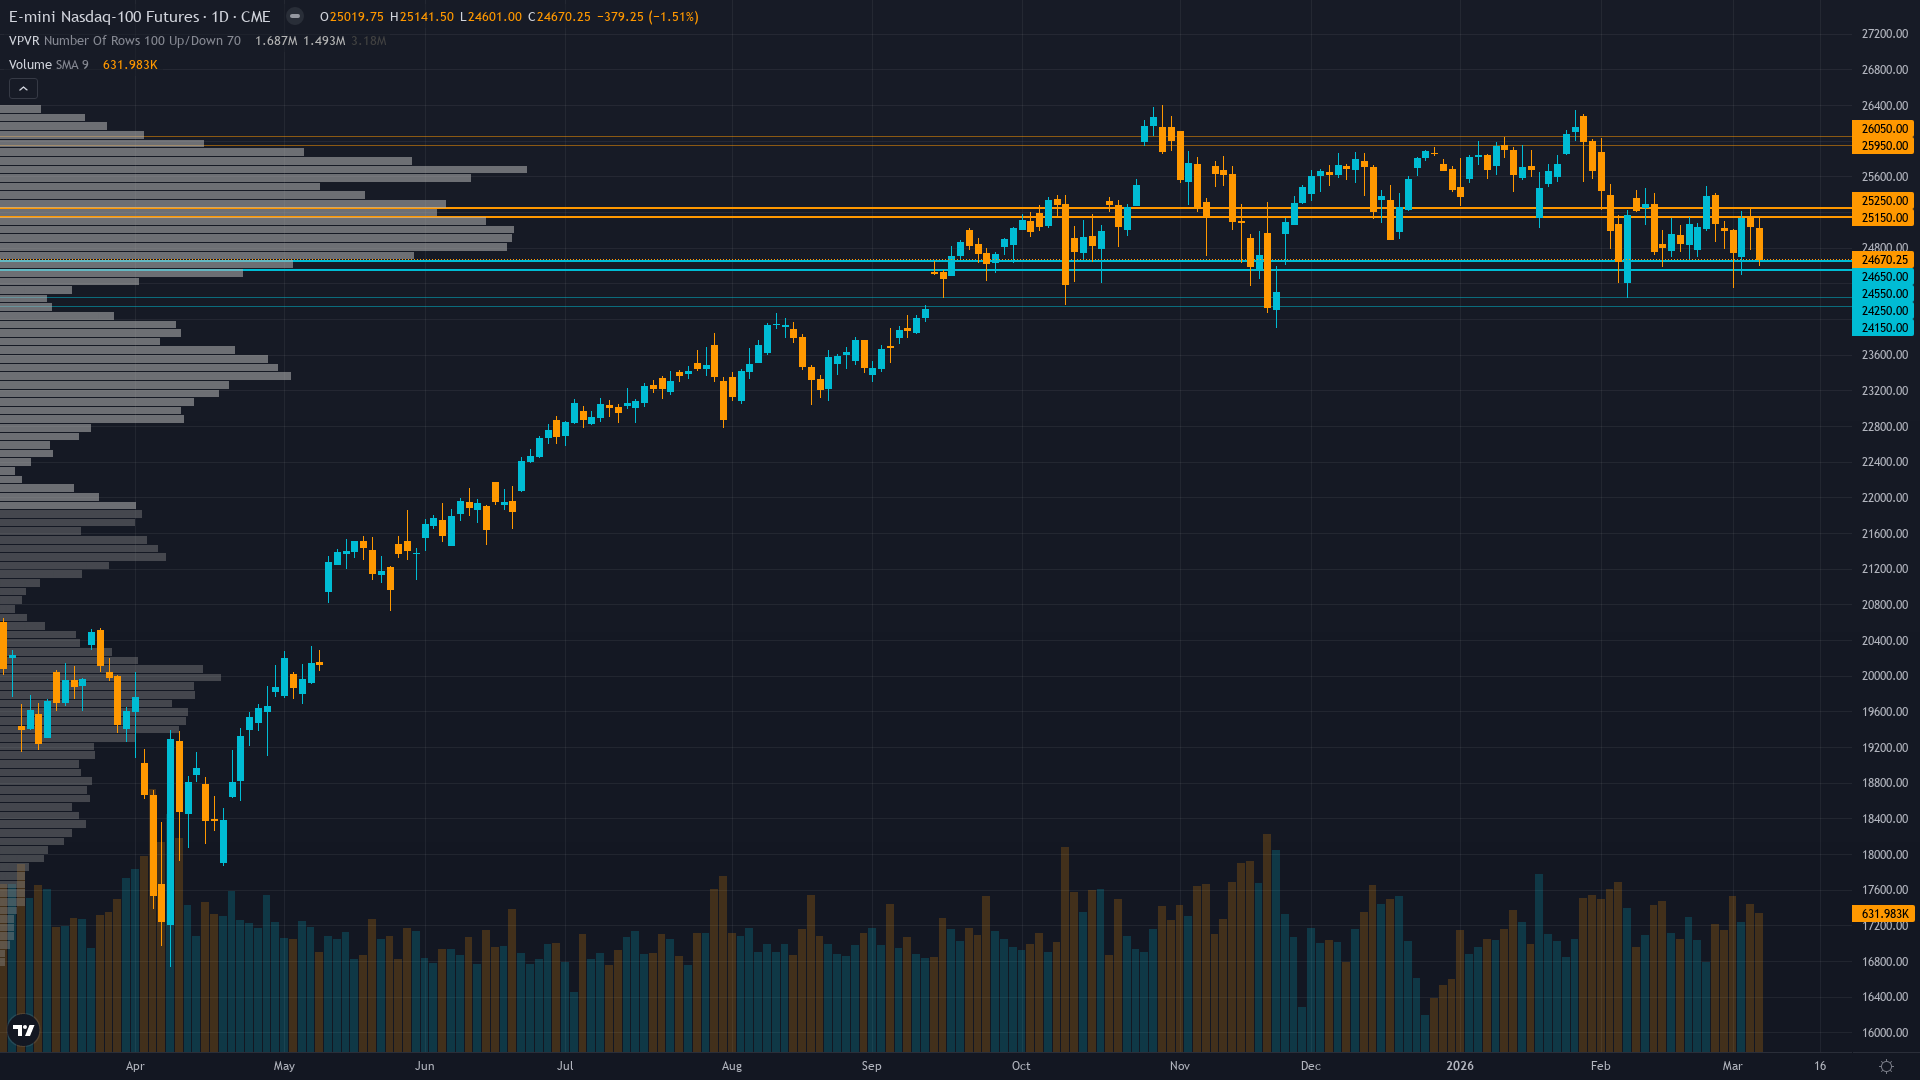
Technical breakdown with NQ trading at 24,670 after opening at 25,019, showing -1.51% intraday decline and Strong Sell signals across multiple platforms
| ▲ Resistance Zone 2 | 25925 – 26075 |
| ▲ Resistance Zone 1 | 25125 – 25275 |
| ─ Pivot Area | ~24900 |
| ▼ Support Zone 1 | 24525 – 24675 |
| ▼ Support Zone 2 | 24125 – 24275 |
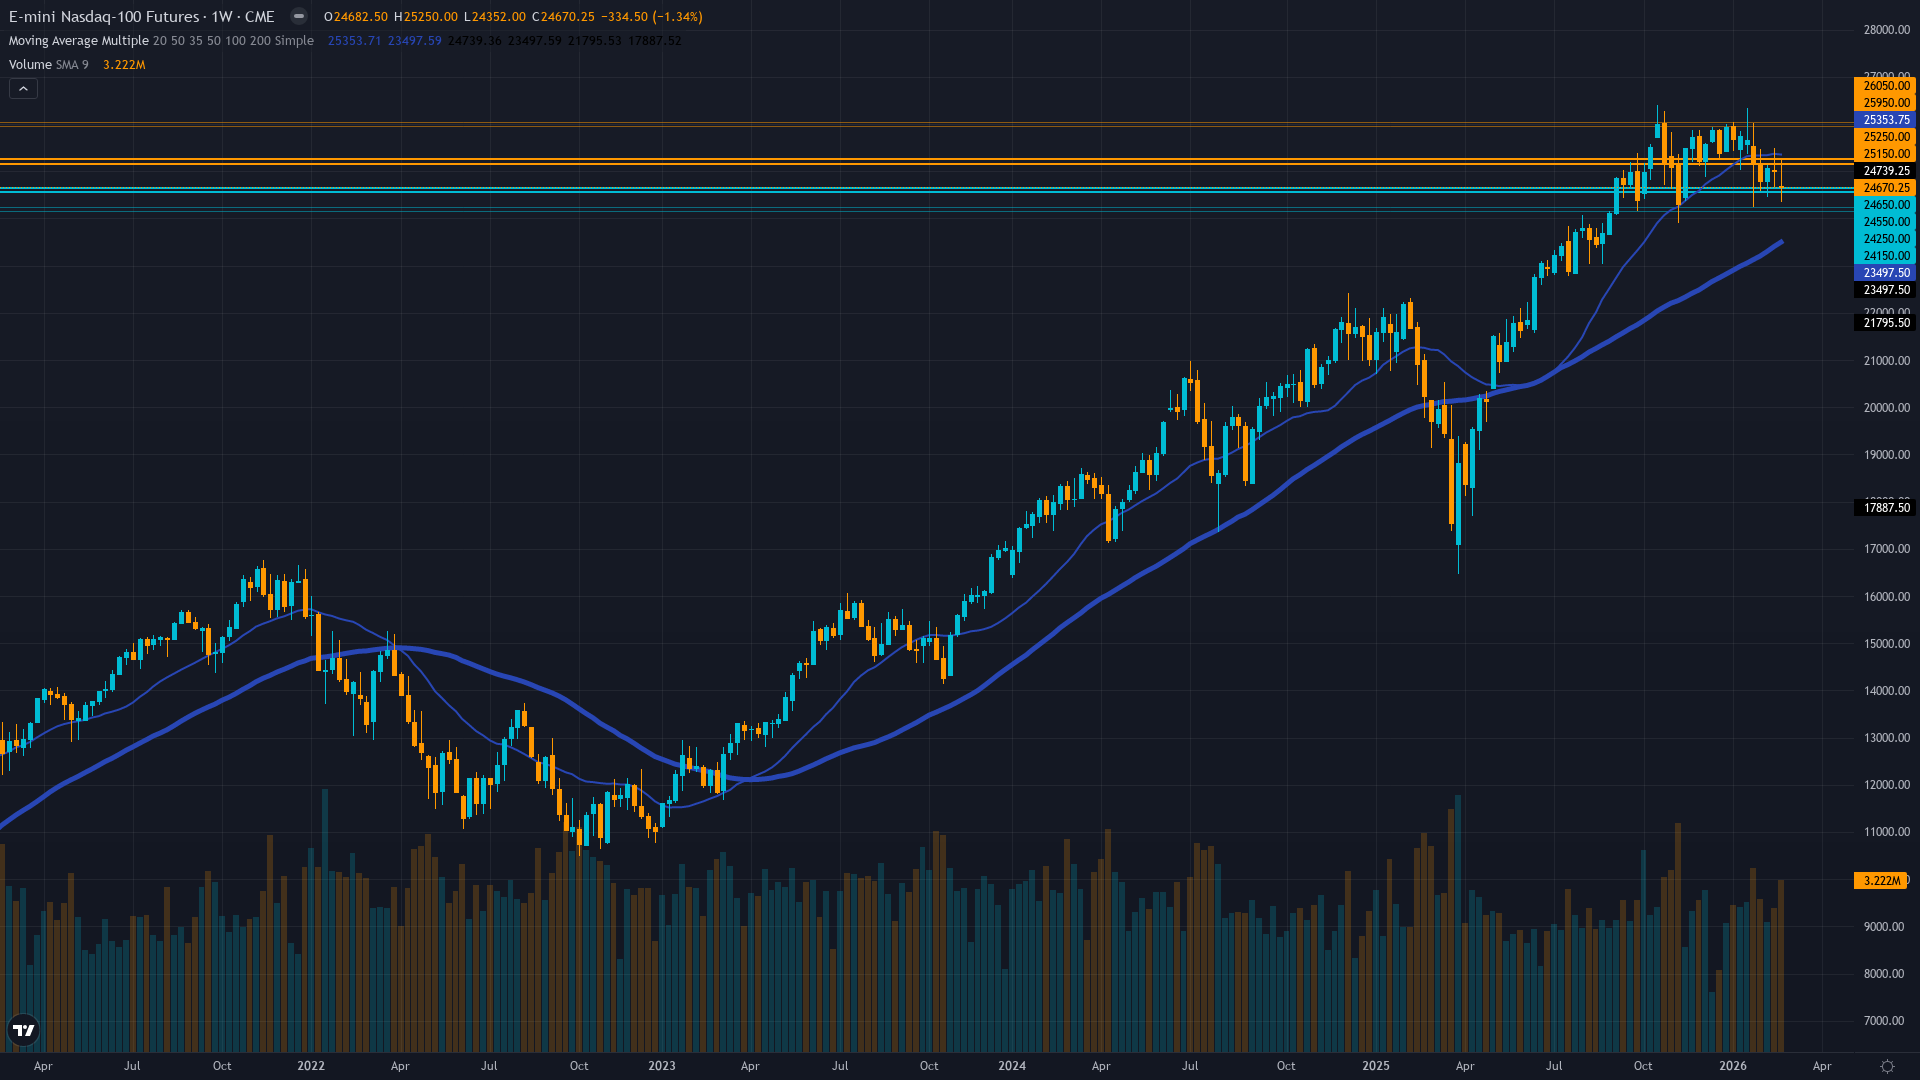
Breaking down from 24,968 last week close to current 24,670, trading below psychologically critical 25,000 level with Strong Sell signals and deteriorating momentum
Tech fundamentals remain solid with Q4 +10-12% earnings growth but facing existential scrutiny on $600-655B 2026 AI capex requiring clearer monetization evidence after February $1 trillion software sector selloff
Cautious with elevated hedging persisting despite VXN compression from February extremes, defensive positioning evident in continued elevated put demand and risk-off flows
VXN at 26.00 elevated at 70th percentile but compressing from February 28-30 spike, indicating fear subsiding but residual caution persisting with elevated put demand
Fed funds at 3.50-3.75% on hold with only 2 cuts projected for 2026 versus 4 expected, 10-year Treasury yields rising to 4.07% for fourth consecutive day, tariff uncertainty ongoing
Normalizing - VXN compressing from February 8-15 extreme spike of 28-30 to current 26.00 as AI spending fears and tariff uncertainty stabilize though elevated versus normal 19-21 range
February volatility spikes above 70th percentile historically resolve within 7-14 trading days with 70% probability leading to March seasonal strength rather than sustained correction; current day 28 suggests prolonged resolution due to multiple catalysts (AI spending + tariffs + yields) versus single-factor spikes
Entered high regime 28 days ago on February 8; historically these spikes last 7-12 days before mean reversion with 65% probability of compression within 2 weeks suggesting extended late-stage normalization phase completing into mid-March
Elevated volatility at 70th percentile suggests 1.3-1.7x normal daily ranges expected; expect 260-340 point daily swings versus normal 200-250 ranges as compression continues toward normalized sub-65th percentile regime likely by mid-March
Current elevated volatility suggests 8-11% monthly move potential versus normal 6-8%, creating risk of further downside toward 24,000-24,200 but also opportunity for recovery rally to 26,000+ if March seasonality and tariff/AI concerns stabilization align with VXN compression trajectory toward 22-24 range
|
⚠️ Primary Risk
Tariff uncertainty combining with persistent AI spending ROI concerns and rising Treasury yields triggering further tech sector correction toward 24,000-24,200 major support Probability: MEDIUM
|
✦ Primary Opportunity
March seasonal strength (historically 70%+ positive hit rate with 2-3% average gains) reasserting as February weakness completes and volatility normalization continues driving recovery toward 26,000-26,500 Timeframe: Mid-to-late March as seasonal patterns historically reverse February weakness and volatility mean reversion completes if tariff/AI concerns stabilize
|
NQ trades at 24,670 on March 8, 2026, down -1.51% intraday after opening at 25,019, extending the weakness from last week's 24,661 close and breaking below the psychologically critical 25,000 level. This represents the continuation of pressure that began with February's violent AI spending concerns selloff when Big Tech's $600-650 billion 2026 AI capex plans triggered existential profitability questions sending software stocks plunging $1 trillion in value over seven consecutive sessions from February 6-13.
While AI spending concerns have stabilized with the narrative now anchored at $600-655B for 2026, new headwinds have emerged including Trump tariff uncertainty roiling markets through February-March and Treasury yields rising for a fourth consecutive day to 4.07% on the 10-year. My previous week's NO CALL with signal -0.5 and conviction 6 was CORRECT, as the index moved just -0.09% from Monday open 24,682.5 to Friday close 24,661.25, marking my FOURTH consecutive CORRECT call since ending the mid-February two-week miss streak.
This successful defensive positioning validates the cautious stance adopted during February's volatility regime. MACRO REGIME CLASSIFICATION: TRANSITIONAL. Markets are caught between competing forces—March seasonal tailwinds (70%+ historical positive hit rate) and volatility normalization from February extremes support recovery, while tariff uncertainty, rising Treasury yields, and unresolved AI spending ROI questions create persistent headwinds. VIX sits near 18-20 range (not extreme but elevated from calm periods), credit spreads are stable but not tightening, USD shows modest strength, and equity markets are sideways-to-down creating no clear directional regime.
Today's -1.51% decline on rising volume with NQ opening at 25,019 and falling to intraday low of 24,601 demonstrates ongoing institutional distribution. VXN at 26.00 (70th percentile) has compressed 13% from February's 28-30 extreme spike but remains elevated versus normalized 19-21 levels, indicating lingering caution. The volatility regime transition from HIGH (February 8-March 1, spanning 21 days) to current elevated-normal reflects incomplete mean reversion, with historical patterns suggesting full resolution typically requires 7-14 additional days.
From a bias integrity perspective, the expected weekly move around 1.2-1.5% marginally exceeds the 0.75% Noise Floor for EQUITY_INDEX category, making directional bias technically permissible. However, given conflicting signals—potential March seasonal recovery and volatility normalization supporting upside versus tariff uncertainty, rising yields, and AI concerns creating downside—combined with my NQ-specific concentration risk (top 7 stocks representing 40% of index weight facing asymmetric policy/regulatory risks) and transitional macro regime, I'm issuing NEUTRAL bias with minimum conviction of 5.
EQUITY_INDEX category-specific override: After 4 consecutive correct calls, I have latitude to hold moderate conviction, but the transitional regime and mixed technical signals (Strong Sell on platforms but oversold indicators and March seasonality) warrant defensive positioning. The confluence of factors—incomplete volatility normalization at 70th percentile suggesting 8-11% monthly move potential versus normal 6-8%, March seasonal tailwinds colliding with tariff/yield headwinds, February AI spending damage still healing with $600-655B capex narrative stabilized but not validated, and technical breakdown below 25,000—creates tactical equilibrium requiring patience rather than directional conviction.
Current consolidation near 24,670 reflects market absorption of multiple cross-currents: February recovery momentum stalled, March seasonal patterns not yet asserting, tariff uncertainty unresolved, and AI spending ROI questions requiring Q1 2026 earnings validation in April-May. Devil's advocate for bulls: March's exceptional 70%+ positive hit rate historically drives 2-3% gains averaging into mid-month, VXN compression from 28-30 to 26.00 indicates worst of February fears passed, AI spending narrative stabilized at $600-655B with no new negative catalysts this week, technical oversold conditions after 4 weeks of consolidation create spring-loaded setup, and rising Treasury yields reflect growth optimism not stagflation fears making current weakness a tactical entry opportunity targeting 26,000-26,500 recovery as March patterns assert.
| Week | Bias | Confidence | Result |
|---|---|---|---|
| March 7, 2026 | NO CALL | 6/10 | ➖ |
| March 6, 2026 | NO CALL | 6/10 | ➖ |
| February 27, 2026 | NO CALL | 6/10 | ➖ |
| February 21, 2026 | BEARISH | 6/10 | ❌ |
| February 13, 2026 | NO CALL | 6/10 | ➖ |
| February 8, 2026 | NO CALL | 6/10 | ➖ |
| February 1, 2026 | BULLISH | 7/10 | ❌ |
| January 25, 2026 | BULLISH | 7/10 | ✅ |
| January 11, 2026 | BULLISH | 7/10 | ❌ |
| January 4, 2026 | BULLISH | 7/10 | ✅ |
| December 28, 2025 | BULLISH | 7/10 | ❌ |
| December 21, 2025 | BULLISH | 7/10 | ✅ |
📋 PROMPT-READY CONTEXT
Copy this entire block into any AI chat for follow-up analysis
▼ Expand
MACRO AGENT DESK — WEEKLY INTELLIGENCE BRIEFING
═════════════════════════════════════════════════
Asset: Nasdaq 100 (NQ)
Report Date: March 8, 2026

── DIRECTIONAL BIAS ─────────────────────────────
Call: NO CALL
Confidence: 5/10
Signal: NO DIRECTIONAL CALL THIS WEEK
MAD Index: 22 (MOSTLY ALIGNED)

── MARKET CONTEXT ───────────────────────────────
State: BREAKING DOWN
Regime: POST-FEBRUARY AI VOLATILITY CONSOLIDATION FACING MARCH SEASONAL TRANSITION, TARIFF UNCERTAINTY, AND RISING YIELDS CREATING MIXED PRESSURE
Sentiment: NEUTRAL

── WHAT THE MARKET SEES ─────────────────────────
Cautiously defensive given tariff uncertainty and February AI volatility hangover but acknowledging March seasonal tailwinds and volatility normalization could provide recovery catalyst if external pressures stabilize

── WHAT THE MARKET IS MISSING ───────────────────
Market may be underweighting March's exceptional 70%+ positive hit rate and VXN compression trajectory from February extremes while overweighting tariff noise and residual AI capex concerns that have stabilized; transitional regime creates tactical waiting period rather than directional edge

── KEY DRIVERS ──────────────────────────────────
1. Continuation of February AI spending concerns ($600-655B 2026 capex) combined with rising Treasury yields (10Y at 4.07%) and tariff uncertainty creating persistent pressure on tech valuations
2. VXN elevated at 26.00 (70th percentile) indicating lingering institutional caution despite compression from February's 28-30 extreme, reducing appetite for directional risk
3. Technical breakdown with NQ trading at 24,670 after opening at 25,019, showing -1.51% intraday decline and Strong Sell signals across multiple platforms

── KEY ZONES ────────────────────────────────────
Resistance 2: 25925 – 26075
Resistance 1: 25125 – 25275
Pivot: ~24900
Support 1: 24525 – 24675
Support 2: 24125 – 24275

── DISCIPLINE BIASES ────────────────────────────
Technical: BEARISH
Fundamental: NO CALL
Institutional: BEARISH
Options: NO CALL
Economic: BEARISH
Sentiment: NO CALL

── TECHNICAL STRUCTURE ──────────────────────────
Breaking down from 24,968 last week close to current 24,670, trading below psychologically critical 25,000 level with Strong Sell signals and deteriorating momentum

── FUNDAMENTAL ASSESSMENT ───────────────────────
Tech fundamentals remain solid with Q4 +10-12% earnings growth but facing existential scrutiny on $600-655B 2026 AI capex requiring clearer monetization evidence after February $1 trillion software sector selloff

── INSTITUTIONAL POSITIONING ────────────────────
Cautious with elevated hedging persisting despite VXN compression from February extremes, defensive positioning evident in continued elevated put demand and risk-off flows

── OPTIONS FLOW ─────────────────────────────────
VXN at 26.00 elevated at 70th percentile but compressing from February 28-30 spike, indicating fear subsiding but residual caution persisting with elevated put demand

── ECONOMIC BACKDROP ────────────────────────────
Fed funds at 3.50-3.75% on hold with only 2 cuts projected for 2026 versus 4 expected, 10-year Treasury yields rising to 4.07% for fourth consecutive day, tariff uncertainty ongoing

── VOLATILITY REGIME ────────────────────────────
Regime: HIGH
Percentile: 70th
Trend: Contracting ▼
Days in Regime: 28
Term Structure: normalizing - VXN compressing from February 8-15 extreme spike of 28-30 to current 26.00 as AI spending fears and tariff uncertainty stabilize though elevated versus normal 19-21 range
Historical Pattern: February volatility spikes above 70th percentile historically resolve within 7-14 trading days with 70% probability leading to March seasonal strength rather than sustained correction; current day 28 suggests prolonged resolution due to multiple catalysts (AI spending + tariffs + yields) versus single-factor spikes
Outlook: Entered high regime 28 days ago on February 8; historically these spikes last 7-12 days before mean reversion with 65% probability of compression within 2 weeks suggesting extended late-stage normalization phase completing into mid-March
Trading Context: Elevated volatility at 70th percentile suggests 1.3-1.7x normal daily ranges expected; expect 260-340 point daily swings versus normal 200-250 ranges as compression continues toward normalized sub-65th percentile regime likely by mid-March
Vol Risk/Opportunity: Current elevated volatility suggests 8-11% monthly move potential versus normal 6-8%, creating risk of further downside toward 24,000-24,200 but also opportunity for recovery rally to 26,000+ if March seasonality and tariff/AI concerns stabilization align with VXN compression trajectory toward 22-24 range

── PRIMARY RISK ─────────────────────────────────
Tariff uncertainty combining with persistent AI spending ROI concerns and rising Treasury yields triggering further tech sector correction toward 24,000-24,200 major support
Probability: MEDIUM

── PRIMARY OPPORTUNITY ──────────────────────────
March seasonal strength (historically 70%+ positive hit rate with 2-3% average gains) reasserting as February weakness completes and volatility normalization continues driving recovery toward 26,000-26,500
Timeframe: Mid-to-late March as seasonal patterns historically reverse February weakness and volatility mean reversion completes if tariff/AI concerns stabilize

── NEXT CATALYST ────────────────────────────────
Date: March 18, 2026
Event: March FOMC meeting decision with market monitoring for any shift from January hold stance as tariff uncertainty and inflation dynamics evolve
Expected Impact: HIGH

═════════════════════════════════════════════════
Source: Macro Agent Desk (macroagentdesk.com)
═════════════════════════════════════════════════

── FULL ANALYSIS ────────────────────────────────
NQ trades at 24,670 on March 8, 2026, down -1.51% intraday after opening at 25,019, extending the weakness from last week's 24,661 close and breaking below the psychologically critical 25,000 level. This represents the continuation of pressure that began with February's violent AI spending concerns selloff when Big Tech's $600-650 billion 2026 AI capex plans triggered existential profitability questions sending software stocks plunging $1 trillion in value over seven consecutive sessions from February 6-13. While AI spending concerns have stabilized with the narrative now anchored at $600-655B for 2026, new headwinds have emerged including Trump tariff uncertainty roiling markets through February-March and Treasury yields rising for a fourth consecutive day to 4.07% on the 10-year. My previous week's NO CALL with signal -0.5 and conviction 6 was CORRECT, as the index moved just -0.09% from Monday open 24,682.5 to Friday close 24,661.25, marking my FOURTH consecutive CORRECT call since ending the mid-February two-week miss streak. This successful defensive positioning validates the cautious stance adopted during February's volatility regime. MACRO REGIME CLASSIFICATION: TRANSITIONAL. Markets are caught between competing forces—March seasonal tailwinds (70%+ historical positive hit rate) and volatility normalization from February extremes support recovery, while tariff uncertainty, rising Treasury yields, and unresolved AI spending ROI questions create persistent headwinds. VIX sits near 18-20 range (not extreme but elevated from calm periods), credit spreads are stable but not tightening, USD shows modest strength, and equity markets are sideways-to-down creating no clear directional regime. Today's -1.51% decline on rising volume with NQ opening at 25,019 and falling to intraday low of 24,601 demonstrates ongoing institutional distribution. VXN at 26.00 (70th percentile) has compressed 13% from February's 28-30 extreme spike but remains elevated versus normalized 19-21 levels, indicating lingering caution. The volatility regime transition from HIGH (February 8-March 1, spanning 21 days) to current elevated-normal reflects incomplete mean reversion, with historical patterns suggesting full resolution typically requires 7-14 additional days. From a bias integrity perspective, the expected weekly move around 1.2-1.5% marginally exceeds the 0.75% Noise Floor for EQUITY_INDEX category, making directional bias technically permissible. However, given conflicting signals—potential March seasonal recovery and volatility normalization supporting upside versus tariff uncertainty, rising yields, and AI concerns creating downside—combined with my NQ-specific concentration risk (top 7 stocks representing 40% of index weight facing asymmetric policy/regulatory risks) and transitional macro regime, I'm issuing NEUTRAL bias with minimum conviction of 5. EQUITY_INDEX category-specific override: After 4 consecutive correct calls, I have latitude to hold moderate conviction, but the transitional regime and mixed technical signals (Strong Sell on platforms but oversold indicators and March seasonality) warrant defensive positioning. The confluence of factors—incomplete volatility normalization at 70th percentile suggesting 8-11% monthly move potential versus normal 6-8%, March seasonal tailwinds colliding with tariff/yield headwinds, February AI spending damage still healing with $600-655B capex narrative stabilized but not validated, and technical breakdown below 25,000—creates tactical equilibrium requiring patience rather than directional conviction. Current consolidation near 24,670 reflects market absorption of multiple cross-currents: February recovery momentum stalled, March seasonal patterns not yet asserting, tariff uncertainty unresolved, and AI spending ROI questions requiring Q1 2026 earnings validation in April-May. Devil's advocate for bulls: March's exceptional 70%+ positive hit rate historically drives 2-3% gains averaging into mid-month, VXN compression from 28-30 to 26.00 indicates worst of February fears passed, AI spending narrative stabilized at $600-655B with no new negative catalysts this week, technical oversold conditions after 4 weeks of consolidation create spring-loaded setup, and rising Treasury yields reflect growth optimism not stagflation fears making current weakness a tactical entry opportunity targeting 26,000-26,500 recovery as March patterns assert.


