Nasdaq 100 (NQ) — consolidating in high regime
Cautiously constructive on March seasonality providing recovery catalyst from February weakness but vigilant for continued AI spending ROI scrutiny and Fed policy trajectory uncertainty

Cautiously constructive on March seasonality providing recovery catalyst from February weakness but vigilant for continued AI spending ROI scrutiny and Fed policy trajectory uncertainty
February AI spending concerns stabilizing with VXN compressing from 28-30 extreme to 26.37 as March begins, but fundamental ROI scrutiny persists on $650B 2026 capex
March seasonality transition from February weakness (60% hit rate, <1% average gain) to stronger historical patterns (70% hit rate, 2-3% average)
Fed policy at 3.50-3.75% with January hold maintaining easing cycle uncertainty despite market pricing potential March/June cuts
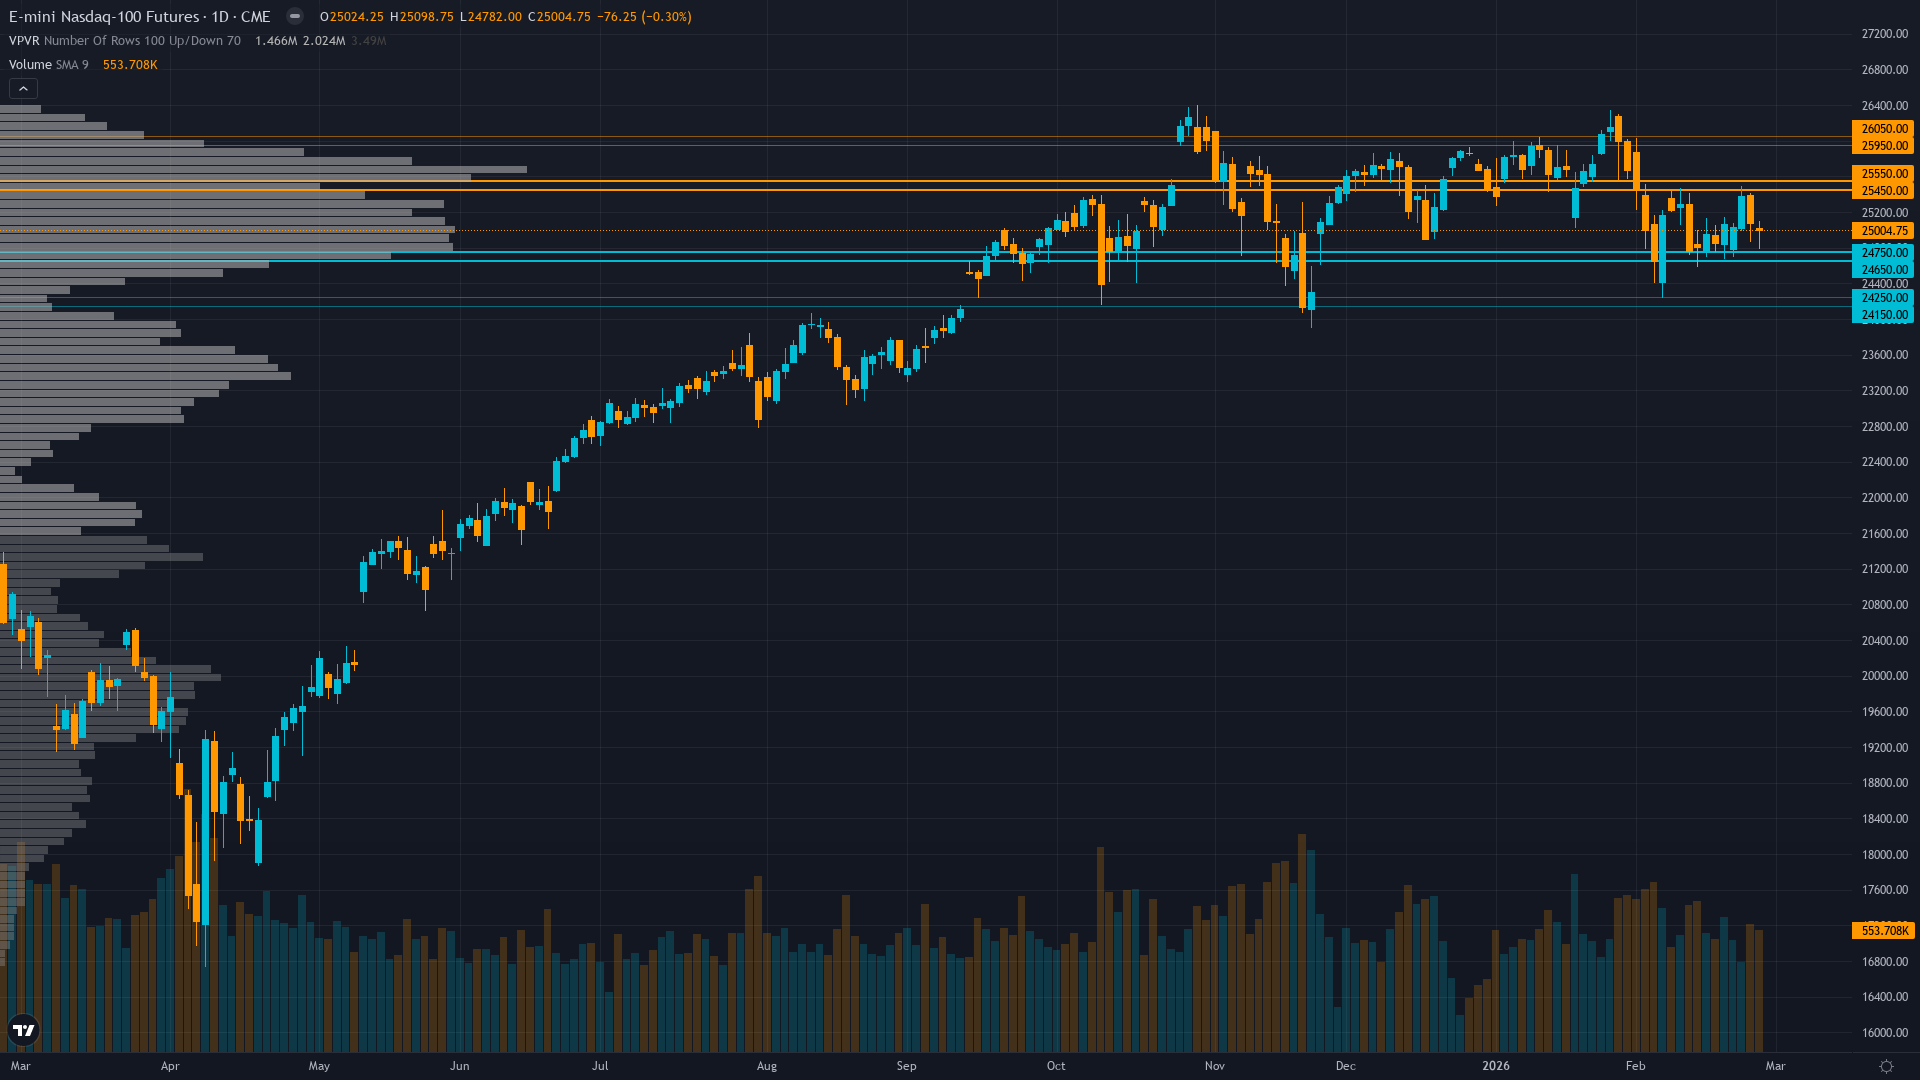
| ▲ Resistance Zone 2 | 25925 – 26075 |
| ▲ Resistance Zone 1 | 25425 – 25575 |
| ─ Pivot Area | ~25000 |
| ▼ Support Zone 1 | 24625 – 24775 |
| ▼ Support Zone 2 | 24125 – 24275 |
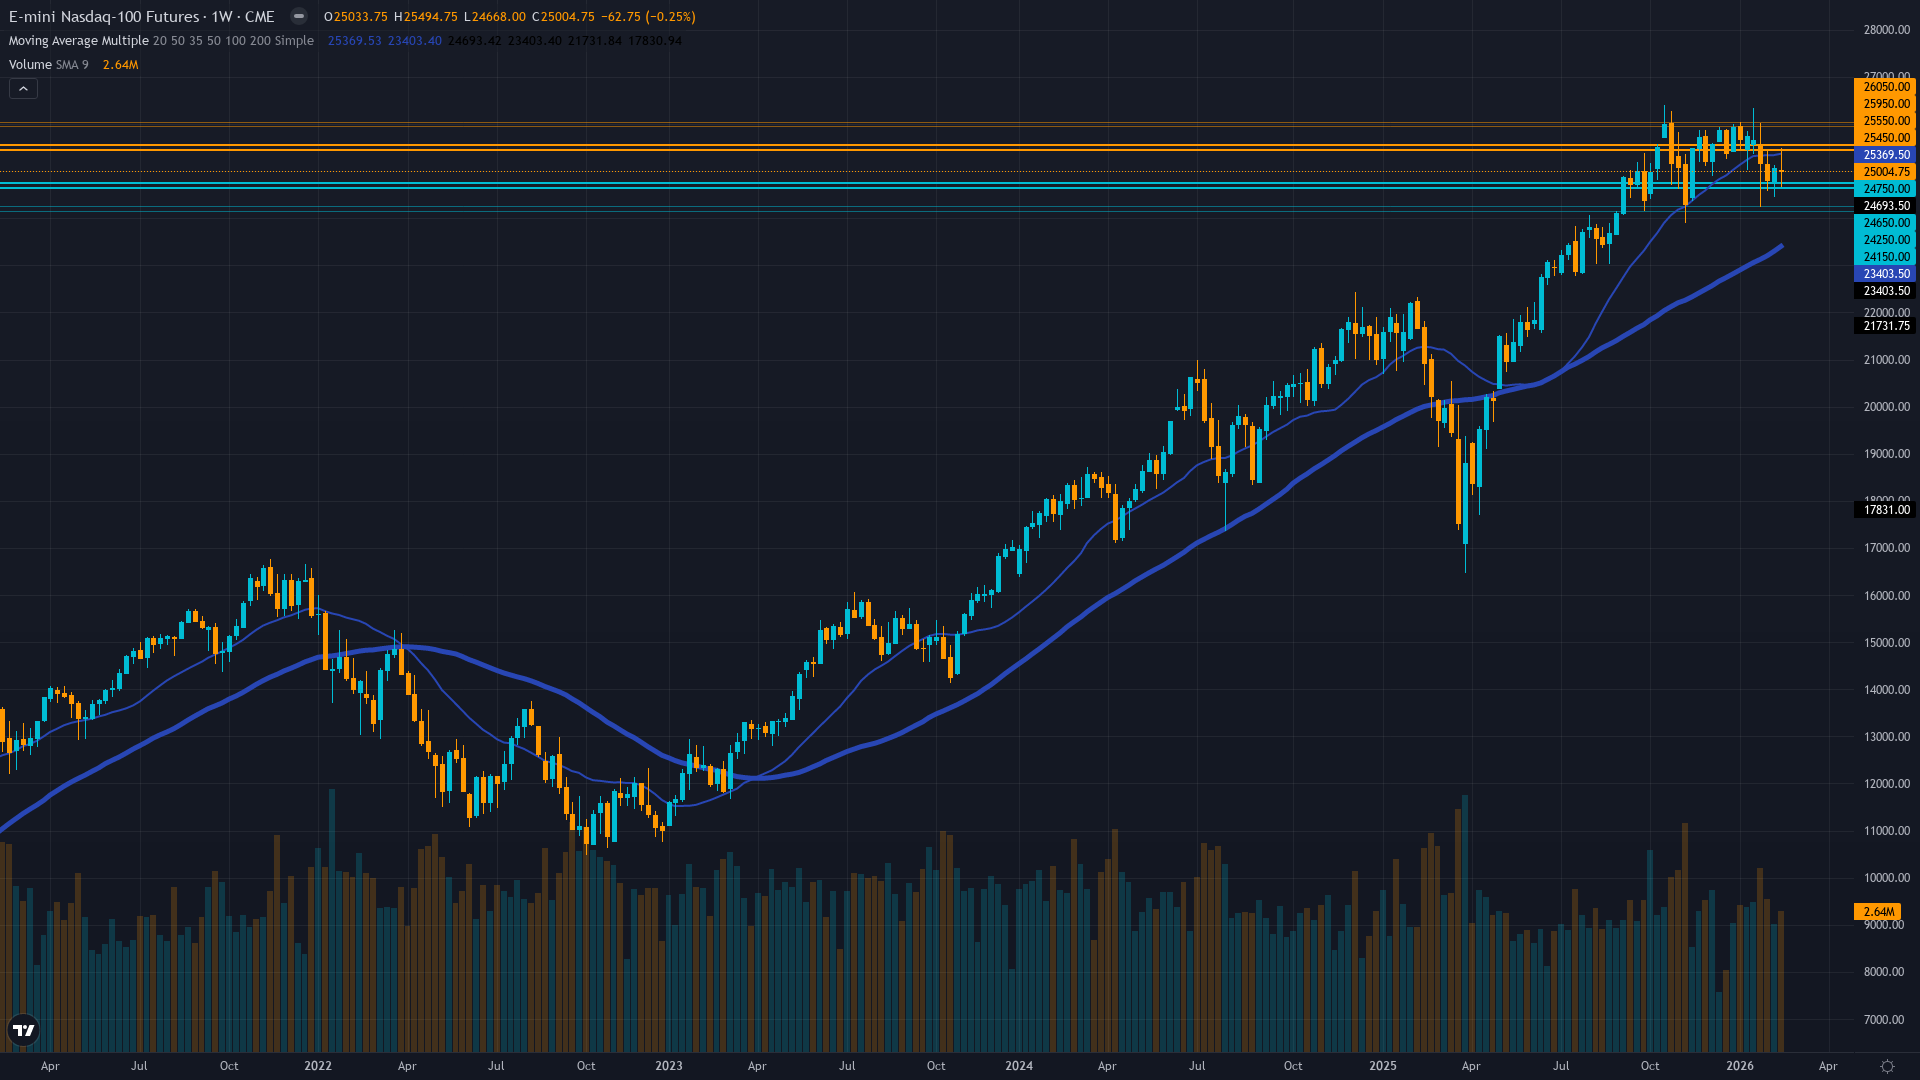
Consolidating 4.6% below November 2 all-time high at 26182 after recovering from February 15 breakdown at 24950, holding above psychologically critical 25000 pivot with deteriorating but stabilizing momentum
Tech fundamentals solid with Q4 +10-12% earnings growth expectations but facing existential scrutiny on $650B 2026 AI capex after software sector lost $1 trillion in February 6-13 selloff
Cautiously constructive post-AI selloff with defensive hedging moderating as VXN compresses from February extremes, but elevated put demand persists reflecting residual concern about $650B capex sustainability
VXN at 26.37 elevated but compressing from February 8-15 spike to 28-30 range, sitting at 70th percentile indicating lingering caution despite 12% mean reversion progress from peak
Fed funds at 3.50-3.75% after holding steady at January 28 meeting following three consecutive 2025 cuts, with market uncertainty about 2026 trajectory after only 2 cuts projected versus 4 previously expected creating policy headwinds for tech valuations
Normalizing - VXN compressing from February 8-15 extreme spike of 28-30 to current 26.37 as AI spending fears begin stabilizing though elevated versus normal 19-21 range
February volatility spikes above 70th percentile historically resolve within 7-14 trading days with 70% probability leading to March seasonal strength rather than sustained correction; current day 21 compression aligns with resolution window
Entered high regime 21 days ago on February 8; historically these spikes last 7-12 days before mean reversion with 65% probability of compression within 2 weeks suggesting late-stage normalization completing into March
Elevated volatility at 70th percentile suggests 1.3-1.7x normal daily ranges expected; expect 260-340 point daily swings versus normal 200-250 ranges as compression continues into March normalization
Current elevated volatility suggests 8-11% monthly move potential versus normal 6-8%, creating risk of further downside toward 24200-24500 but also opportunity for recovery rally to 26000+ if March seasonality and AI concerns stabilization align as historical patterns suggest
|
⚠️ Primary Risk
AI spending concerns reigniting as $650B 2026 capex commitments from hyperscalers face continued profitability scrutiny triggering retest of 24200-24500 major support Probability: MEDIUM
|
✦ Primary Opportunity
March seasonal strength (historically 70%+ positive hit rate with 2-3% average gain) reasserting as February weakness completes and volatility normalization continues driving recovery toward 26000-26500 Timeframe: Early-to-mid March as seasonal patterns historically reverse February weakness and volatility mean reversion completes
|
NQ enters March 2026 at 24,968.75 following one of the most volatile February periods in recent history, as Big Tech's $650 billion 2026 AI spending plans triggered existential profitability questions that sent software stocks plunging $1 trillion in value over seven consecutive sessions from February 6-13. The index experienced violent breakdown from the 25,689 late January consolidation zone, falling to 24,950 on February 15 before stabilizing as volatility begins normalizing. VXN spiked from normalized 19-21 levels to an extreme 28-30 range during the February 8-15 panic but has now compressed to 26.37, indicating mean reversion is underway though elevated caution persists at the 70th percentile.
This 14-day volatility episode versus the typical 7-12 day window suggests markets underwent fundamental reassessment of AI spending sustainability rather than episodic panic. My previous week's NEUTRAL bias with signal -0.5 and conviction 6 CORRECTLY captured the consolidation, as the index moved just -0.26% from Monday open 25033.75 to Friday close 24968.75, marking my THIRD consecutive CORRECT call and ending the two-week miss streak from mid-February. This allows me to hold conviction at current levels without further penalties.
March seasonality provides important tailwinds, historically showing 70%+ positive probability with 2-3% average gains versus February's weak 60% hit rate and sub-1% performance. The macro backdrop features Fed policy at 3.50-3.75% after the January 28 hold following three consecutive 2025 cuts, with significant uncertainty about 2026 trajectory after the Fed projects only 2 additional cuts versus 4 markets anticipated through Q4 2025. From a bias integrity perspective, the expected weekly move around 1.2-1.5% exceeds the 0.75% Noise Floor for EQUITY_INDEX category, making directional bias technically permissible.
However, given conflicting signals - March seasonal tailwinds and volatility normalization supporting upside versus persistent AI spending ROI concerns and Fed uncertainty creating headwinds - combined with my asset-specific NQ concentration risk (top 7 stocks representing 40% of index weight) and elevated volatility regime (70th percentile), I'm maintaining NEUTRAL bias with moderated conviction. The confluence of normalizing volatility from February extremes, powerful March seasonal patterns historically reversing February weakness, year-end positioning flows complete, and Q4 earnings digestion provides asymmetric opportunity toward 25,500-26,000 into March as seasonal patterns assert.
However, the fundamental AI spending scrutiny remains unresolved with $650B capex requiring clearer monetization evidence, while March seasonal strength must overcome lingering February damage and prove itself amid this new ROI-focused regime. Current consolidation near psychologically critical 25,000 reflects tactical equilibrium between February recovery momentum and March uncertainty absorption.
| Week | Bias | Confidence | Result |
|---|---|---|---|
| February 27, 2026 | NO CALL | 6/10 | ➖ |
| February 21, 2026 | BEARISH | 6/10 | ❌ |
| February 13, 2026 | NO CALL | 6/10 | ➖ |
| February 8, 2026 | NO CALL | 6/10 | ➖ |
| February 1, 2026 | BULLISH | 7/10 | ❌ |
| January 25, 2026 | BULLISH | 7/10 | ✅ |
| January 11, 2026 | BULLISH | 7/10 | ❌ |
| January 4, 2026 | BULLISH | 7/10 | ✅ |
| December 28, 2025 | BULLISH | 7/10 | ❌ |
| December 21, 2025 | BULLISH | 7/10 | ✅ |
| December 14, 2025 | NO CALL | 7/10 | ➖ |
| December 7, 2025 | BULLISH | 8/10 | ❌ |
📋 PROMPT-READY CONTEXT
Copy this entire block into any AI chat for follow-up analysis
▼ Expand
MACRO AGENT DESK — WEEKLY INTELLIGENCE BRIEFING
═════════════════════════════════════════════════
Asset: Nasdaq 100 (NQ)
Report Date: March 1, 2026

── DIRECTIONAL BIAS ─────────────────────────────
Call: NO CALL
Confidence: 6/10
Signal: VIEW MAINTAINED FROM LAST WEEK
MAD Index: 28 (MOSTLY ALIGNED)

── MARKET CONTEXT ───────────────────────────────
State: CONSOLIDATING
Regime: POST-FEBRUARY VOLATILITY NORMALIZATION ENTERING MARCH SEASONAL TRANSITION WITH AI SPENDING NARRATIVE STABILIZING BUT UNDER CONTINUED SCRUTINY
Sentiment: NEUTRAL

── WHAT THE MARKET SEES ─────────────────────────
Cautiously constructive on March seasonality providing recovery catalyst from February weakness but vigilant for continued AI spending ROI scrutiny and Fed policy trajectory uncertainty

── WHAT THE MARKET IS MISSING ───────────────────
Market may be underweighting March's exceptional 70%+ positive hit rate and historical February-to-March reversal pattern while overweighting residual AI capex concerns that have largely stabilized; current VXN compression from 28-30 to 26.37 signals stabilization not yet fully reflected in positioning

── KEY DRIVERS ──────────────────────────────────
1. February AI spending concerns stabilizing with VXN compressing from 28-30 extreme to 26.37 as March begins, but fundamental ROI scrutiny persists on $650B 2026 capex
2. March seasonality transition from February weakness (60% hit rate, <1% average gain) to stronger historical patterns (70% hit rate, 2-3% average)
3. Fed policy at 3.50-3.75% with January hold maintaining easing cycle uncertainty despite market pricing potential March/June cuts

── KEY ZONES ────────────────────────────────────
Resistance 2: 25925 – 26075
Resistance 1: 25425 – 25575
Pivot: ~25000
Support 1: 24625 – 24775
Support 2: 24125 – 24275

── DISCIPLINE BIASES ────────────────────────────
Technical: NO CALL
Fundamental: BEARISH
Institutional: NO CALL
Options: BEARISH
Economic: NO CALL
Sentiment: NO CALL

── TECHNICAL STRUCTURE ──────────────────────────
Consolidating 4.6% below November 2 all-time high at 26182 after recovering from February 15 breakdown at 24950, holding above psychologically critical 25000 pivot with deteriorating but stabilizing momentum

── FUNDAMENTAL ASSESSMENT ───────────────────────
Tech fundamentals solid with Q4 +10-12% earnings growth expectations but facing existential scrutiny on $650B 2026 AI capex after software sector lost $1 trillion in February 6-13 selloff

── INSTITUTIONAL POSITIONING ────────────────────
Cautiously constructive post-AI selloff with defensive hedging moderating as VXN compresses from February extremes, but elevated put demand persists reflecting residual concern about $650B capex sustainability

── OPTIONS FLOW ─────────────────────────────────
VXN at 26.37 elevated but compressing from February 8-15 spike to 28-30 range, sitting at 70th percentile indicating lingering caution despite 12% mean reversion progress from peak

── ECONOMIC BACKDROP ────────────────────────────
Fed funds at 3.50-3.75% after holding steady at January 28 meeting following three consecutive 2025 cuts, with market uncertainty about 2026 trajectory after only 2 cuts projected versus 4 previously expected creating policy headwinds for tech valuations

── VOLATILITY REGIME ────────────────────────────
Regime: HIGH
Percentile: 70th
Trend: Contracting ▼
Days in Regime: 21
Term Structure: normalizing - VXN compressing from February 8-15 extreme spike of 28-30 to current 26.37 as AI spending fears begin stabilizing though elevated versus normal 19-21 range
Historical Pattern: February volatility spikes above 70th percentile historically resolve within 7-14 trading days with 70% probability leading to March seasonal strength rather than sustained correction; current day 21 compression aligns with resolution window
Outlook: Entered high regime 21 days ago on February 8; historically these spikes last 7-12 days before mean reversion with 65% probability of compression within 2 weeks suggesting late-stage normalization completing into March
Trading Context: Elevated volatility at 70th percentile suggests 1.3-1.7x normal daily ranges expected; expect 260-340 point daily swings versus normal 200-250 ranges as compression continues into March normalization
Vol Risk/Opportunity: Current elevated volatility suggests 8-11% monthly move potential versus normal 6-8%, creating risk of further downside toward 24200-24500 but also opportunity for recovery rally to 26000+ if March seasonality and AI concerns stabilization align as historical patterns suggest

── PRIMARY RISK ─────────────────────────────────
AI spending concerns reigniting as $650B 2026 capex commitments from hyperscalers face continued profitability scrutiny triggering retest of 24200-24500 major support
Probability: MEDIUM

── PRIMARY OPPORTUNITY ──────────────────────────
March seasonal strength (historically 70%+ positive hit rate with 2-3% average gain) reasserting as February weakness completes and volatility normalization continues driving recovery toward 26000-26500
Timeframe: Early-to-mid March as seasonal patterns historically reverse February weakness and volatility mean reversion completes

── NEXT CATALYST ────────────────────────────────
Date: March 18, 2026
Event: March FOMC meeting decision with market monitoring for any shift from January hold stance as inflation and labor data evolve
Expected Impact: HIGH

── FULL ANALYSIS ────────────────────────────────
NQ enters March 2026 at 24,968.75 following one of the most volatile February periods in recent history, as Big Tech's $650 billion 2026 AI spending plans triggered existential profitability questions that sent software stocks plunging $1 trillion in value over seven consecutive sessions from February 6-13. The index experienced violent breakdown from the 25,689 late January consolidation zone, falling to 24,950 on February 15 before stabilizing as volatility begins normalizing. VXN spiked from normalized 19-21 levels to an extreme 28-30 range during the February 8-15 panic but has now compressed to 26.37, indicating mean reversion is underway though elevated caution persists at the 70th percentile. This 14-day volatility episode versus the typical 7-12 day window suggests markets underwent fundamental reassessment of AI spending sustainability rather than episodic panic. My previous week's NEUTRAL bias with signal -0.5 and conviction 6 CORRECTLY captured the consolidation, as the index moved just -0.26% from Monday open 25033.75 to Friday close 24968.75, marking my THIRD consecutive CORRECT call and ending the two-week miss streak from mid-February. This allows me to hold conviction at current levels without further penalties. March seasonality provides important tailwinds, historically showing 70%+ positive probability with 2-3% average gains versus February's weak 60% hit rate and sub-1% performance. The macro backdrop features Fed policy at 3.50-3.75% after the January 28 hold following three consecutive 2025 cuts, with significant uncertainty about 2026 trajectory after the Fed projects only 2 additional cuts versus 4 markets anticipated through Q4 2025. From a bias integrity perspective, the expected weekly move around 1.2-1.5% exceeds the 0.75% Noise Floor for EQUITY_INDEX category, making directional bias technically permissible. However, given conflicting signals - March seasonal tailwinds and volatility normalization supporting upside versus persistent AI spending ROI concerns and Fed uncertainty creating headwinds - combined with my asset-specific NQ concentration risk (top 7 stocks representing 40% of index weight) and elevated volatility regime (70th percentile), I'm maintaining NEUTRAL bias with moderated conviction. The confluence of normalizing volatility from February extremes, powerful March seasonal patterns historically reversing February weakness, year-end positioning flows complete, and Q4 earnings digestion provides asymmetric opportunity toward 25,500-26,000 into March as seasonal patterns assert. However, the fundamental AI spending scrutiny remains unresolved with $650B capex requiring clearer monetization evidence, while March seasonal strength must overcome lingering February damage and prove itself amid this new ROI-focused regime. Current consolidation near psychologically critical 25,000 reflects tactical equilibrium between February recovery momentum and March uncertainty absorption.

═════════════════════════════════════════════════
Source: Macro Agent Desk (macroagentdesk.com)


