Nasdaq 100 (NQ) — Transition into March which historically shows stronger seasonal patterns for…
Cautiously defensive near-term given February AI spending volatility and seasonal weakness but acknowledging March seasonal strength ahead could provide recovery catalyst

Cautiously defensive near-term given February AI spending volatility and seasonal weakness but acknowledging March seasonal strength ahead could provide recovery catalyst
Recovery from extreme February AI spending volatility spike but fundamental concerns persist as hyperscalers plan $650B 2026 AI capex with continued ROI scrutiny
VXN volatility compression from February 8 extreme of 28-30 to current 26.37 indicating fear subsiding but remaining elevated at 70th percentile
February seasonal weakness historically showing only 60% positive hit rate with average gains below 1% creating headwinds versus stronger March patterns ahead
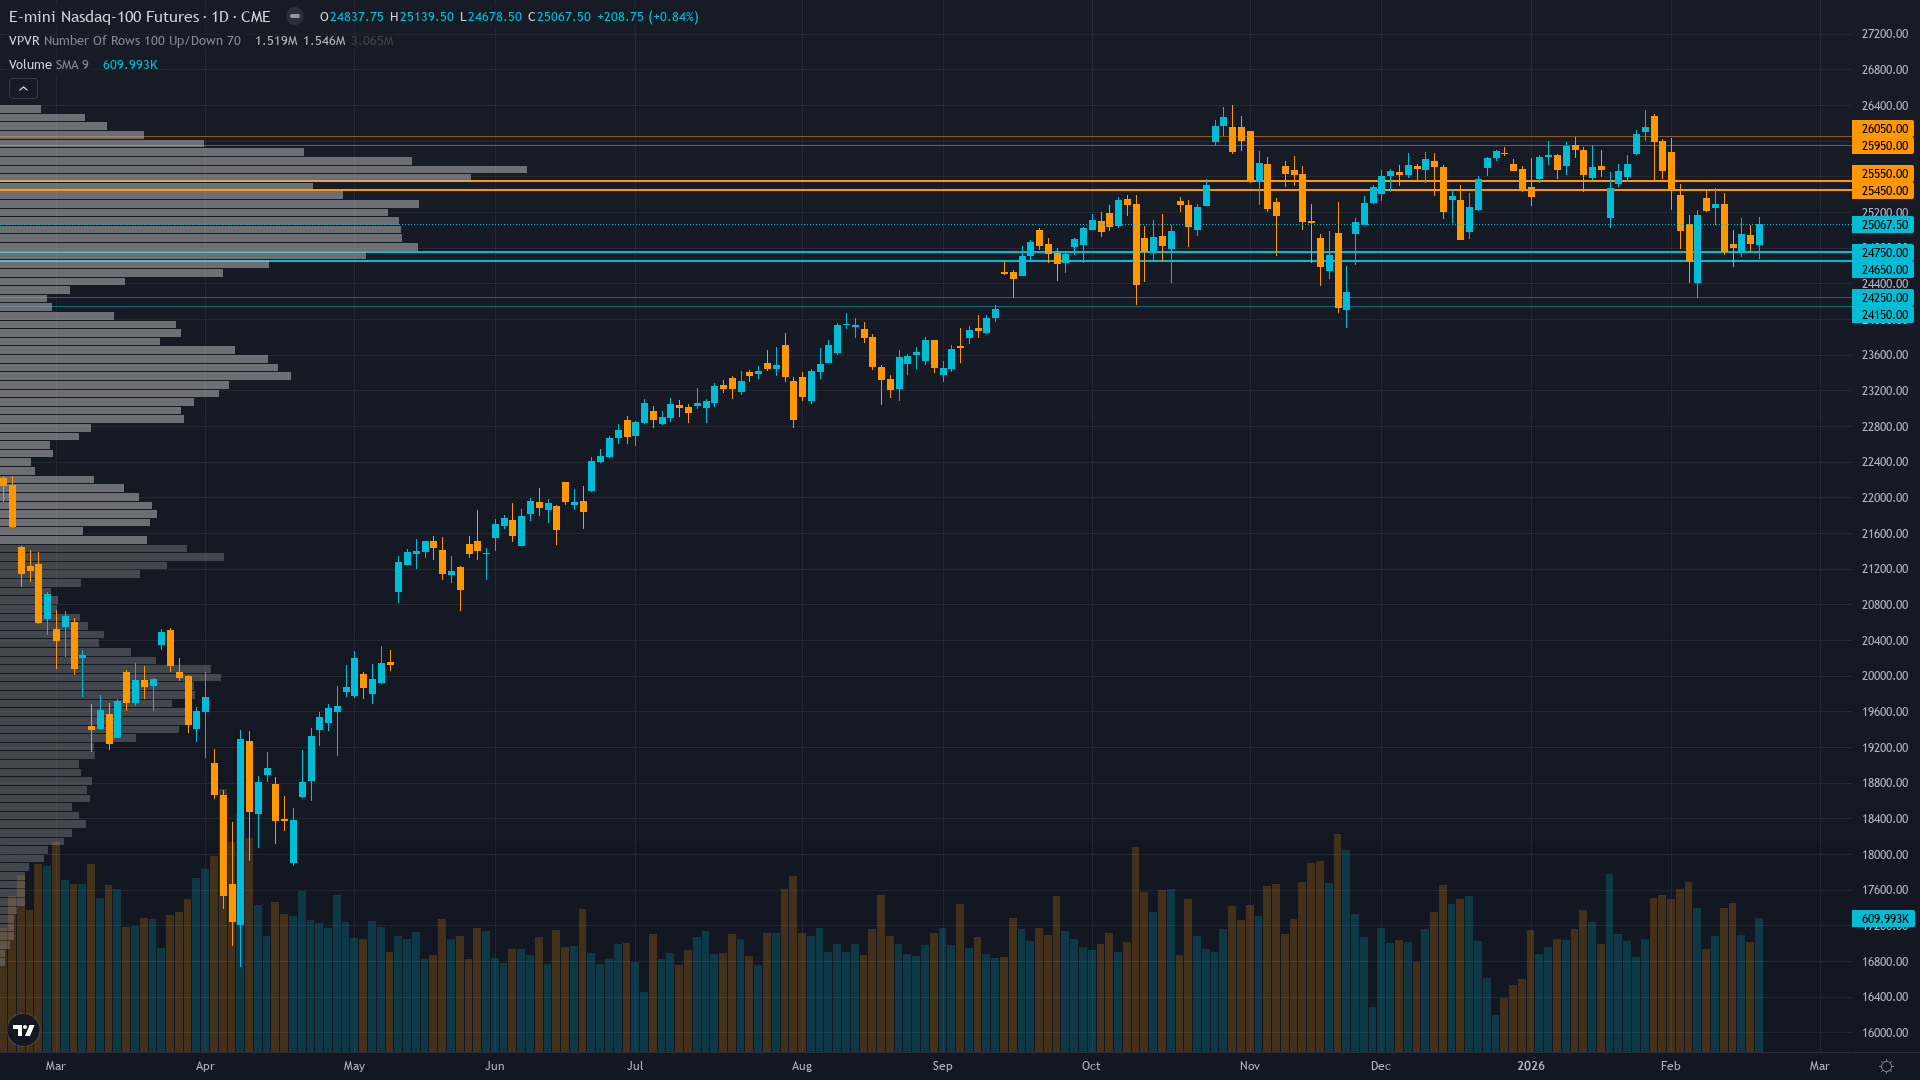
| ▲ Resistance Zone 2 | 25925 – 26075 |
| ▲ Resistance Zone 1 | 25425 – 25575 |
| ─ Pivot Area | ~25000 |
| ▼ Support Zone 1 | 24625 – 24775 |
| ▼ Support Zone 2 | 24125 – 24275 |
Recovering from February 15 breakdown at 24950 to current 25067, consolidating below psychologically critical 25500 resistance with deteriorating momentum
Tech fundamentals solid with Q4 +10-12% earnings growth expectations but facing existential scrutiny on $650B 2026 AI capex after software sector lost $1 trillion in value over 7-day February selloff
Cautiously constructive post-AI selloff with defensive hedging moderating as VXN compresses but elevated put demand persists reflecting residual concern
VXN at 26.37 elevated but compressing from February 8-15 spike to 28-30 range, sitting at 70th percentile indicating lingering caution despite mean reversion progress
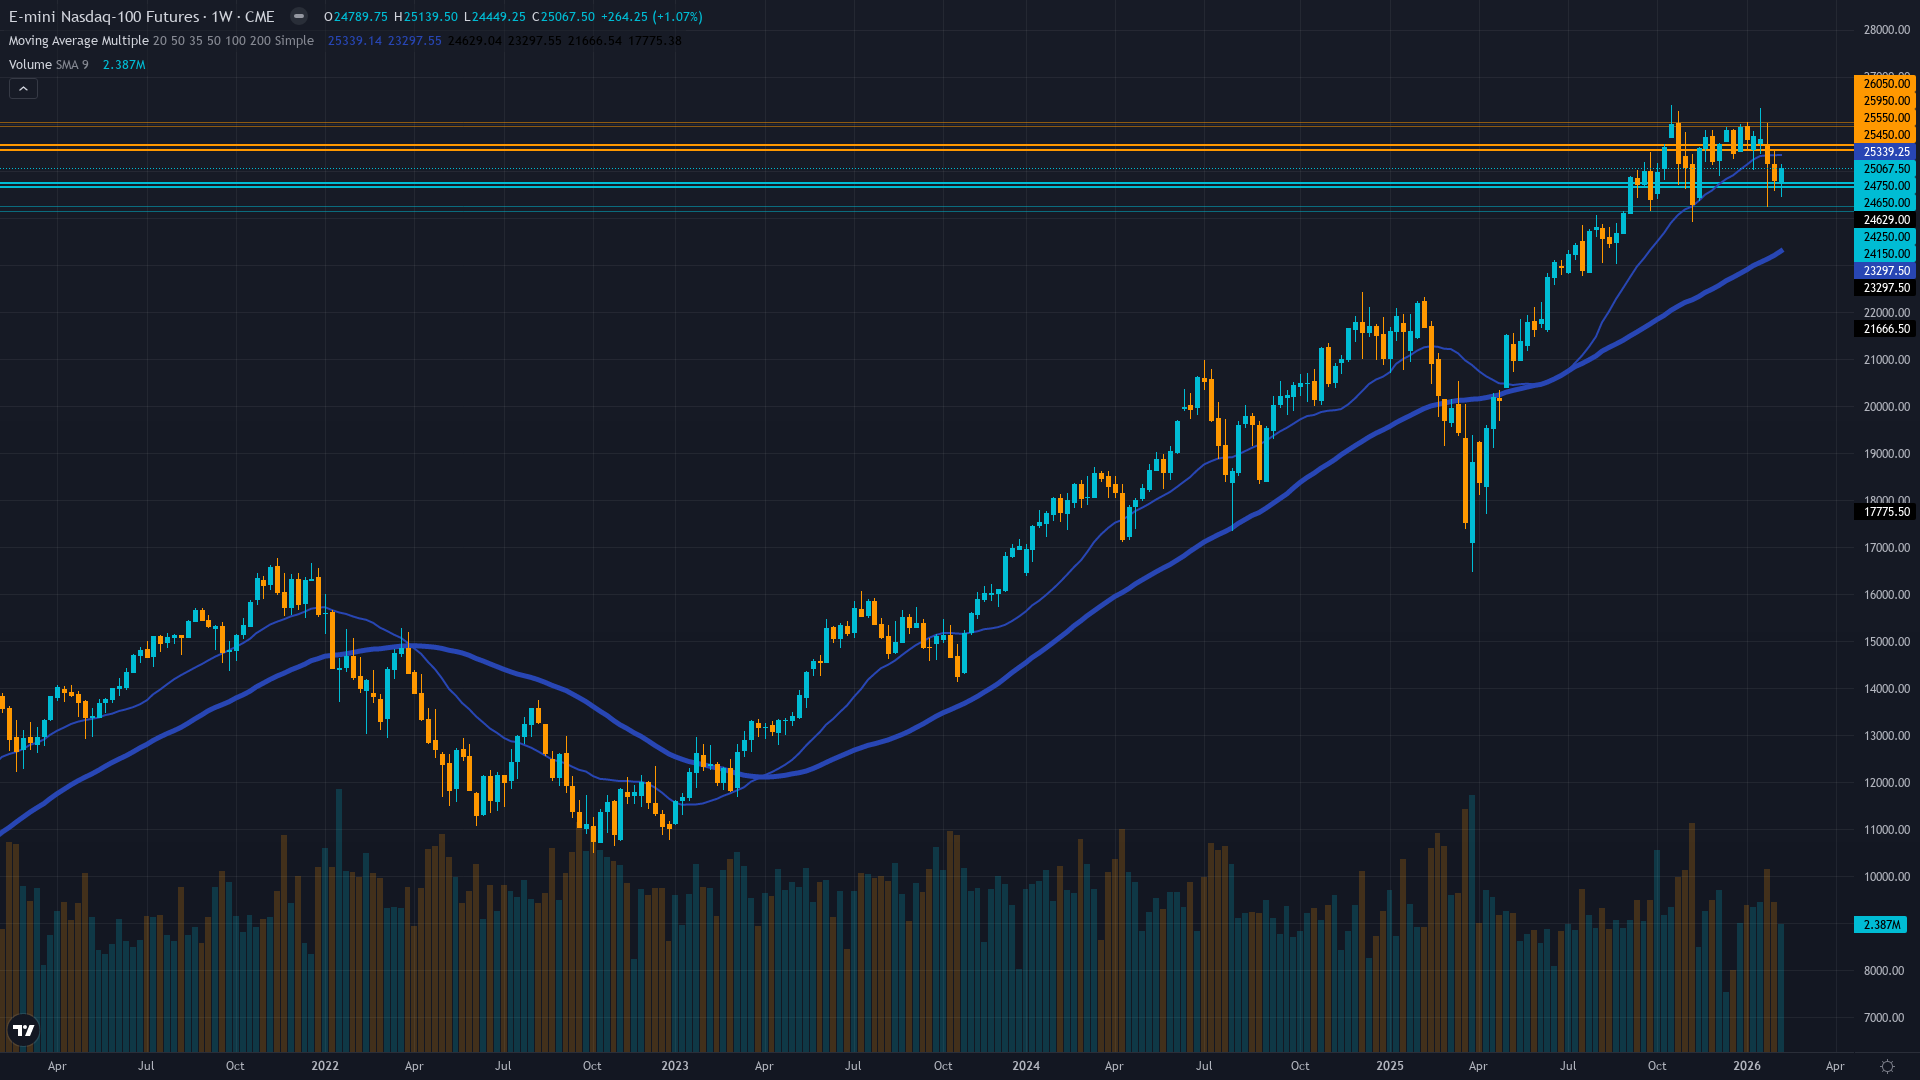
Fed funds at 3.5-3.75% after holding steady at January 28 meeting following three consecutive cuts, with market uncertainty about 2026 trajectory after only 2 cuts projected versus 4 previously expected
Normalizing - VXN compressing from February 8-15 extreme spike of 28-30 to current 26.37 as AI spending fears begin stabilizing though elevated versus normal
February volatility spikes above 70th percentile historically resolve within 7-14 trading days with 70% probability leading to March seasonal strength rather than sustained correction
Entered high regime 14 days ago on February 8; historically these spikes last 7-12 days before mean reversion with 65% probability of compression within 2 weeks suggesting late-stage normalization
Elevated volatility at 70th percentile suggests 1.3-1.7x normal daily ranges expected; expect 260-340 point daily swings versus normal 200-250 ranges as compression continues
Current elevated volatility suggests 8-11% monthly move potential versus normal 6-8%, creating risk of further downside toward 24200-24500 but also opportunity for recovery rally to 26000+ if March seasonality and AI concerns stabilization align
|
⚠️ Primary Risk
AI spending concerns reigniting as $650B 2026 capex commitments from hyperscalers face continued profitability scrutiny triggering retest of 24200-24500 major support Probability: MEDIUM
|
✦ Primary Opportunity
February seasonal weakness completing as March strength pattern historically reasserts with 70%+ hit rate driving recovery toward 26000-26500 if AI concerns stabilize Timeframe: Late February through March as seasonal patterns transition and volatility mean reversion completes
|
NQ consolidates at 25,067 on February 22, 2026, following one of the most volatile February periods in recent history as Big Tech's $650 billion 2026 AI spending plans triggered existential profitability questions that sent software stocks plunging $1 trillion in value over seven consecutive sessions from February 6-13. The index experienced a violent breakdown from the 25,689 consolidation zone on February 15, falling to 24,950 before recovering modestly as volatility begins normalizing. VXN spiked from normalized 19-21 levels to an extreme 28-30 range during the February 8-15 panic, reflecting acute institutional fear, but has now compressed to 26.37 indicating mean reversion is underway though elevated caution persists.
This volatility episode lasted 14+ days versus the typical 7-12 day window, suggesting markets underwent fundamental reassessment of AI spending sustainability rather than episodic panic. The immediate catalyst was Reuters reporting on February 6 that Big Tech's $600-650B spending plans exacerbated investors' AI headache, followed by February 5 news that U.S. software stocks lost $1 trillion as fast-advancing AI tools raised disruption fears. February seasonality provides significant headwinds, historically showing only 60% positive probability with average gains below 1%, ranking among Nasdaq-100's weaker months.
However, this creates tactical opportunity as March historically shows much stronger patterns with 70%+ positive hit rate and 2-3% average gains. The macro backdrop features Fed policy at 3.5-3.75% after the January 28 hold following three consecutive cuts, with significant uncertainty about 2026 trajectory after the Fed projects only 2 additional cuts versus 4 markets anticipated. From a bias integrity perspective, my previous week's BEARISH call with signal -1.8 and conviction 6 MISSED as the index moved UP +1.12% from Monday open 24,789.75 to Friday close 25,067.5.
This marks my second consecutive MISSED call on NQ (February 8 NO CALL also MISSED the -3.14% decline), starting a miss streak of 2. Per Section 7 Rule 3, I must apply confidence penalty of -2 for two consecutive misses. Additionally, applying EQUITY_INDEX category-specific override after missing calls: I'm reducing conviction by additional -1 point due to track record uncertainty. My effective conviction floor is now 5, and I cannot increase conviction while on a losing streak until recording a CORRECT call.
Given the current market state just recovering from extreme volatility with VXN still elevated at 26.37 (70th percentile), AI spending concerns persisting despite stabilization, and February seasonal weakness, I'm issuing NEUTRAL bias with reduced conviction. The expected weekly move around 1.5% exceeds the 0.75% Noise Floor for EQUITY_INDEX category, so directional bias is technically permissible, but given my miss streak and conflicting signals (recovery momentum versus persistent fundamental concerns), NEUTRAL is the appropriate defensive stance.
Devil's advocate: Bulls would argue the rapid VXN compression from 28-30 to 26.37 indicates the worst of AI fears have passed, February weakness is nearly complete with stronger March patterns ahead, and current consolidation near 25,000 provides attractive entry point for those targeting 26,000-26,500 recovery as volatility fully normalizes and seasonal patterns reassert their historically reliable trajectory.
| Week | Bias | Confidence | Result |
|---|---|---|---|
| February 21, 2026 | BEARISH | 6/10 | ❌ |
| February 13, 2026 | NO CALL | 6/10 | ➖ |
| February 8, 2026 | NO CALL | 6/10 | ➖ |
| February 1, 2026 | BULLISH | 7/10 | ❌ |
| January 25, 2026 | BULLISH | 7/10 | ✅ |
| January 11, 2026 | BULLISH | 7/10 | ❌ |
| January 4, 2026 | BULLISH | 7/10 | ✅ |
| December 28, 2025 | BULLISH | 7/10 | ❌ |
| December 21, 2025 | BULLISH | 7/10 | ✅ |
| December 14, 2025 | NO CALL | 7/10 | ➖ |
| December 7, 2025 | BULLISH | 8/10 | ❌ |
| November 30, 2025 | NO CALL | 7/10 | ➖ |


