Nasdaq 100 (NQ) — -1.8 between 24700 support and 25400 resistance with 6/10 confidence
Defensive and fearful near-term given violent AI spending concerns selloff but acknowledging oversold technicals and upcoming March seasonal strength could provide recovery catalyst

Defensive and fearful near-term given violent AI spending concerns selloff but acknowledging oversold technicals and upcoming March seasonal strength could provide recovery catalyst
Big Tech $600-650B AI spending ROI concerns triggering existential questions about profitability and massive sector-wide selloff
Volatility spike with VIX surging 18% to 20.82 and VXN elevated at 28-30 range indicating acute fear regime transition
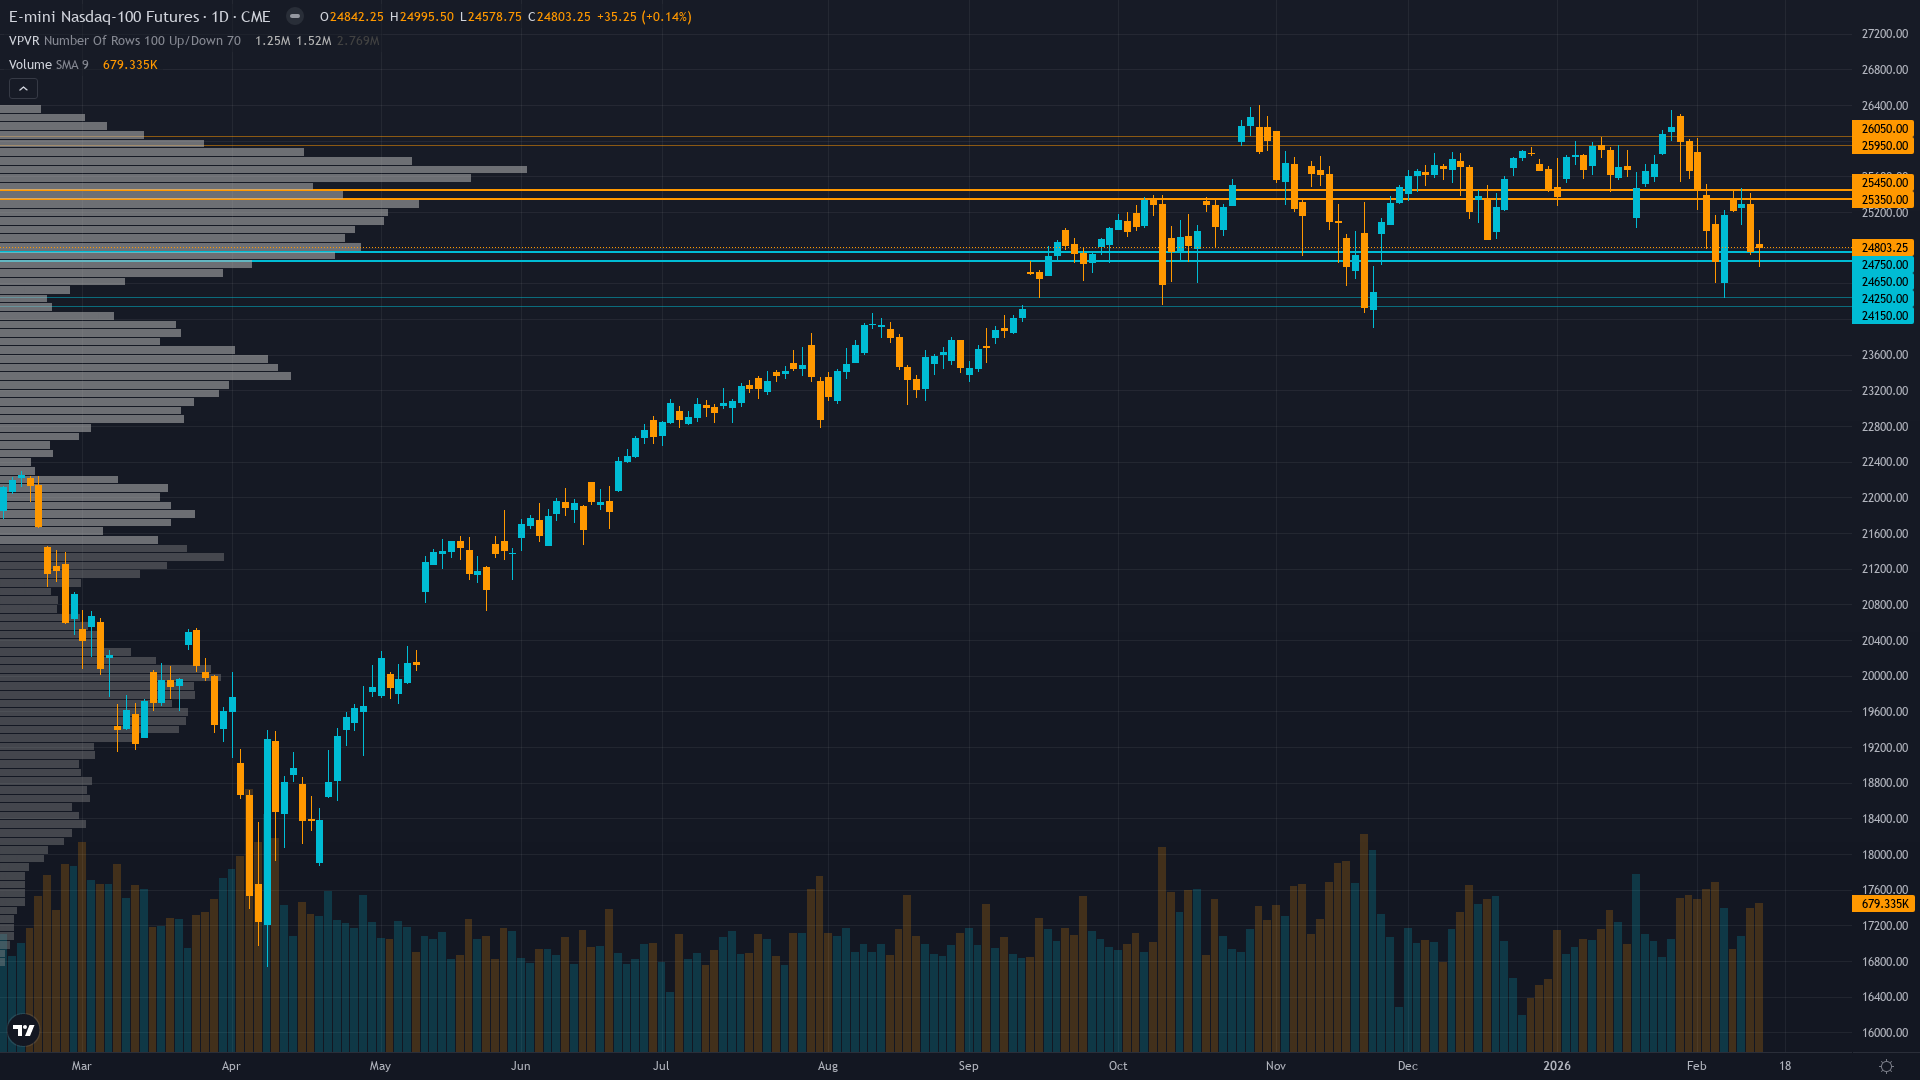
Technical breakdown below both 50-day MA (24,977) and 200-day MA (25,428) with RSI at 39 signaling oversold but deteriorating momentum
| ▲ Resistance Zone 2 | 25925 – 26075 |
| ▲ Resistance Zone 1 | 25325 – 25475 |
| ─ Pivot Area | ~24950 |
| ▼ Support Zone 1 | 24625 – 24775 |
| ▼ Support Zone 2 | 24125 – 24275 |
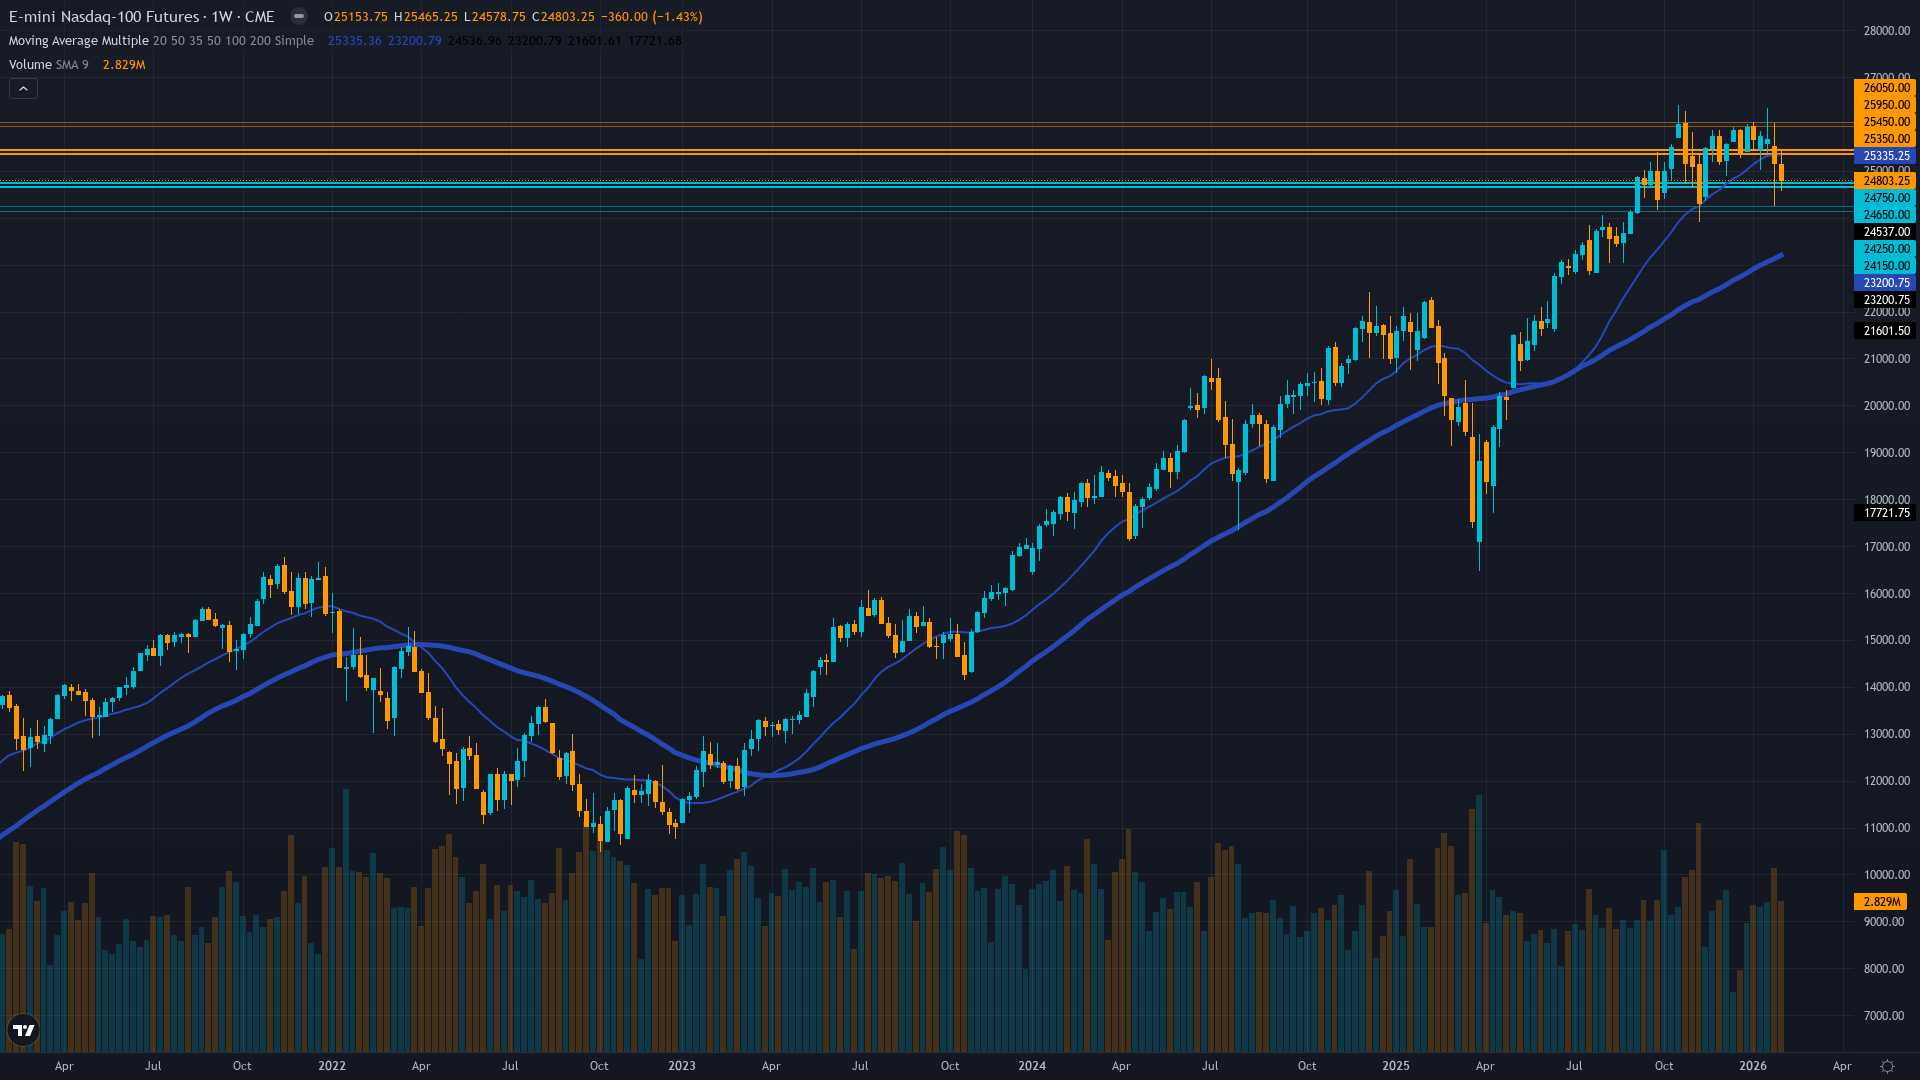
Broke decisively below 50-day MA (24,977) and 200-day MA (25,428) with strong sell signals; RSI 39 oversold but momentum deteriorating
Tech earnings growth solid at 10-12% but facing existential scrutiny as hyperscalers plan $600-650B 2026 AI capex with markets demanding clearer monetization evidence
Defensive with elevated hedging accelerating dramatically; software stocks lost $1 trillion over seven consecutive sessions as AI disruption fears compound
VXN elevated at 28-30 range versus normalized 19-21 levels just days ago; VIX surged 18% to 20.82 indicating institutional hedging accelerated dramatically
Fed delivered three consecutive cuts to 3.50-3.75% but hawkish 2026 trajectory projecting only 2 additional cuts versus 4 expected removes key tech valuation support
Inverted - short-term volatility spiking above longer-term averages indicating acute near-term stress from AI spending selloff
February volatility spikes above 75th percentile historically resolve within 7-14 days with 70% probability leading to March seasonal strength rather than sustained decline; current pattern on day 8-10 approaching typical resolution window
Entered high regime approximately 8 days ago following February 6-8 AI concerns; historically these spikes last 7-12 days before mean reversion with 65% probability of compression within 2 weeks suggesting mean reversion window opening
Elevated volatility at 78th percentile suggests 1.5-2.0x normal daily ranges expected requiring wider stops; expect 350-500 point daily swings versus normal 200-300 ranges; breakouts less reliable until compression begins likely in next 5-7 days
Current volatility spike suggests 10-14% monthly move potential versus normal 6-8% creating elevated risk of further downside toward 24,000-24,200 but also opportunity for violent reversal rally to 26,000+ if AI concerns stabilize and March seasonality asserts as VXN compression accelerates and historical mean reversion plays out
|
⚠️ Primary Risk
AI spending concerns intensifying into sustained tech sector correction as $600-650B capex plans face existential profitability questions triggering further selloff toward 24,000 Probability: HIGH
|
✦ Primary Opportunity
Oversold technical condition at RSI 39 combined with February seasonal weakness nearing completion sets up March recovery opportunity toward 26,000 if AI concerns stabilize Timeframe: Late February through March as seasonal patterns historically reverse and AI spending panic proves episodic rather than structural
|
NQ faces acute breakdown pressure on February 15, 2026, trading near 24,950 after experiencing violent rotation out of tech leadership as Big Tech's planned $600-650 billion AI spending for 2026 triggers existential questions about profitability and ROI. Reuters reports software and data services stocks have lost $1 trillion in value over seven consecutive sessions as investors worry fast-advancing AI tools could upend the sector entirely, with Anthropic's new capabilities crystallizing fears about sustainability of massive AI infrastructure buildouts.
The index has broken decisively below both the 50-day MA at 24,977 and 200-day MA at 25,428, confirming deteriorating technical structure with RSI at 39 indicating oversold conditions not seen since November's volatility spike. Volatility dynamics reveal the market's acute anxiety with VXN spiking from normalized 19-21 levels to the 28-30 range, while VIX surged 18% to 20.82 on February 13, sitting at approximately the 75th-80th percentile and indicating elevated caution though well below the November extreme of 32.72.
Historical context from November shows similar AI spending concerns that eventually resolved, but current episode appears more fundamental as markets demand clearer monetization paths. February seasonality presents significant headwinds, historically showing only 60% positive probability versus November-December's 80%+ hit rates, though this creates tactical opportunity as seasonal weakness typically reverses into March's much stronger patterns with 2-3% average gains and 70%+ positive hit rate. The macro backdrop features growing complexity following the Fed's three consecutive 25bp cuts to 3.50-3.75%, but the December hawkish shift revealing only 2 projected 2026 cuts versus 4 expected fundamentally altered the calculus, removing a key pillar that underpinned the late 2025 tech rally.
From fundamental perspective, the disconnect between tech's solid earnings growth trajectory (consensus at 10-12% for S&P 500 with tech maintaining leadership) and market's violent rejection of AI spending plans highlights regime shift underway—markets no longer willing to accept growth narratives without clear paths to profitability, particularly as collective hyperscaler commitment approaches $650 billion annually. Key technical levels define the battlefield: immediate support at 24,700 represents next line of defense with major support at 24,200 marking late 2025 consolidation base that must hold to prevent deeper correction, while resistance sits at 25,400 immediate and all-time high at 26,182 major.
The volatility intelligence reveals 8-12% monthly move potential versus normal 6-8%, creating both elevated risk of further downside toward 24,000 but also opportunity for violent reversal if catalysts emerge. Historical patterns show February volatility spikes typically resolve within 7-14 days with 70% probability of trend resumption, suggesting we're in early stages of this fear episode entering day 8-10. BIAS INTEGRITY: Previous week's NO CALL with Signal -0.5 MISSED the -3.14% decline, starting a miss streak of 1.
Current signal of -1.8 meets minimum threshold of 1.0 for directional bias. However, applying EQUITY_INDEX category-specific override after potential consecutive MISSED call (if this week also misses): reducing conviction by 1 point due to track record uncertainty. Volatility regime transition from normal to HIGH means I'm lowering effective Noise Floor by 0.20% (from 0.75% to 0.55%) per Section 5 rules, making directional calls more meaningful but capping confidence due to elevated uncertainty. The path forward hinges on whether AI spending concerns represent episodic panic similar to November that fully resolved, or structural reassessment leading to sustained correction.
February seasonal weakness provides headwind through month-end, but March historically shows much stronger patterns. The oversold technical condition at RSI 39 suggests limited further downside without stabilization, though support at 24,700-24,950 must hold to prevent further deterioration toward major support at 24,200. Given the acute nature of the breakdown, elevated volatility regime, and February seasonal headwinds, I'm issuing BEARISH bias with moderate conviction, acknowledging that oversold technicals and upcoming March seasonal strength could provide recovery catalyst if AI concerns moderate in coming 2-3 weeks.
| Week | Bias | Confidence | Result |
|---|---|---|---|
| February 8, 2026 | NO CALL | 6/10 | ➖ |
| February 1, 2026 | BULLISH | 7/10 | ❌ |
| January 25, 2026 | BULLISH | 7/10 | ✅ |
| January 11, 2026 | BULLISH | 7/10 | ❌ |
| January 4, 2026 | BULLISH | 7/10 | ✅ |
| December 28, 2025 | BULLISH | 7/10 | ❌ |
| December 21, 2025 | BULLISH | 7/10 | ✅ |
| December 14, 2025 | NO CALL | 7/10 | ➖ |
| December 7, 2025 | BULLISH | 8/10 | ❌ |
| November 30, 2025 | NO CALL | 7/10 | ➖ |
| November 23, 2025 | NO CALL | 7/10 | ➖ |


