Nasdaq 100 (NQ) — Big Tech $600B AI spending concerns triggering sector-wide selloff with tech…
Defensive and fearful near-term given violent AI spending concerns selloff, but acknowledging oversold technicals and upcoming March seasonal strength could provide recovery catalyst

Defensive and fearful near-term given violent AI spending concerns selloff, but acknowledging oversold technicals and upcoming March seasonal strength could provide recovery catalyst
Big Tech $600B AI spending concerns triggering sector-wide selloff with tech stocks down 1.4% amid ROI scrutiny and profitability questions
February seasonal weakness historically showing only 60% positive hit rate creating headwinds versus November-December strength patterns
Fed policy uncertainty with funds at 3.5-3.75% after three cuts but hawkish 2026 trajectory projecting only 2 additional cuts versus 4 expected
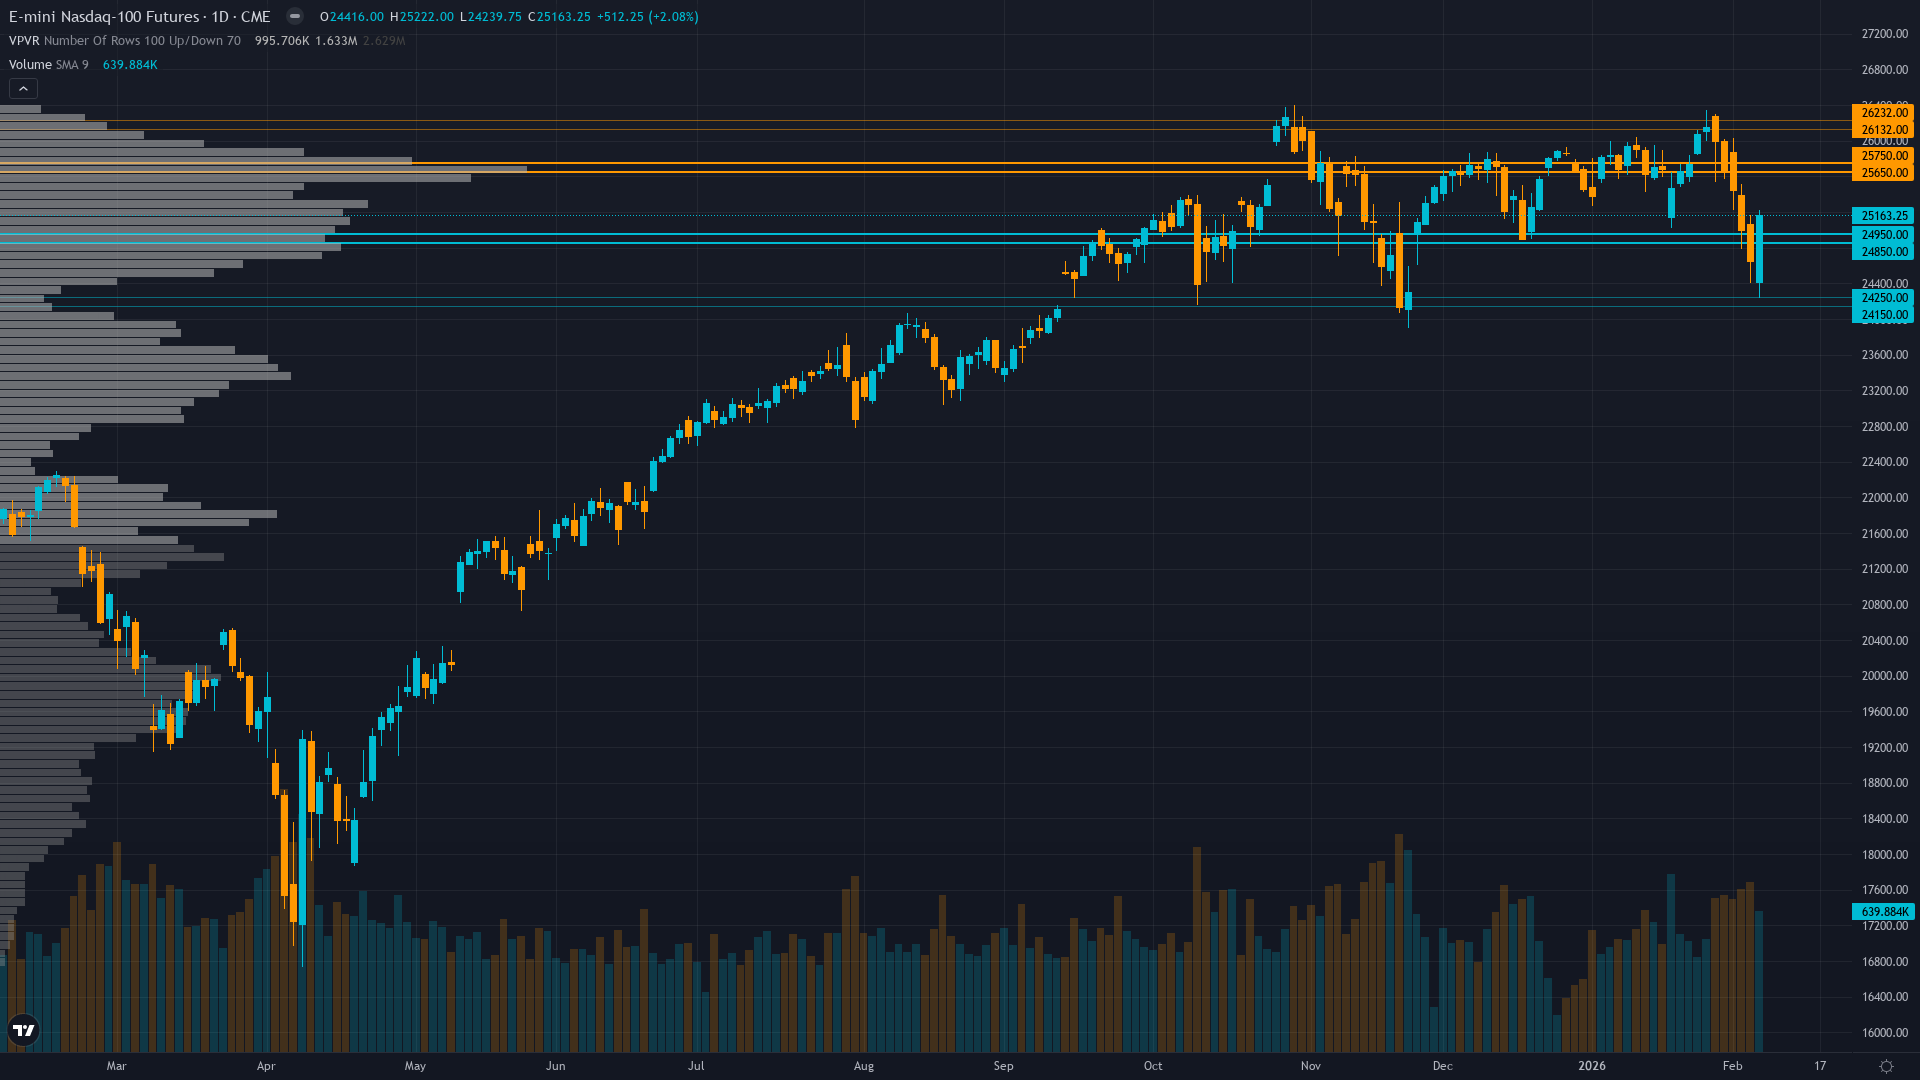
| ▲ Resistance Zone 2 | 26107 – 26257 |
| ▲ Resistance Zone 1 | 25625 – 25775 |
| ─ Pivot Area | ~25150 |
| ▼ Support Zone 1 | 24825 – 24975 |
| ▼ Support Zone 2 | 24125 – 24275 |
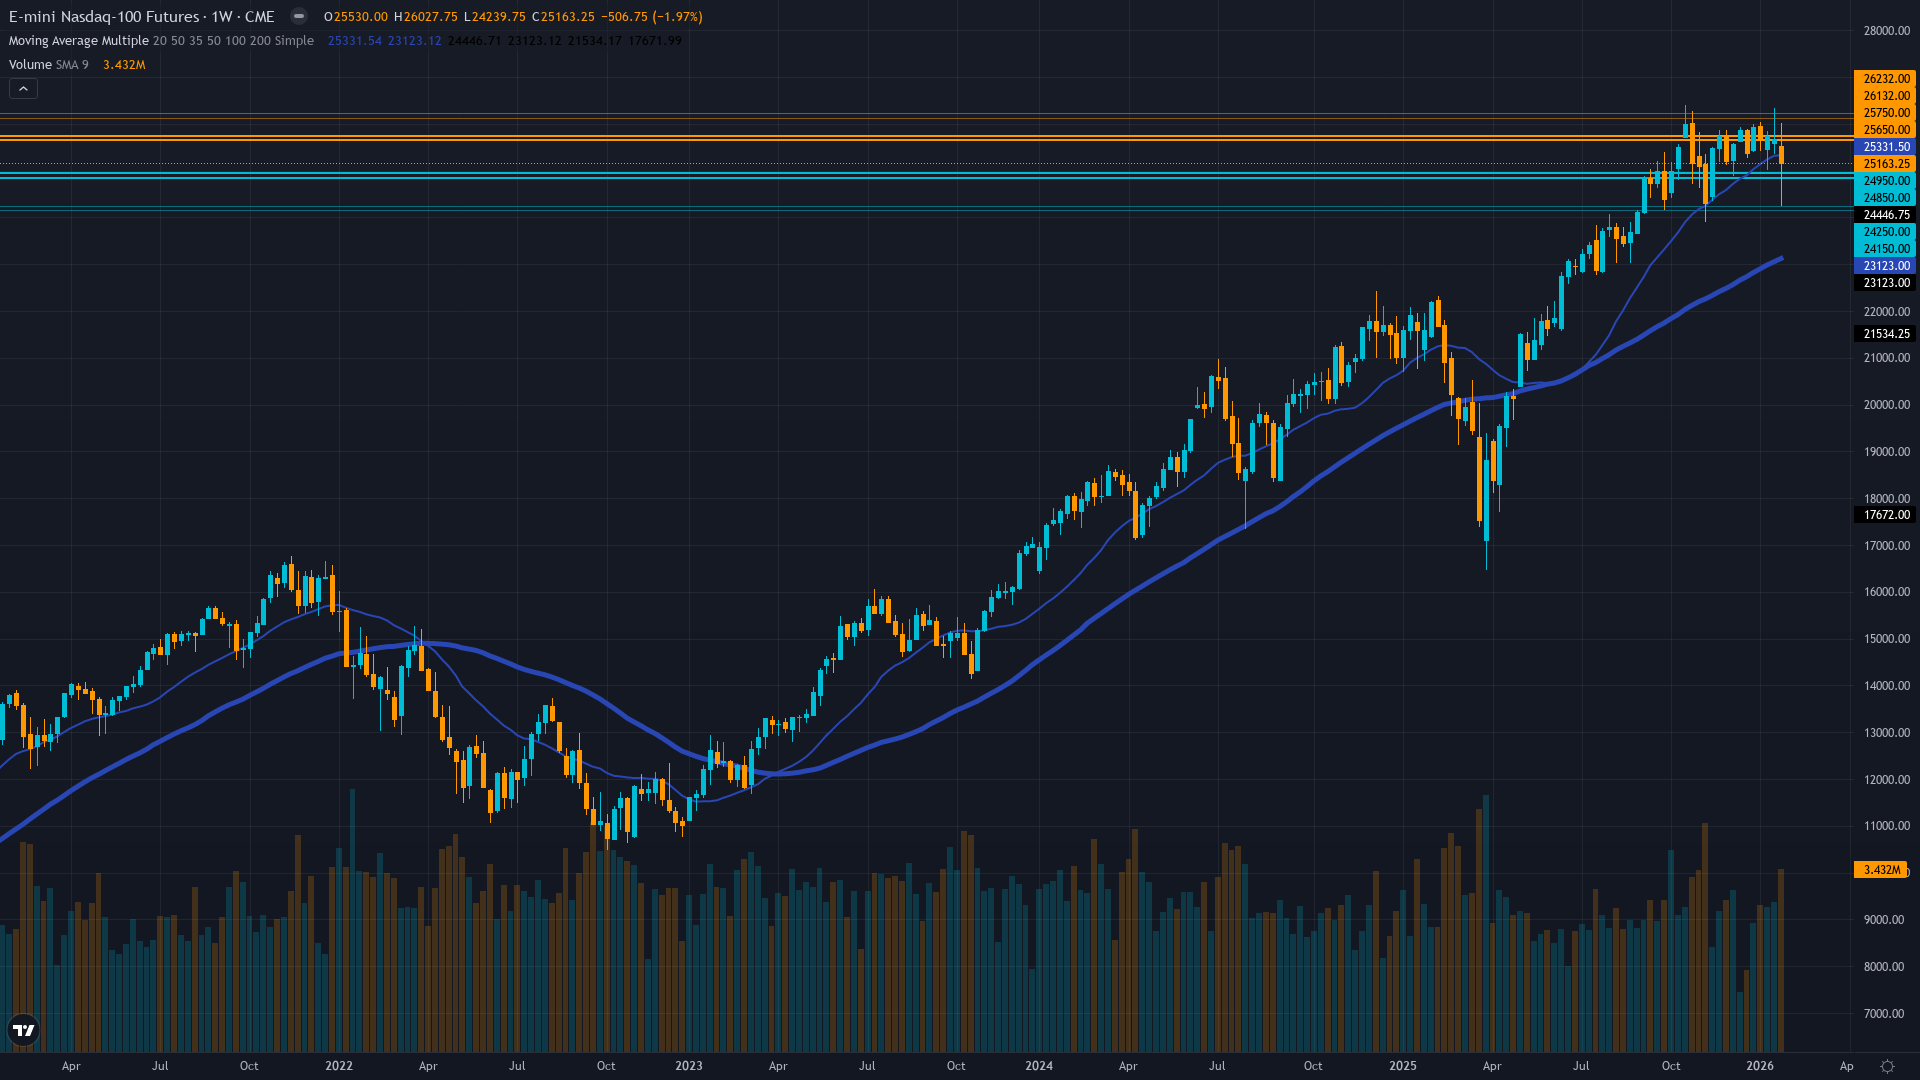
Breaking down from 25689 consolidation with RSI 34.3 oversold, trading below 50-day MA 25618 and 200-day MA 25553, strong sell signals dominating
Tech earnings growth solid at 13% but facing intense scrutiny as hyperscalers plan $600B 2026 AI capex with markets demanding clearer monetization evidence
Defensive with elevated hedging as software stocks lose $1 trillion in week on AI disruption fears while tech sector faces existential ROI questions
VIX elevated at 18.64 reflecting heightened uncertainty, VXN at 28-30 range indicating acute fear in tech sector with defensive positioning accelerating
Fed delivered three consecutive cuts to 3.5-3.75% but December hawkish shift to only 2 projected 2026 cuts removes key tech valuation support pillar
Inverted - short-term volatility spiking above longer-term averages indicating acute near-term stress from AI spending selloff
February volatility spikes above 75th percentile historically resolve within 7-14 days with 70% probability leading to March seasonal strength rather than sustained decline
Just entered high regime on February 6-7 AI concerns; historically these spikes last 7-12 days before mean reversion with 65% probability of compression within 2 weeks
Elevated volatility at 78th percentile suggests 1.5-2.0x normal daily ranges expected requiring wider stops; expect 350-500 point daily swings versus normal 200-300 ranges
Current volatility spike suggests 8-12% monthly move potential creating risk of further downside toward 24000-24200 but also opportunity for violent reversal rally to 26000+ if AI concerns stabilize and March seasonality asserts
|
⚠️ Primary Risk
AI spending concerns intensifying into sustained tech sector correction as $600B capex plans face existential profitability questions triggering further selloff toward 24000 Probability: HIGH
|
✦ Primary Opportunity
Oversold technical condition at RSI 34 combined with February seasonal weakness nearing completion sets up March recovery opportunity toward 26000-26500 if AI concerns stabilize Timeframe: Late February through March as seasonal patterns historically reverse and Q4 earnings digestion completes
|
NQ faces acute pressure on February 8, 2026, trading at 25,163 after experiencing violent rotation out of tech leadership as Big Tech's planned $600 billion AI spending splurge for 2026 triggers existential questions about profitability and ROI. Reuters reports software and data services stocks have lost $1 trillion in value over seven consecutive sessions as investors worry fast-advancing AI tools could upend the sector entirely. The index opened at 24,416 and ranged from 24,240 to 25,222 today, showing extreme intraday volatility characteristic of fear-driven markets.
This represents a dramatic breakdown from the 25,689 consolidation level maintained through late January and early February, with technical indicators flashing strong sell signals across the board. The 14-day RSI at 34.3 indicates oversold conditions not seen since the November volatility spike, while the index trades decisively below both the 50-day MA at 25,618 and 200-day MA at 25,553, confirming deteriorating technical structure. Alphabet's announcement of up to $185 billion in 2026 capex crystallized fears about the sustainability of massive AI infrastructure buildouts, with markets demanding clearer evidence that hyperscalers can monetize their investments.
The VXN volatility index spiked to the 28-30 range, elevated significantly from the normalized 19-21 levels seen just days ago, indicating institutional hedging has accelerated dramatically. This volatility spike sits at approximately the 75th-80th percentile of the 90-day range, though well below the November extreme of 32.72, suggesting acute concern without full panic capitulation. Historical context reveals February as one of Nasdaq-100's weaker months with only 60% positive probability and average gains of just 0.5-1%, ranking among the least favorable seasonal periods.
This stands in stark contrast to the November-December strength that characterized late 2025, where the index achieved a 22% annual gain and approached the November 2 all-time high of 26,182. The current price of 25,163 sits 3.9% below that peak, but more critically represents a 2.1% decline from the recent 25,689 consolidation base. From a fundamental perspective, the disconnect between tech's solid earnings growth trajectory (Q4 consensus at 13% for S&P 500, with tech maintaining leadership) and the market's violent rejection of AI spending plans highlights the regime shift underway.
Markets are no longer willing to accept growth narratives without clear paths to profitability, particularly as the collective hyperscaler commitment approaches $600 billion annually. The macro backdrop features growing complexity following the Fed's delivery of three consecutive 25bp cuts to 3.5-3.75%, which should theoretically support tech valuations through lower discount rates. However, the December 18 FOMC hawkish shift revealing only 2 projected 2026 cuts versus the 4 markets had anticipated fundamentally altered the calculus.
This slower easing trajectory removes a key pillar that underpinned the late 2025 tech rally, with higher-for-longer rates increasing pressure on duration-sensitive growth assets already trading at elevated valuations near 30x forward P/E. Institutional positioning reflects defensive posture with elevated hedging evident in options markets, though the historical data from Google Sheets shows this represents a significant shift from the cautiously constructive stance maintained through January. The transition from Signal 1.5 with Conviction 7 on February 1 to current deteriorated conditions illustrates the speed and violence of this rotation.
Key technical levels define the battlefield ahead: immediate support at 24,900 represents the next line of defense, with major support at 24,200 marking the late 2025 consolidation base that must hold to prevent deeper correction. Resistance sits at 25,700 immediate and the all-time high at 26,182 major, though reclaiming these levels requires fundamental catalyst that markets currently lack. The volatility intelligence reveals important market state information: the spike from normalized conditions to current elevated levels suggests 8-12% monthly move potential versus normal 6-8%, creating both elevated risk of further downside toward 24,000 but also opportunity for violent reversal if catalysts emerge.
Historical patterns show February volatility spikes typically resolve within 7-14 days with 70% probability of trend resumption, suggesting we're in early stages of this fear episode. Looking forward, the path hinges on whether AI spending concerns represent episodic panic similar to November's volatility spike that fully resolved, or structural reassessment that leads to sustained correction. The February seasonal weakness provides headwind through month-end, but March historically shows much stronger patterns with 2-3% average gains and 70%+ positive hit rate.
The oversold technical condition at RSI 34 suggests limited further downside without stabilization, creating tactical opportunity for patient positioning targeting the 26,000-26,500 recovery zone if AI concerns moderate and March seasonal strength asserts.
| Week | Bias | Confidence |
|---|---|---|
| February 8, 2026 | BEARISH | 6/10 |
| February 1, 2026 | BULLISH | 7/10 |
| January 25, 2026 | BULLISH | 7/10 |
| January 18, 2026 | BULLISH | 7/10 |
| January 11, 2026 | BULLISH | 7/10 |
| January 4, 2026 | NEUTRAL | 7/10 |
| December 28, 2025 | BULLISH | 7/10 |
| December 21, 2025 | BULLISH | 7/10 |
| December 14, 2025 | NEUTRAL | 7/10 |
| December 7, 2025 | BULLISH | 8/10 |
| November 30, 2025 | NEUTRAL | 7/10 |
| November 23, 2025 | NEUTRAL | 7/10 |


