Nasdaq 100 (NQ) — Q4 2025 earnings season expectations with Magnificent Seven reporting this week…
Cautiously constructive on tech fundamentals and 2026 AI spending outlook but wary of February seasonal weakness and slower Fed easing trajectory creating near-term headwinds requiring earnings validation

Cautiously constructive on tech fundamentals and 2026 AI spending outlook but wary of February seasonal weakness and slower Fed easing trajectory creating near-term headwinds requiring earnings validation
Q4 2025 earnings season expectations with Magnificent Seven reporting this week amid elevated AI infrastructure spending scrutiny at $500B annual commitment levels
January FOMC pause at 3.5-3.75% maintaining Fed easing cycle uncertainty with only 2 cuts projected for 2026 versus 4 previously expected
February seasonality historically weak for Nasdaq-100 with approximately 60% positive hit rate creating headwinds versus November-December strength patterns
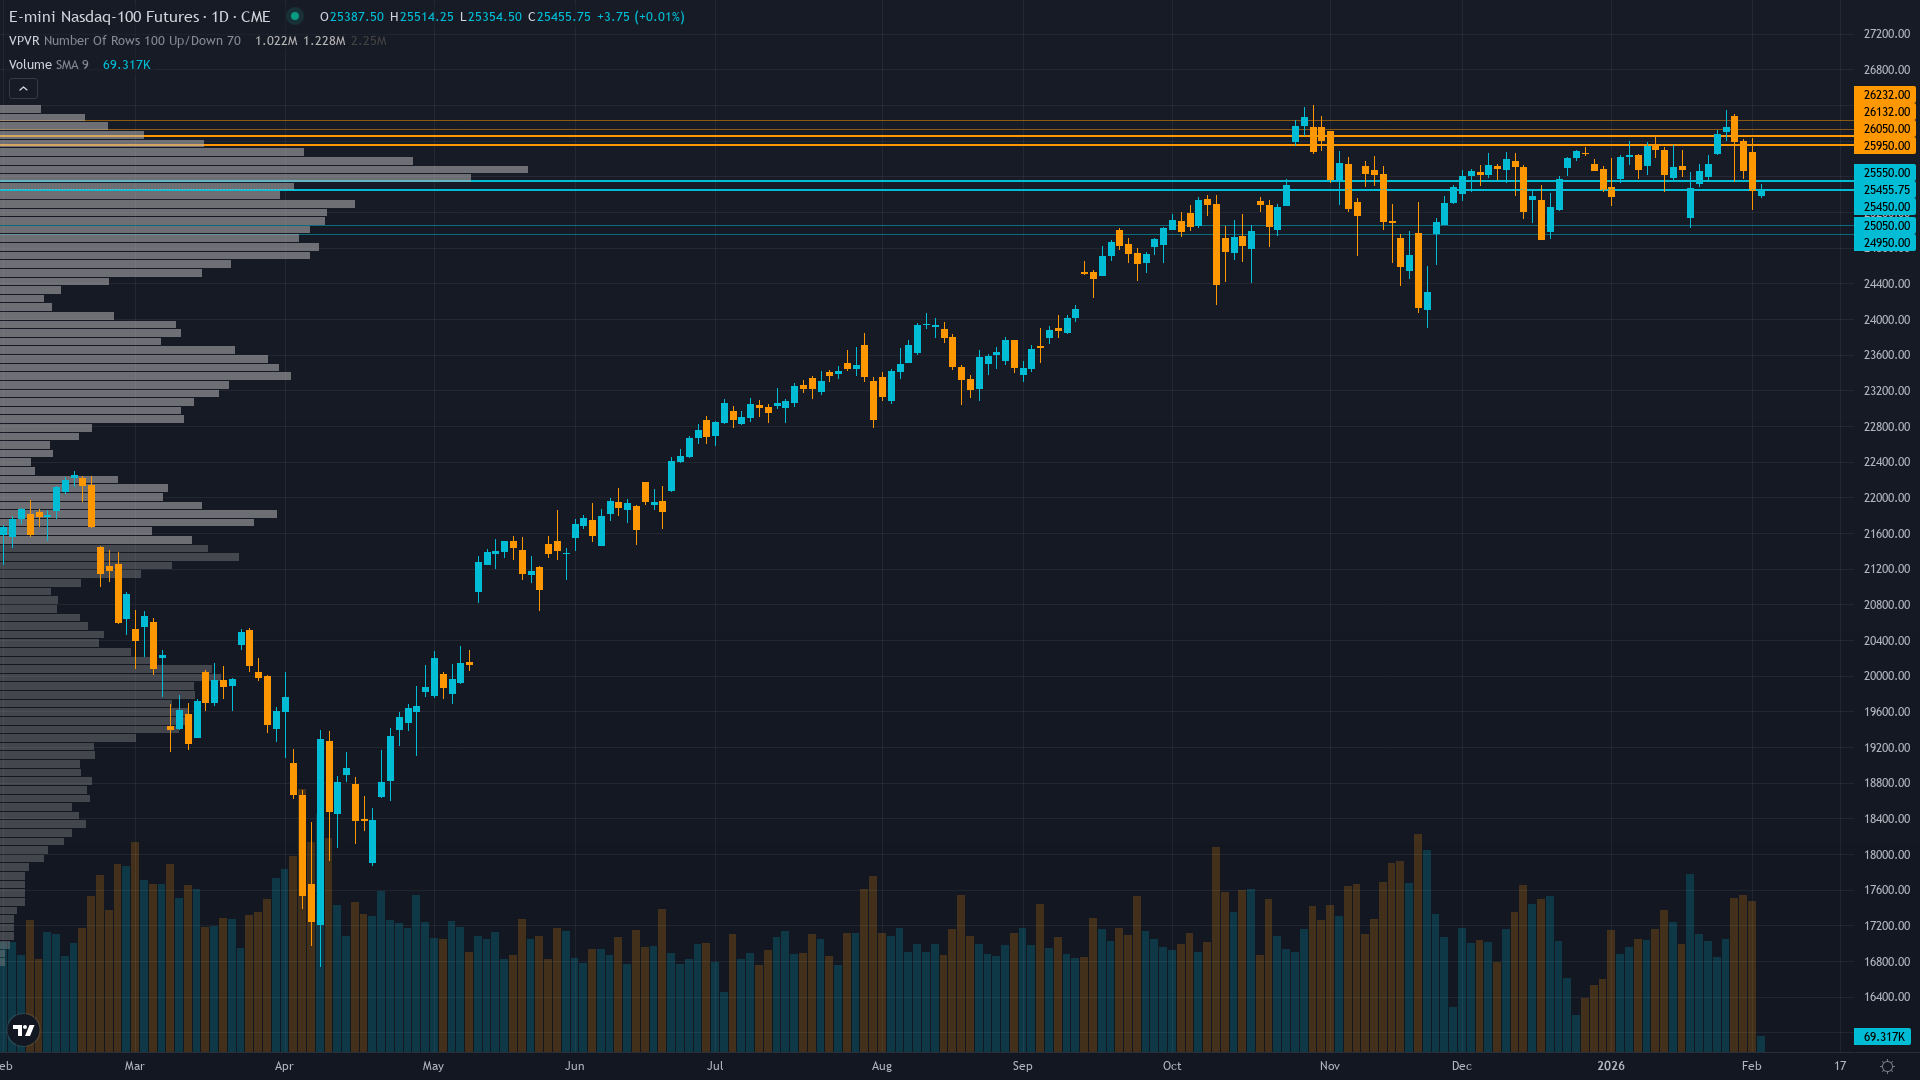
| ▲ Resistance Zone 2 | 26107 – 26257 |
| ▲ Resistance Zone 1 | 25925 – 26075 |
| ─ Pivot Area | ~25700 |
| ▼ Support Zone 1 | 25425 – 25575 |
| ▼ Support Zone 2 | 24925 – 25075 |
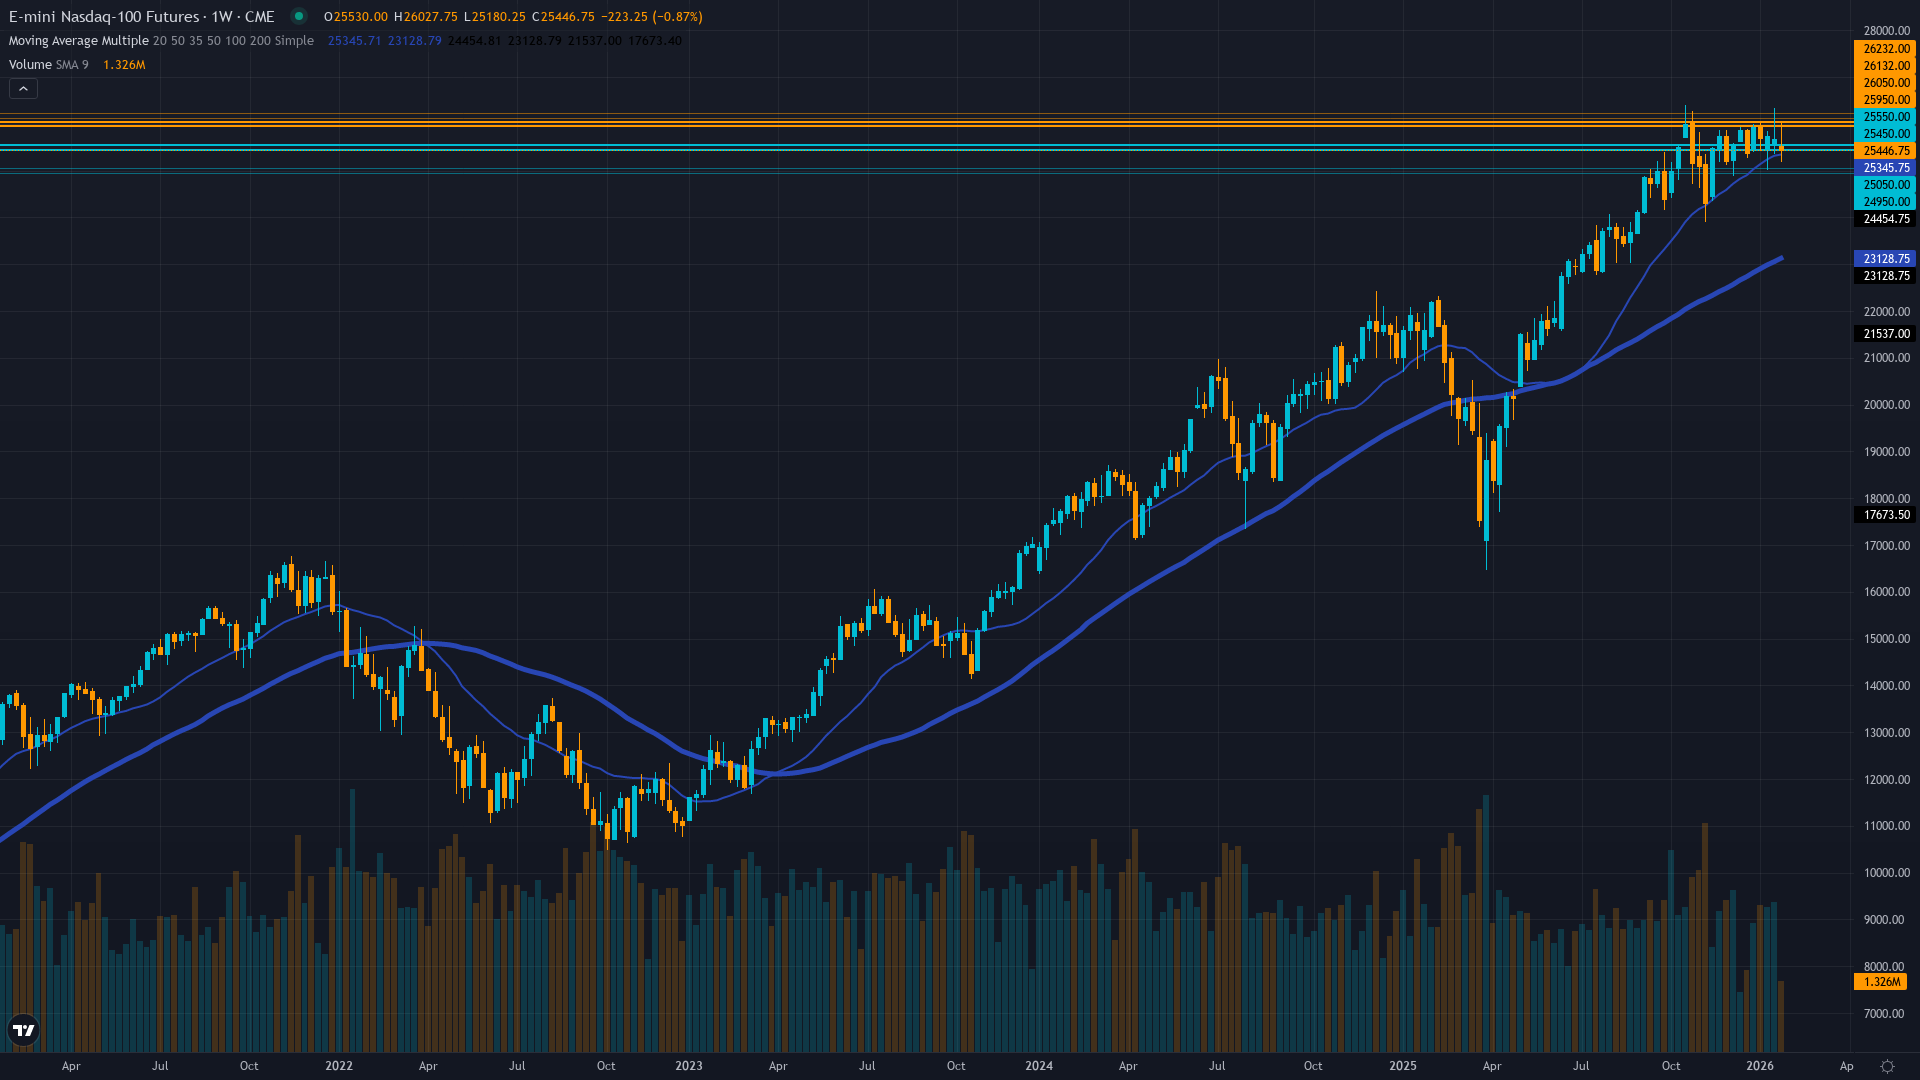
Consolidating just 1.9% below November 2 all-time high at 26182, holding above all major moving averages (50-day 25644, 200-day 25475) with RSI 48.6 indicating neutral momentum
Tech fundamentals solid with Q4 expectations of +17.3% earnings growth and +16.5% revenue gains for Magnificent Seven, but facing intense scrutiny on $500B 2026 AI capex sustainability
Balanced post-year-end with window dressing complete, cautiously constructive but awaiting Q4 earnings validation on AI spending ROI at elevated tech valuations near 30x forward PE
VXN at 19-20 range fully normalized from November extreme of 32.72, sitting at 50th percentile indicating balanced risk/reward with defensive positioning moderated significantly from Q4 levels
Fed funds at 3.5-3.75% after three consecutive cuts with January 28 FOMC holding steady, projecting only 2 additional 2026 cuts versus 4 expected creating policy uncertainty for tech valuations
Normal - fully normalized post-December year-end compression with term structure flat as short-term matches longer-term averages indicating stable market conditions ideal for trend following
November volatility spikes above 80th percentile historically resolve within 7-14 trading days with 75% probability leading to seasonal strength resumption; current day 80+ post-spike confirms complete resolution with typical February pattern showing stable conditions
November-December extreme regime fully resolved with VXN compression from 32.72 to 19-20 representing 40% decline; mean reversion cycle complete with 75% probability of sustained normalization through Q1 absent major catalysts
Normal volatility regime at 50th percentile supports standard position sizing and reliable technical signals; expect daily ranges of 200-300 points typical for stable periods versus November's 400-550 point extreme swings; breakouts above 26000 resistance more sustainable in current normalized environment
Current normalized volatility at 50th percentile suggests 6-8% monthly move potential versus November's 10-14% extreme regime; favoring grind-higher scenario with Q4 earnings catalysts rather than volatile breakout, positioning for steady accumulation pattern typical of earnings-driven advances toward 26500-27000 targets
|
⚠️ Primary Risk
Q4 earnings disappoint on AI infrastructure ROI concerns triggering correction toward 25000-24500 major support as stretched valuations near 30x forward PE unwind if guidance suggests 2026 capex moderation Probability: MEDIUM
|
✦ Primary Opportunity
February consolidation sets up spring rally if Q4 earnings validate AI spending thesis and Fed maintains accommodative stance, with seasonal tailwinds returning in March-April historically strongest period Timeframe: Mid-February through March as earnings clarity emerges and February seasonal weakness historically reverses into stronger spring patterns
|
NQ enters February 2026 trading at 25,689 positioned just 1.9% below the November 2 all-time high of 26,182, having successfully navigated the volatile final quarter of 2025 that saw dramatic swings from AI infrastructure spending concerns in November (VXN spike to 32.72) to year-end recovery. The index now faces a critical inflection point as Q4 2025 earnings season begins this week, with the Magnificent Seven facing elevated expectations around AI monetization on their projected $500 billion in 2026 AI capex commitments.
The technical structure remains constructively bullish above all major moving averages, though momentum has moderated with RSI at 48.6 suggesting neutral positioning entering the earnings window. Volatility has fully normalized from December extremes, with VXN at 19-20 sitting at the 50th percentile, indicating fear has completely dissipated and markets have absorbed the AI spending scrutiny that plagued late 2025. The macro backdrop features significant uncertainty following the January 28 FOMC decision to hold rates steady at 3.5-3.75%, with the December dot plot revealing a hawkish shift to only 2 projected 2026 cuts versus the 4 that markets had anticipated through most of Q4 2025.
This removes a key pillar supporting tech valuations as higher-for-longer rates increase discount rates for duration-sensitive growth assets. February seasonality presents headwinds, historically showing only 60% positive probability versus November-December's exceptional 80%+ hit rates, though this creates tactical opportunity as seasonal weakness typically reverses by mid-month when earnings catalysts emerge. The fundamental backdrop for tech remains relatively solid with Q4 consensus expecting +17.3% earnings growth and +16.5% revenue gains for the Magnificent Seven, maintaining the growth leadership that characterized 2025.
However, forward PE ratios near 30x face pressure if rate cut expectations continue diminishing or if earnings guidance suggests moderation in the AI infrastructure buildout. Key catalysts include the ongoing Q4 earnings reports this week from mega-cap constituents that will determine whether current $500B+ AI capex commitments can be sustained and demonstrate improving unit economics. The path forward likely hinges on whether powerful fundamental backdrop—solid earnings growth, continued AI infrastructure investment, normalized volatility—can overcome the confluence of seasonal headwinds, slower Fed easing trajectory, and elevated valuation scrutiny.
Current consolidation at 25,689 reflects tactical equilibrium between 2025 recovery completion and 2026 uncertainty absorption, with clearly defined support at 25500 immediate and 25000 major providing risk parameters for disciplined positioning into the historically important earnings catalyst window.
| Week | Bias | Confidence |
|---|---|---|
| February 1, 2026 | BULLISH | 7/10 |
| January 25, 2026 | BULLISH | 7/10 |
| January 18, 2026 | BULLISH | 7/10 |
| January 11, 2026 | BULLISH | 7/10 |
| January 4, 2026 | NEUTRAL | 7/10 |
| December 28, 2025 | BULLISH | 7/10 |
| December 21, 2025 | BULLISH | 7/10 |
| December 14, 2025 | NEUTRAL | 7/10 |
| December 7, 2025 | BULLISH | 8/10 |
| November 30, 2025 | NEUTRAL | 7/10 |
| November 23, 2025 | NEUTRAL | 7/10 |
| November 16, 2025 | NEUTRAL | 7/10 |


