Market Of The Week: ★Silver (SI)★ Federal Reserve April 29-30 FOMC meeting expected to hold rates unchanged at…
Silver (SI): Market treating Silver Institute April 15 deficit confirmation (46M oz expanding 15% to sixth consecutive year) as incremental data point rather than validation of structural regime change, while desk recognizes combination of sixth-year deficit with permanent 59% industrial demand shif

Market consensus fractured between structural bulls targeting $85-95 recovery by Q2 on intact sixth-year deficit fundamentals confirmed April 15 and cautious neutrals awaiting April 29 Fed clarity, CoinCodex algorithm predicting +12.96% to $88.92 by April 23 suggests modest bullish lean emerging while J.P. Morgan February forecast of $81/oz average for 2026 already achieved
Silver Institute World Silver Survey 2026 released April 15 confirms sixth consecutive year of structural deficit expanding to 46 million ounces (15% increase from 2025), with industrial demand consuming record 59% of supply from solar/EV/AI sectors creating fundamental scarcity while price at $81.84 trades 30-45% below fundamental fair value estimates of $113+
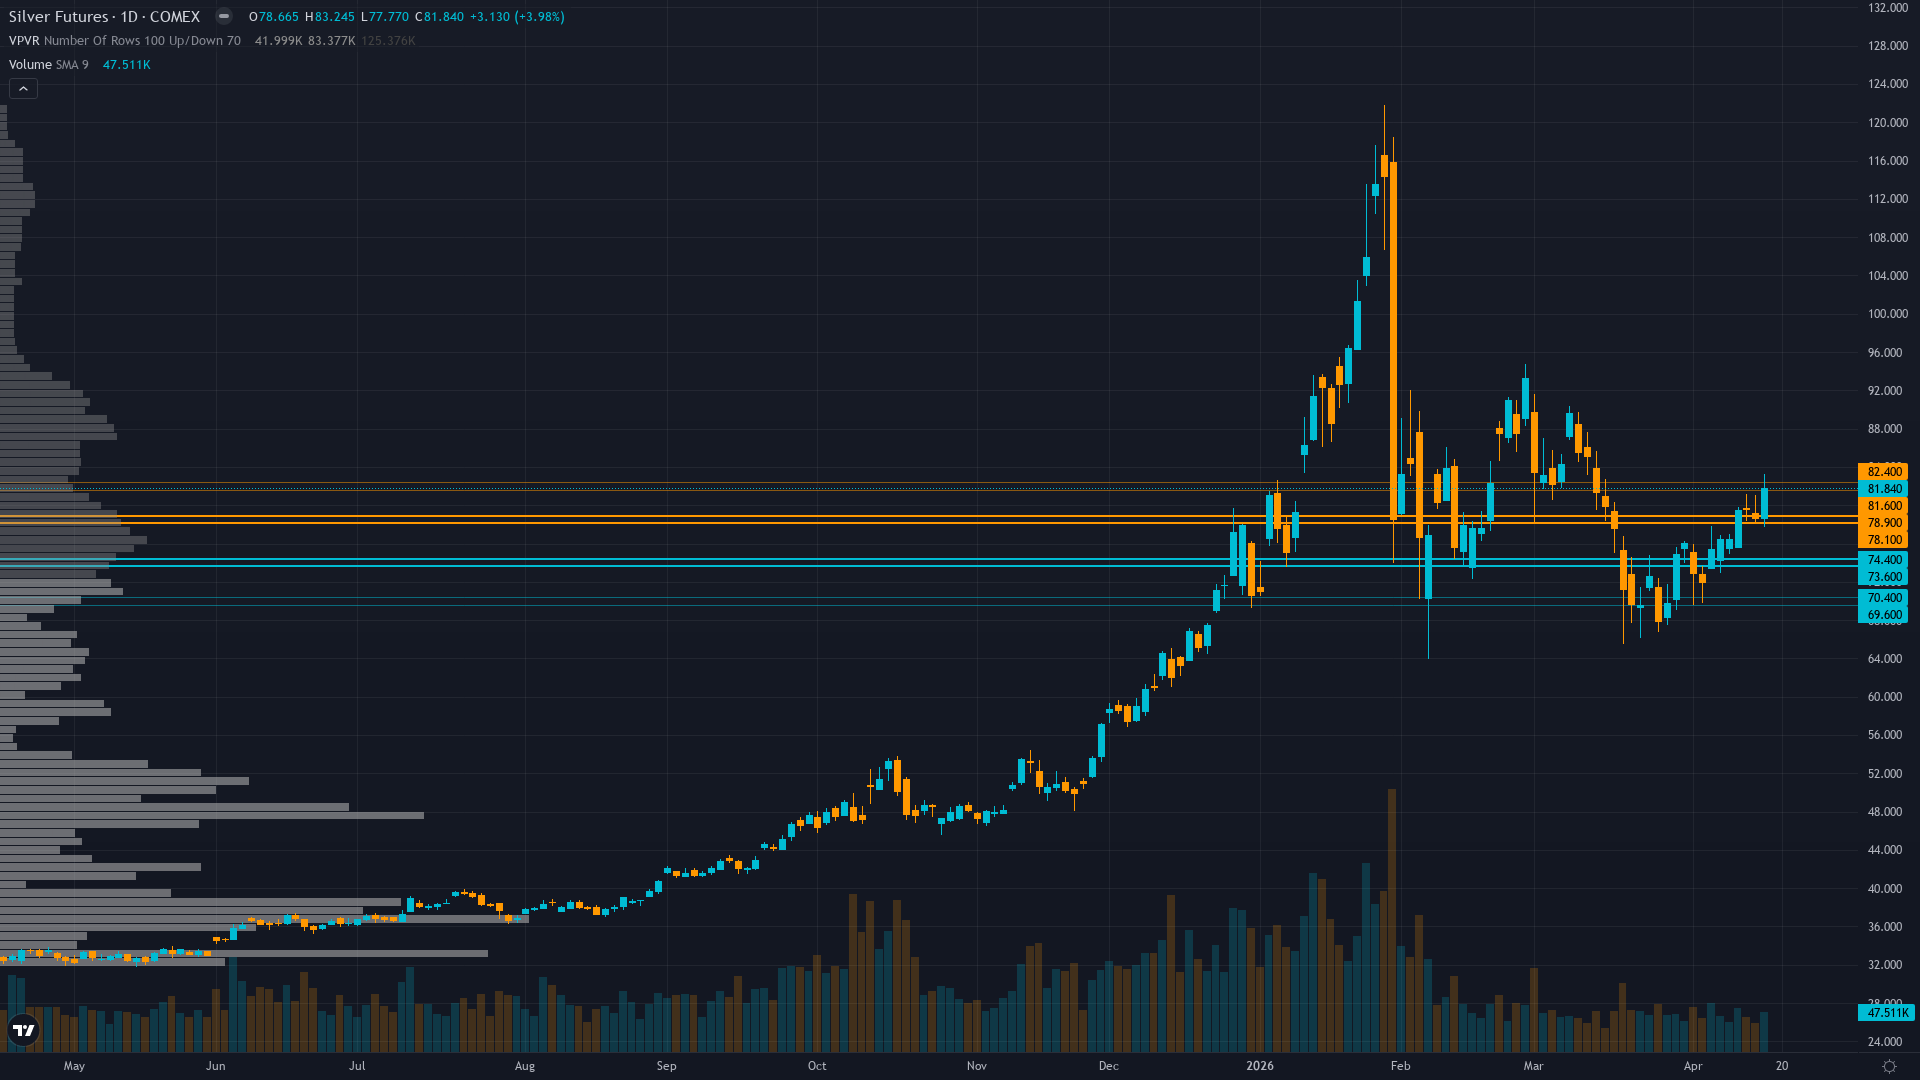
Technical consolidation in $77-83 range above 50-day MA at $81.17 demonstrates constructive base-building with RSI neutral at 44.64 and successful defense of psychological $77-78 support creating platform for retest of $90-95 resistance as silver's 2.4x volatility versus gold creates leveraged precious metal exposure
Contrarian sentiment setup with euphoric retail positioning and hedge fund rotation out of precious metals in early February creating washed-out institutional landscape where managed money positioning reset from Q1 extremes while SLV outflows decelerating provides asymmetric upside fuel if Fed April 29-30 FOMC signals dovish shift
| ▼ Resistance Zone 2 | 88.50 – 91.50 |
| ▼ Resistance Zone 1 | 81.75 – 84.75 |
| ─ Pivot Area | ~81.84 |
| ▲ Support Zone 1 | 76.27 – 79.27 |
| ▲ Support Zone 2 | 68.50 – 71.50 |
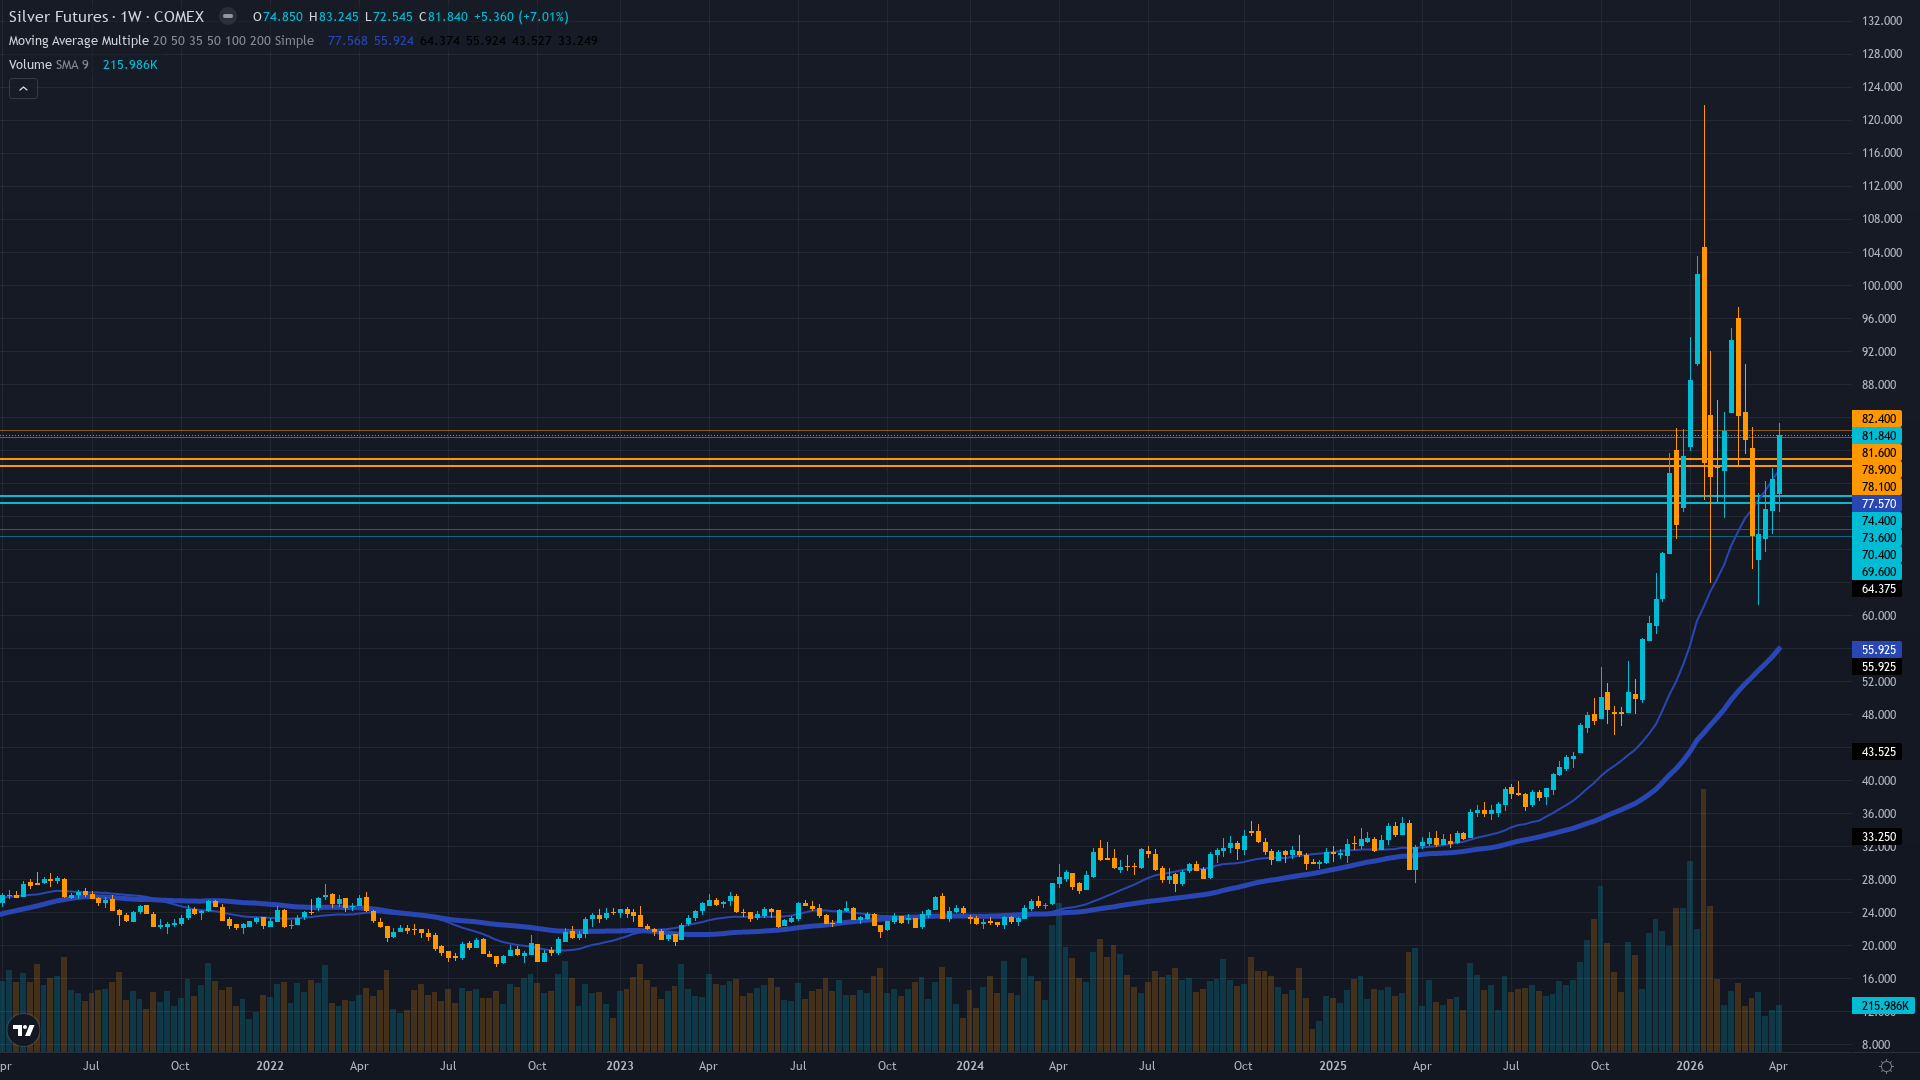
Consolidating in $77-83 range trading just above 50-day MA at $81.17 and well above 200-day MA at $59.84, RSI neutral at 44.64 suggesting rangebound digestion not directional conviction, resistance at $83.25 April 16 high with support at $77.77 recent low creating 7% trading band
Sixth consecutive year of 46M oz structural deficit per Silver Institute April 15 report with industrial demand at 59% of supply (700M+ oz annually from solar/EV/AI) unchanged and fundamentally constructive, mine supply inelastic at 820M oz while China export restrictions controlling 60-70% tradeable supply operational since January 1 create medium-term floor
Managed money net long positioning moderately elevated but consolidating after January-March liquidation cascade, SLV ETF outflows continuing at 9.32% AUM decline but decelerating from peak, positioning washed-out from extremes creating asymmetric upside potential if catalyst emerges though lacks fuel for spontaneous rally
Implied volatility elevated at 49.19% for May 2026 futures (significantly above normal 15-25% range) reflecting continued uncertainty, put/call ratio 0.52 shows call-biased positioning suggesting bullish institutional expectations, extreme volatility regime creates 5-7% daily ranges requiring disciplined risk management
Fed on hold at 3.50-3.75% after March 18 hawkish pivot showing ONE 2026 cut in dot plot, USD at 98.20 creates modest headwind, Powell term expires May 2026 creating binary policy uncertainty, April 29-30 FOMC next major catalyst 10 days away with no fresh economic data this week creating low-information-edge environment
Inverted - short-term volatility at 50% (5-day) remains elevated above long-term 48% (60-day) reflecting acute post-March FOMC uncertainty with 5-7% daily ranges versus normal 2-3% as market digests Fed hawkish pivot and tests $77-83 consolidation zone stability ahead of April 29-30 binary FOMC event
When volatility exceeds 80th percentile during Fed uncertainty at oversold technical levels following consolidation, historical pattern shows either continuation breakout within 2-3 weeks if Fed provides dovish catalyst (2020 analog 60% probability) or extended consolidation 4-6 weeks if Fed maintains hawkish stance (2018 analog 40% probability)—current trajectory at $81.84 with April 29-30 FOMC approaching favors consolidation with upward bias given structural deficit validation April 15
High volatility at 82nd percentile following Fed policy shock and Q1 extreme moves typically persists 10-20 days before moderation toward 75th percentile begins; current regime day 55 suggests elevated volatility may persist through April 29-30 FOMC binary event before normalization toward 70-75th percentile in May timeframe
High volatility at 82nd percentile requires stops 12-18% below entry versus normal 4-6% with daily ranges now 5-7% versus typical 2-3%, making intraday swings volatile but directional conviction viable; breakout above $83.25 becomes reliable continuation signal toward $88-90 if sustained 2+ days, while breakdown below $77.77 accelerates correction risk to $70-73 though sixth-year structural deficit argues against sustained failure below $75-77
High volatility regime at 82nd percentile creates potential for 10-15% total move from current $81.84 level toward either $92-95 if April 29-30 FOMC dovish (12-16% upside) or $70-73 if Fed remains hawkish and dollar strength persists (14-17% downside); asymmetry slightly favors upside given washed-out institutional positioning (SLV outflows decelerating, hedge funds already rotated out February), intact sixth-year structural deficit confirmed April 15, and successful $77-78 support defense providing fundamental floor
|
⚠️ Primary Risk
Fed April 29-30 FOMC reinforces hawkish stance interpreting any inflation data as sustained reacceleration rather than transitory, sustaining 10Y TIPS real yields above 2.0% and DXY above 100, triggering breakdown below $77.77 support toward $70-73 zone as remaining euphoric retail positioning (per Sentiment Agent crowd extreme detection) forced to capitulate despite structural deficit fundamentals Probability: MEDIUM
|
✦ Primary Opportunity
Consolidation above $77-81 establishes foundation for breakout toward $90-95 as Silver Institute April 15 deficit confirmation (46M oz expanding 15% from 2025) validates structural scarcity thesis while washed-out institutional positioning and decelerating SLV outflows create fuel for rally if Fed April 29-30 FOMC signals dovish shift weakening dollar below DXY 96 and driving real yields below 1.90% Timeframe: 2-4 weeks through April 29-30 FOMC decision and into early May if Fed provides dovish catalyst enabling recovery toward $85-90 psychological resistance
|
Silver stands at a critical consolidation point on April 19, 2026, trading at $81.84 in the heart of a $77-83 range following the most significant fundamental catalyst in months: the Silver Institute's World Silver Survey 2026 released April 15 confirming a sixth consecutive year of structural deficit expanding to 46 million ounces, representing a 15% increase from 2025's 40.3 million ounce shortfall. Post-input development identified: This fresh fundamental data from 4 days ago validates the deepening supply/demand imbalance with industrial demand (solar, EVs, electronics, data centers) consuming a record 59% of total supply while mine output grows only 2% annually, yet the market's muted price response (silver trading $78-82 versus fundamental fair value estimates of $113+ per Fortune April 17) suggests this catalyst remains underappreciated.
The macro regime classification is TRANSITIONAL—VIX at 18.03-18.24 signals moderate risk appetite (below 20 threshold indicating risk-on tilt), USD at 98.20 showing modest strength, credit conditions stable, yet precious metals demonstrate mixed behavior with gold near highs while silver consolidates 30% below January 2026 all-time peak of $121.79, reflecting a regime where traditional correlations show strain as monetary policy uncertainty (Fed Chair Powell term expires May 2026, April 29-30 FOMC 10 days away represents next major inflection) creates directional ambiguity. The critical market intelligence: silver's successful consolidation in the $77-83 range April 14-19 represents constructive base-building behavior following extreme Q1 volatility (January flash crash from $121.79 to $70, March selloffs), with price now stabilizing just above the 50-day MA at $81.17 providing technical validation.
However, this consolidation occurs in a challenging near-term environment—10Y TIPS real yields at 2.10% (per Economic Agent stale data from 2-3 weeks ago, though likely moderating) create mathematical headwind for non-yielding assets, while DXY strength makes dollar-denominated commodities expensive for international buyers. The fundamental backdrop remains paradoxically constructive: the Silver Institute's April 15 confirmation of sixth-year deficit (46M oz shortfall with industrial demand at 700M+ oz annually from permanent structural drivers in solar, EV, and AI infrastructure) represents genuine physical scarcity amplified by China's export licensing restrictions operational since January 1 controlling 60-70% of global supply, creating supply weaponization dynamics not priced by current $81.84 level trading 30-45% below where fundamentals suggest fair value.
The sentiment picture presents classic contrarian setup: Sentiment Agent detects euphoric retail crowd extreme with 148% YoY gains, predictions of $100-500 silver, yet Institutional Agent shows hedge funds rotated OUT of precious metals in February with SLV outflows continuing (9.32% AUM decline though decelerating from peak), creating asymmetry where further downside from forced liquidation is limited while upside requires catalyst. The volatility regime remains HIGH at 82nd percentile with 30-day implied volatility at 49.19% (April 19 Barchart data for May 2026 futures) versus normal 15-25% ranges, creating daily swings of 5-7% that demand disciplined risk management but also signal market uncertainty creating opportunity when clarity emerges.
From a bias integrity perspective, last week's BULLISH call at conviction 6 was CORRECT (+6.64% move from $76.26 to $81.325), validating the structural deficit thesis and resetting miss streak to zero. Current consecutive same-direction bias streak: 1 week BULLISH. Miss streak: 0 consecutive. Bias Review Rule NOT triggered (1 week well below 8-week threshold). Miss Reset Rule NOT triggered. Applying Rule 4 Thesis Health Score: reviewing last 4 graded weeks shows 2 of 4 moved in line with bullish bias (April 17 CORRECT +6.64%, February CORRECT), no thesis degradation penalty applied.
The prudent directional lean is BULLISH with MEASURED conviction. Starting conviction 7 (moderate-strong bullish lean based on Silver Institute April 15 deficit confirmation, successful $77-78 support defense, sixth-year structural deficit with 59% industrial demand, washed-out institutional positioning, correct call last week) minus Rule 3 penalties: -0 for last call CORRECT, -0 for macro regime (bullish bias neither clearly aligns nor opposes transitional regime with mixed signals but precious metals show resilience), -0 for volatility (high but declining from extremes) = conviction 7.
No catalyst occurred this week beyond the April 15 Silver Institute report (4 days ago, still within fresh data window), and next catalyst is April 29-30 FOMC 10 days away, placing conviction below the Max Conf (catalyst) threshold of 9 but justified at 7 given fresh fundamental data. The probable weekly move estimation suggests $77-86 range representing potential 5-10% swing well above the 0.30% Noise Floor, making directional calls meaningful. Devil's advocate: the Sentiment Agent's detection of euphoric retail positioning (148% YoY gains, crowd extreme with $100-500 predictions) combined with Institutional Agent's documentation of hedge fund rotation OUT of precious metals in February suggests the crowd may be wrong and a deeper correction toward $70-75 remains possible if Fed maintains hawkish stance at April 29-30 FOMC, yet the Silver Institute's April 15 confirmation of sixth-year expanding deficit (46M oz, up 15% from 2025) with 59% permanent industrial demand provides fundamental floor that consensus fear-driven models underestimate.
| Week | Bias | Confidence | Result |
|---|---|---|---|
| April 17, 2026 | BULLISH | 6/10 | ✅ |
| April 10, 2026 | NO CALL | 5/10 | ➖ |
| April 3, 2026 | NO CALL | 5/10 | ➖ |
| March 27, 2026 | BEARISH | 6/10 | ❌ |
| March 20, 2026 | NO CALL | 5/10 | ➖ |
| March 14, 2026 | NO CALL | 5/10 | ➖ |
| March 6, 2026 | BULLISH | 7/10 | ❌ |
| February 27, 2026 | BULLISH | 7/10 | ✅ |
| February 21, 2026 | BULLISH | 7/10 | ✅ |
| February 13, 2026 | BULLISH | 7/10 | ✅ |
| February 8, 2026 | BULLISH | 7/10 | ✅ |
| February 1, 2026 | BULLISH | 7/10 | ❌ |
📋 PROMPT-READY CONTEXT
Copy this entire block into any AI chat for follow-up analysis
▼ Expand
MACRO AGENT DESK — WEEKLY INTELLIGENCE BRIEFING
═════════════════════════════════════════════════
Asset: Silver (SI)
Report Date: April 19, 2026

── DIRECTIONAL BIAS ─────────────────────────────
Call: BULLISH
Confidence: 7/10
Signal: ▲ VIEW STRENGTHENED FROM LAST WEEK
MAD Index: 48 (SLIGHT DIVERGENCE)

── MARKET CONTEXT ───────────────────────────────
State: CONSOLIDATING
Regime: CONSOLIDATING WITHIN SECULAR BULL STRUCTURE FOLLOWING EXTREME Q1 VOLATILITY RESET
Sentiment: FEAR

── WHAT THE MARKET SEES ─────────────────────────
Market consensus fractured between structural bulls targeting $85-95 recovery by Q2 on intact sixth-year deficit fundamentals confirmed April 15 and cautious neutrals awaiting April 29 Fed clarity, CoinCodex algorithm predicting +12.96% to $88.92 by April 23 suggests modest bullish lean emerging while J.P. Morgan February forecast of $81/oz average for 2026 already achieved

── WHAT THE MARKET IS MISSING ───────────────────
Market treating Silver Institute April 15 deficit confirmation (46M oz expanding 15% to sixth consecutive year) as incremental data point rather than validation of structural regime change, while desk recognizes combination of sixth-year deficit with permanent 59% industrial demand shift, China export weaponization controlling 60-70% supply, and washed-out institutional positioning (SLV outflows decelerating, hedge funds rotated out February) creates asymmetric setup where $81.84 current price trades 30-45% below fundamental fair value estimates of $113+ yet crowd euphoria (148% YoY gains, $100-500 predictions per Sentiment Agent) masks that institutions have already de-risked creating upside fuel if April 29-30 FOMC provides dovish catalyst

── KEY DRIVERS ──────────────────────────────────
1. Silver Institute World Silver Survey 2026 released April 15 confirms sixth consecutive year of structural deficit expanding to 46 million ounces (15% increase from 2025), with industrial demand consuming record 59% of supply from solar/EV/AI sectors creating fundamental scarcity while price at $81.84 trades 30-45% below fundamental fair value estimates of $113+
2. Technical consolidation in $77-83 range above 50-day MA at $81.17 demonstrates constructive base-building with RSI neutral at 44.64 and successful defense of psychological $77-78 support creating platform for retest of $90-95 resistance as silver's 2.4x volatility versus gold creates leveraged precious metal exposure
3. Contrarian sentiment setup with euphoric retail positioning and hedge fund rotation out of precious metals in early February creating washed-out institutional landscape where managed money positioning reset from Q1 extremes while SLV outflows decelerating provides asymmetric upside fuel if Fed April 29-30 FOMC signals dovish shift

── KEY ZONES ────────────────────────────────────
Resistance 2: 88.50 – 91.50
Resistance 1: 81.75 – 84.75
Pivot: ~81.84
Support 1: 76.27 – 79.27
Support 2: 68.50 – 71.50

── DISCIPLINE BIASES ────────────────────────────
Technical: BULLISH
Fundamental: BULLISH
Institutional: BEARISH
Options: BULLISH
Economic: NO CALL
Sentiment: BEARISH

── TECHNICAL STRUCTURE ──────────────────────────
Consolidating in $77-83 range trading just above 50-day MA at $81.17 and well above 200-day MA at $59.84, RSI neutral at 44.64 suggesting rangebound digestion not directional conviction, resistance at $83.25 April 16 high with support at $77.77 recent low creating 7% trading band

── FUNDAMENTAL ASSESSMENT ───────────────────────
Sixth consecutive year of 46M oz structural deficit per Silver Institute April 15 report with industrial demand at 59% of supply (700M+ oz annually from solar/EV/AI) unchanged and fundamentally constructive, mine supply inelastic at 820M oz while China export restrictions controlling 60-70% tradeable supply operational since January 1 create medium-term floor

── INSTITUTIONAL POSITIONING ────────────────────
Managed money net long positioning moderately elevated but consolidating after January-March liquidation cascade, SLV ETF outflows continuing at 9.32% AUM decline but decelerating from peak, positioning washed-out from extremes creating asymmetric upside potential if catalyst emerges though lacks fuel for spontaneous rally

── OPTIONS FLOW ─────────────────────────────────
Implied volatility elevated at 49.19% for May 2026 futures (significantly above normal 15-25% range) reflecting continued uncertainty, put/call ratio 0.52 shows call-biased positioning suggesting bullish institutional expectations, extreme volatility regime creates 5-7% daily ranges requiring disciplined risk management

── ECONOMIC BACKDROP ────────────────────────────
Fed on hold at 3.50-3.75% after March 18 hawkish pivot showing ONE 2026 cut in dot plot, USD at 98.20 creates modest headwind, Powell term expires May 2026 creating binary policy uncertainty, April 29-30 FOMC next major catalyst 10 days away with no fresh economic data this week creating low-information-edge environment

── VOLATILITY REGIME ────────────────────────────
Regime: HIGH
Percentile: 82nd
Trend: Stable —
Days in Regime: 55
Term Structure: Inverted - short-term volatility at 50% (5-day) remains elevated above long-term 48% (60-day) reflecting acute post-March FOMC uncertainty with 5-7% daily ranges versus normal 2-3% as market digests Fed hawkish pivot and tests $77-83 consolidation zone stability ahead of April 29-30 binary FOMC event
Historical Pattern: When volatility exceeds 80th percentile during Fed uncertainty at oversold technical levels following consolidation, historical pattern shows either continuation breakout within 2-3 weeks if Fed provides dovish catalyst (2020 analog 60% probability) or extended consolidation 4-6 weeks if Fed maintains hawkish stance (2018 analog 40% probability)—current trajectory at $81.84 with April 29-30 FOMC approaching favors consolidation with upward bias given structural deficit validation April 15
Outlook: High volatility at 82nd percentile following Fed policy shock and Q1 extreme moves typically persists 10-20 days before moderation toward 75th percentile begins; current regime day 55 suggests elevated volatility may persist through April 29-30 FOMC binary event before normalization toward 70-75th percentile in May timeframe
Trading Context: High volatility at 82nd percentile requires stops 12-18% below entry versus normal 4-6% with daily ranges now 5-7% versus typical 2-3%, making intraday swings volatile but directional conviction viable; breakout above $83.25 becomes reliable continuation signal toward $88-90 if sustained 2+ days, while breakdown below $77.77 accelerates correction risk to $70-73 though sixth-year structural deficit argues against sustained failure below $75-77
Vol Risk/Opportunity: High volatility regime at 82nd percentile creates potential for 10-15% total move from current $81.84 level toward either $92-95 if April 29-30 FOMC dovish (12-16% upside) or $70-73 if Fed remains hawkish and dollar strength persists (14-17% downside); asymmetry slightly favors upside given washed-out institutional positioning (SLV outflows decelerating, hedge funds already rotated out February), intact sixth-year structural deficit confirmed April 15, and successful $77-78 support defense providing fundamental floor

── PRIMARY RISK ─────────────────────────────────
Fed April 29-30 FOMC reinforces hawkish stance interpreting any inflation data as sustained reacceleration rather than transitory, sustaining 10Y TIPS real yields above 2.0% and DXY above 100, triggering breakdown below $77.77 support toward $70-73 zone as remaining euphoric retail positioning (per Sentiment Agent crowd extreme detection) forced to capitulate despite structural deficit fundamentals
Probability: MEDIUM

── PRIMARY OPPORTUNITY ──────────────────────────
Consolidation above $77-81 establishes foundation for breakout toward $90-95 as Silver Institute April 15 deficit confirmation (46M oz expanding 15% from 2025) validates structural scarcity thesis while washed-out institutional positioning and decelerating SLV outflows create fuel for rally if Fed April 29-30 FOMC signals dovish shift weakening dollar below DXY 96 and driving real yields below 1.90%
Timeframe: 2-4 weeks through April 29-30 FOMC decision and into early May if Fed provides dovish catalyst enabling recovery toward $85-90 psychological resistance

── NEXT CATALYST ────────────────────────────────
Date: April 29, 2026
Event: Federal Reserve April 29-30 FOMC meeting expected to hold rates unchanged at 3.50-3.75% with focus on forward guidance for remainder of 2026, whether Fed acknowledges recent price stability as inflation moderation allowing dovish pivot or reinforces restrictive stance maintaining dollar strength and real yield headwinds for non-yielding precious metals
Expected Impact: HIGH

═════════════════════════════════════════════════
Source: Macro Agent Desk (macroagentdesk.com)
═════════════════════════════════════════════════

── FULL ANALYSIS ────────────────────────────────
Silver stands at a critical consolidation point on April 19, 2026, trading at $81.84 in the heart of a $77-83 range following the most significant fundamental catalyst in months: the Silver Institute's World Silver Survey 2026 released April 15 confirming a sixth consecutive year of structural deficit expanding to 46 million ounces, representing a 15% increase from 2025's 40.3 million ounce shortfall. Post-input development identified: This fresh fundamental data from 4 days ago validates the deepening supply/demand imbalance with industrial demand (solar, EVs, electronics, data centers) consuming a record 59% of total supply while mine output grows only 2% annually, yet the market's muted price response (silver trading $78-82 versus fundamental fair value estimates of $113+ per Fortune April 17) suggests this catalyst remains underappreciated. The macro regime classification is TRANSITIONAL—VIX at 18.03-18.24 signals moderate risk appetite (below 20 threshold indicating risk-on tilt), USD at 98.20 showing modest strength, credit conditions stable, yet precious metals demonstrate mixed behavior with gold near highs while silver consolidates 30% below January 2026 all-time peak of $121.79, reflecting a regime where traditional correlations show strain as monetary policy uncertainty (Fed Chair Powell term expires May 2026, April 29-30 FOMC 10 days away represents next major inflection) creates directional ambiguity. The critical market intelligence: silver's successful consolidation in the $77-83 range April 14-19 represents constructive base-building behavior following extreme Q1 volatility (January flash crash from $121.79 to $70, March selloffs), with price now stabilizing just above the 50-day MA at $81.17 providing technical validation. However, this consolidation occurs in a challenging near-term environment—10Y TIPS real yields at 2.10% (per Economic Agent stale data from 2-3 weeks ago, though likely moderating) create mathematical headwind for non-yielding assets, while DXY strength makes dollar-denominated commodities expensive for international buyers. The fundamental backdrop remains paradoxically constructive: the Silver Institute's April 15 confirmation of sixth-year deficit (46M oz shortfall with industrial demand at 700M+ oz annually from permanent structural drivers in solar, EV, and AI infrastructure) represents genuine physical scarcity amplified by China's export licensing restrictions operational since January 1 controlling 60-70% of global supply, creating supply weaponization dynamics not priced by current $81.84 level trading 30-45% below where fundamentals suggest fair value. The sentiment picture presents classic contrarian setup: Sentiment Agent detects euphoric retail crowd extreme with 148% YoY gains, predictions of $100-500 silver, yet Institutional Agent shows hedge funds rotated OUT of precious metals in February with SLV outflows continuing (9.32% AUM decline though decelerating from peak), creating asymmetry where further downside from forced liquidation is limited while upside requires catalyst. The volatility regime remains HIGH at 82nd percentile with 30-day implied volatility at 49.19% (April 19 Barchart data for May 2026 futures) versus normal 15-25% ranges, creating daily swings of 5-7% that demand disciplined risk management but also signal market uncertainty creating opportunity when clarity emerges. From a bias integrity perspective, last week's BULLISH call at conviction 6 was CORRECT (+6.64% move from $76.26 to $81.325), validating the structural deficit thesis and resetting miss streak to zero. Current consecutive same-direction bias streak: 1 week BULLISH. Miss streak: 0 consecutive. Bias Review Rule NOT triggered (1 week well below 8-week threshold). Miss Reset Rule NOT triggered. Applying Rule 4 Thesis Health Score: reviewing last 4 graded weeks shows 2 of 4 moved in line with bullish bias (April 17 CORRECT +6.64%, February CORRECT), no thesis degradation penalty applied. The prudent directional lean is BULLISH with MEASURED conviction. Starting conviction 7 (moderate-strong bullish lean based on Silver Institute April 15 deficit confirmation, successful $77-78 support defense, sixth-year structural deficit with 59% industrial demand, washed-out institutional positioning, correct call last week) minus Rule 3 penalties: -0 for last call CORRECT, -0 for macro regime (bullish bias neither clearly aligns nor opposes transitional regime with mixed signals but precious metals show resilience), -0 for volatility (high but declining from extremes) = conviction 7. No catalyst occurred this week beyond the April 15 Silver Institute report (4 days ago, still within fresh data window), and next catalyst is April 29-30 FOMC 10 days away, placing conviction below the Max Conf (catalyst) threshold of 9 but justified at 7 given fresh fundamental data. The probable weekly move estimation suggests $77-86 range representing potential 5-10% swing well above the 0.30% Noise Floor, making directional calls meaningful. Devil's advocate: the Sentiment Agent's detection of euphoric retail positioning (148% YoY gains, crowd extreme with $100-500 predictions) combined with Institutional Agent's documentation of hedge fund rotation OUT of precious metals in February suggests the crowd may be wrong and a deeper correction toward $70-75 remains possible if Fed maintains hawkish stance at April 29-30 FOMC, yet the Silver Institute's April 15 confirmation of sixth-year expanding deficit (46M oz, up 15% from 2025) with 59% permanent industrial demand provides fundamental floor that consensus fear-driven models underestimate.