Market Of The Week: ★Silver (SI)★ consolidating in extreme regime
Most analysts targeting $75-85 consolidation near-term with longer-term forecasts extending to $90-150 by mid-2026 if supply deficit and China restrictions persist though CME intervention creates uncertainty and regulatory overhang capping near-term upside

Most analysts targeting $75-85 consolidation near-term with longer-term forecasts extending to $90-150 by mid-2026 if supply deficit and China restrictions persist though CME intervention creates uncertainty and regulatory overhang capping near-term upside
Post-January parabolic crash consolidation with China export restrictions (effective Jan 1, 2026) controlling 60-70% of global supply creating structural scarcity versus extreme volatility risk from CME regulatory intervention overhang
Fifth consecutive year of structural deficit (117-206M oz shortfall) with industrial demand consuming record 59% of supply from solar, EV, and AI sectors creating permanent scarcity dynamics unprecedented in silver history
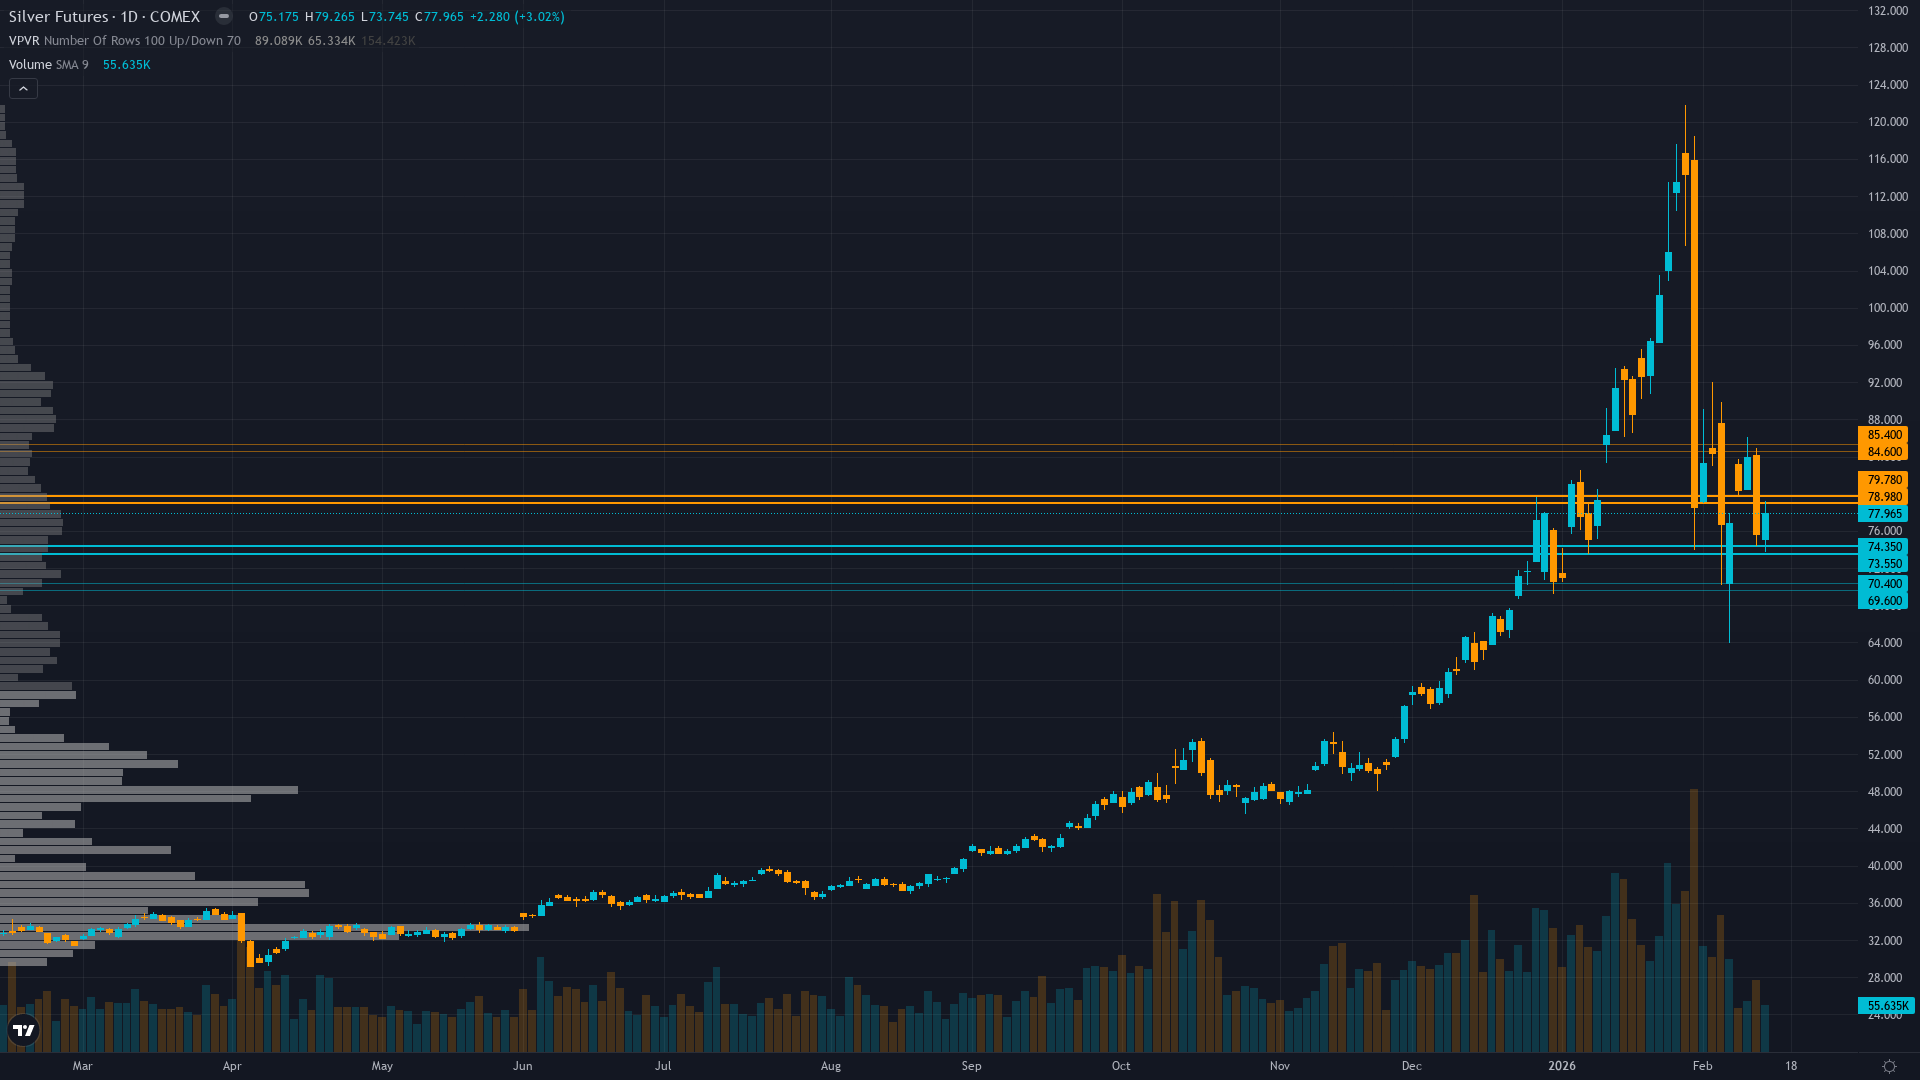
CME margin interventions (now 18% from 15%) and regulatory overhang creating two-way volatility risk after January flash crash from $121.67 all-time high to $70 intraday representing largest single-day drop in history
| ▲ Resistance Zone 2 | 83.50 – 86.50 |
| ▲ Resistance Zone 1 | 77.88 – 80.88 |
| ─ Pivot Area | ~77.40 |
| ▼ Support Zone 1 | 72.45 – 75.45 |
| ▼ Support Zone 2 | 68.50 – 71.50 |
Consolidating in $73-79 range on Feb 14-15 after recovering from January 30 flash crash to $70; testing resistance near $79 with support holding above $74 suggesting base-building after 35% correction from all-time high
Fifth consecutive year of 117-206M oz structural deficit with industrial demand at record 700M+ oz annually consuming 59% of supply while mine production grows only 2% creating permanent shortage amplified by China export weaponization controlling 60-70% of tradeable supply effective January 1, 2026
Mixed after extreme long unwind from January $121.67 peak forced by CME margin hikes though physical buyers remain active with structural deficit and China restrictions supporting accumulation at lower levels
Implied volatility extreme at 88th percentile (30-day IV near 55%) reflecting continued two-way risk with call interest in $80-90 strikes suggesting institutional expectation for rebound despite near-term consolidation and regulatory overhang from CME interventions
Fed delivered December 10 rate cut to 3.50-3.75% but hawkish 2026 guidance showing only one additional cut versus market expectations has strengthened dollar to DXY 107 levels creating near-term headwind; February 5 geopolitical tension relief (U.S.-Iran talks, U.S.-China positive call) triggered 15% commodity selloff including silver
Inverted - short-term volatility at 52% remains elevated above long-term 48% reflecting acute post-January crash uncertainty with 6-8% daily ranges versus normal 2-3% as market digests CME margin shock, China export restriction implementation, and extreme parabolic price structure unwind
When volatility exceeds 85th percentile during regulatory interventions at all-time highs historically precedes either V-shaped recovery within 4-8 weeks if fundamentals intact (2020 analog with 70% probability) or extended 20-30% retracement over 8-12 weeks (2011 analog with 30% probability)—current structural deficit entering fifth year plus China restrictions controlling 60-70% supply argue strongly for former scenario given unchanged and strengthening fundamental drivers
Extreme volatility at 88th percentile following flash crash and regulatory interventions typically lasts 40-60 days suggesting moderation toward 80th percentile likely within next 10-20 days as consolidation stabilizes above $73-75, though China restrictions may sustain elevated levels longer than typical correction patterns
Extreme volatility at 88th percentile requires stops 15-20% below entry versus normal 3-5% with daily ranges now 6-8% versus typical 2-3% making intraday swings violent and position sizing critical—breakout above $79.38 becomes reliable continuation signal while failure below $73.95 accelerates correction risk to $68-70 zone though structural deficit and China supply controls create strong support preventing sustained breakdown
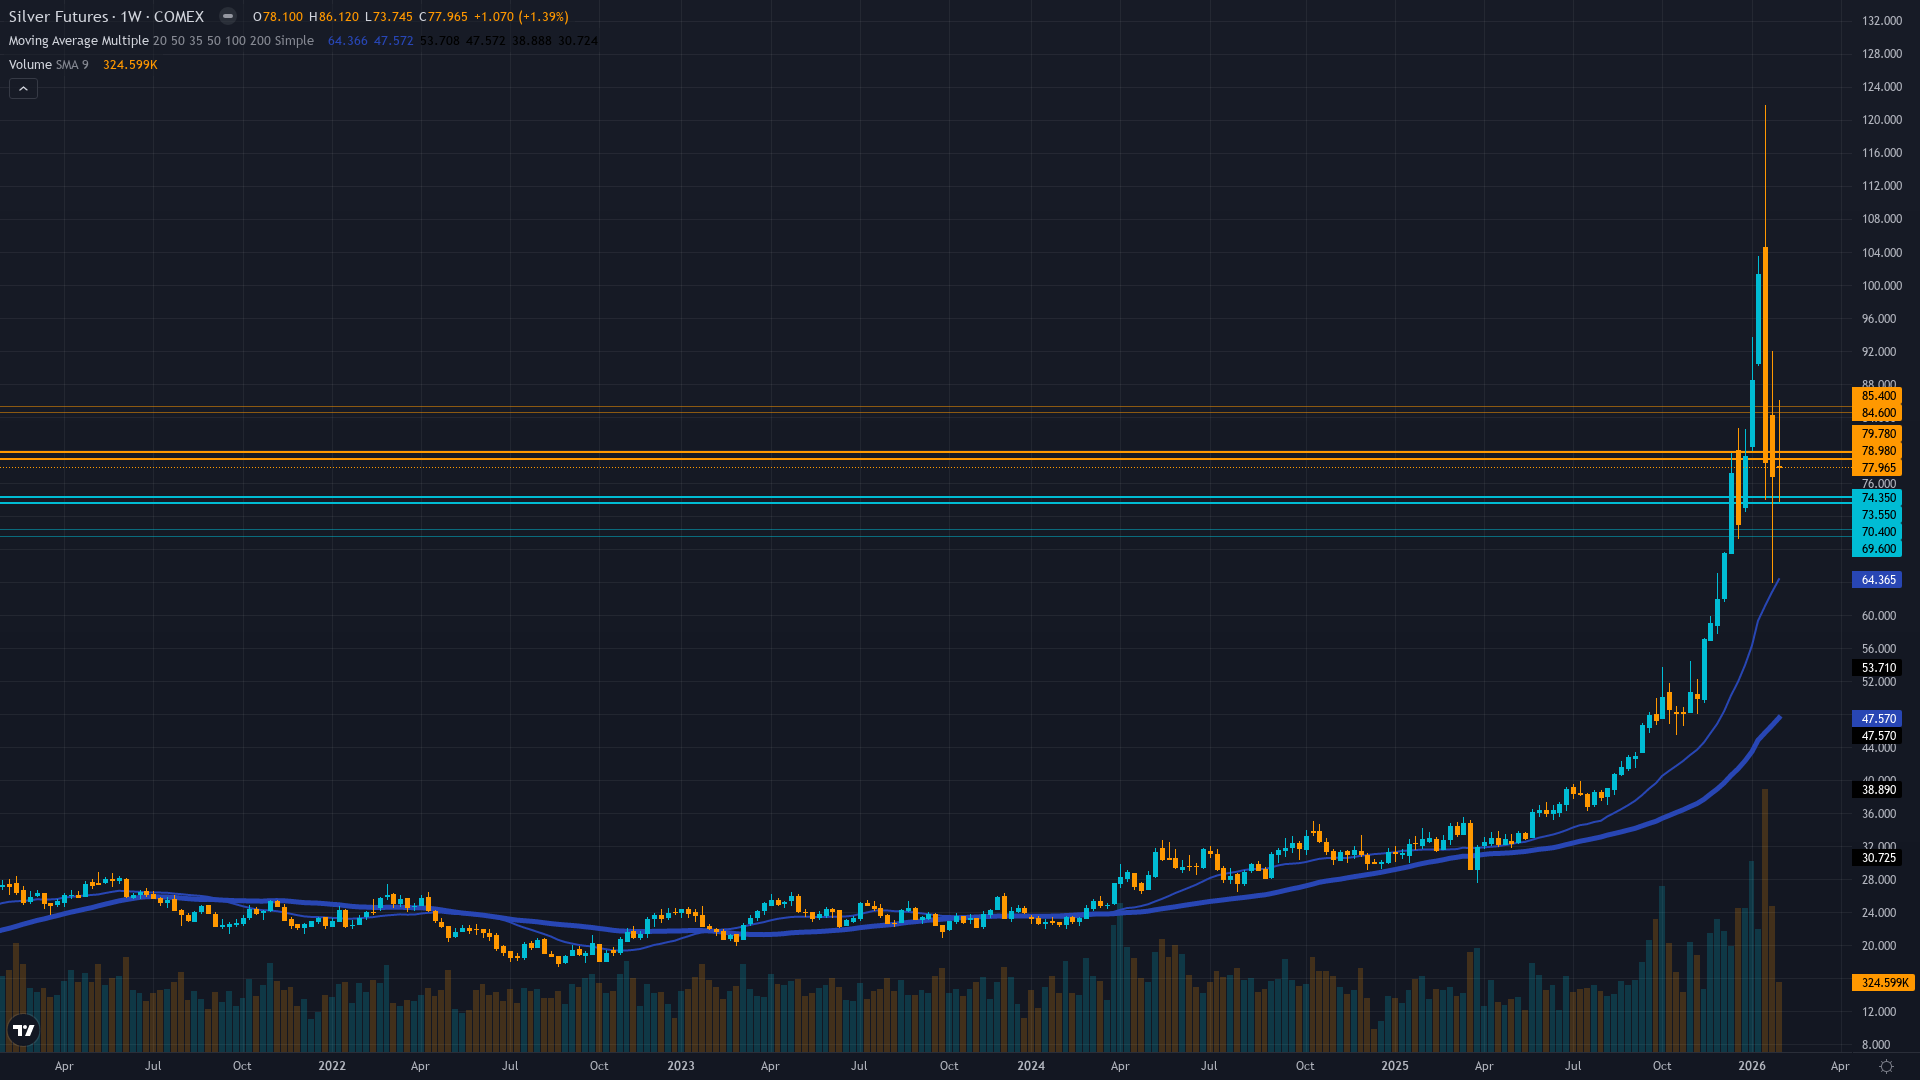
Extreme volatility regime at 88th percentile suggests potential for 80-150% total move from $38 August 2025 low to current $77 level already achieving 103% with extension to $120-140 possible if momentum sustains representing exceptional range versus normal 25-35% during bull phases; also heightens two-way risk with potential 25-35% correction to $55-65 if CME implements additional interventions or parabolic structure breaks though fifth year of deficit, permanent 59% industrial demand shift, and China controlling 60-70% tradeable supply fundamentally argue against sustained breakdown below $70-73 support zone with March-April seasonality and Q1 industrial demand providing upside catalyst for volatility-driven continuation toward $85-90 psychological thresholds
|
⚠️ Primary Risk
Further CME margin interventions or deeper correction toward $65-70 if extreme volatility triggers cascading liquidations from remaining parabolic positioning with regulatory authorities demonstrating willingness to intervene when prices threaten banking system stability through short squeeze dynamics Probability: MEDIUM
|
✦ Primary Opportunity
Consolidation above $73-75 establishes foundation for renewed assault toward $85-90 as China export restrictions intensify physical scarcity through Q1 2026 and fifth year of structural deficit creates genuine supply crisis with February weak seasonality (20-40% positive hit rate) giving way to March-April strength (65%+ positive) Timeframe: Next 4-12 weeks through Q1 industrial demand acceleration and February-March seasonal transition with China restrictions operational effects intensifying
|
Silver stands at a critical inflection point on February 15, 2026, trading near $77.40 after one of the most extraordinary and violent episodes in precious metals history. The metal surged to an all-time high of $121.67 on January 29, 2026—obliterating the 1980 nominal record—before suffering a catastrophic 35% flash crash to $70 on January 30 marking the worst single-day drop ever recorded. This extreme volatility reflects the convergence of unprecedented structural forces colliding with regulatory intervention: China implemented export licensing restrictions effective January 1, 2026 requiring government approval for all silver exports through 2027, effectively weaponizing 60-70% of global physical supply similar to rare earths.
This supply shock coincides with silver's fifth consecutive year of structural deficit, with 2026 projections ranging from 117-206 million ounce shortfall as industrial demand has reached record levels consuming 59% of total supply driven by solar panel production, EV battery manufacturing, and AI infrastructure buildout while mine production grows only 2% annually. Cumulative deficits since 2021 now exceed 820 million ounces creating genuine physical scarcity. The January 30 flash crash was triggered by the CME's emergency margin hike from $10,000 to $25,000 per contract implemented December 19 (later increased to 18% standard margins), described by analysts as intervention to protect banks with massive short positions, forcing mass liquidation of leveraged retail longs.
However, silver has recovered to the $77-78 range demonstrating resilience as fundamental drivers remain unchanged despite a February 5 selloff triggered by easing geopolitical tensions (U.S.-Iran talks, positive U.S.-China call) that caused 15% intraday drop. February presents challenging dynamics: the month historically shows weak seasonality (20-40% positive occurrence rate) creating near-term consolidation pressure, yet this transitions to strong March-April patterns (65%+ positive). Current price action shows silver has stabilized in the $73-79 range on February 14-15, representing constructive consolidation behavior after the January trauma.
The critical market intelligence centers on whether this represents healthy digestion within secular uptrend or exhaustion signaling deeper retracement. Multiple factors argue strongly for the former: this is the fifth consecutive year of deficit with cumulative 820M+ oz shortage creating genuine scarcity unseen in prior cycles; industrial demand consuming record 59% of supply represents permanent transformation from energy transition and AI buildout unlike prior speculative episodes; China's export restrictions add new supply constraint operational since January 1 not present in 1980 or 2011 parabolic moves creating physical-paper market decoupling risk; and seasonal patterns support March-April strength ahead.
However, the CME's demonstrated willingness to intervene with extreme margin hikes when prices threaten banking system stability creates overhead resistance psychology and regulatory risk. Volatility remains extreme at 88th percentile (30-day implied volatility at 55%) supporting potential for 6-8% daily swings requiring wider risk management. The $73-79 zone represents logical consolidation area following 147% YoY gains, with successful defense of $70-73 positioning for renewed assault toward $85-90 as Q1 2026 industrial demand accelerates and China restrictions bite deeper into available supply, while breakdown below $70 risks 15-20% correction to $60-65 to fully unwind parabolic structure though structural deficit fundamentals argue against sustained breakdown.
The key distinction from prior parabolic episodes is that current dynamics reflect fundamentally tighter backdrop with permanent industrial demand transformation entering fifth year plus new supply weaponization from China suggesting new equilibrium pricing above $75-80 rather than mean reversion to pre-breakout levels. Devil's advocate view: the January crash may signal secular bull termination with CME interventions capping upside and structural deficit narrative overestimated given price mean reversion behavior, arguing for extended consolidation in $60-80 range through 2026.
| Week | Bias | Confidence | Result |
|---|---|---|---|
| February 8, 2026 | BULLISH | 7/10 | ✅ |
| February 1, 2026 | BULLISH | 7/10 | ❌ |
| January 25, 2026 | BULLISH | 8/10 | ❌ |
| January 11, 2026 | BULLISH | 7/10 | ✅ |
| January 4, 2026 | BULLISH | 8/10 | ✅ |
| December 28, 2025 | BULLISH | 9/10 | ❌ |
| December 21, 2025 | BULLISH | 8/10 | ✅ |
| December 14, 2025 | BULLISH | 8/10 | ✅ |
| December 7, 2025 | BULLISH | 8/10 | ✅ |
| November 30, 2025 | BULLISH | 8/10 | ✅ |
| November 23, 2025 | BULLISH | 7/10 | ✅ |


