Market Of The Week: ★Gold (GC)★ Post-January FOMC consolidation following Fed pause at 3.5-3.75% with 67% YTD…
Bullish medium-term with structural central bank support intact and Fed maintaining accommodative bias despite January pause creating constructive backdrop for continuation toward $4800-5000

Bullish medium-term with structural central bank support intact and Fed maintaining accommodative bias despite January pause creating constructive backdrop for continuation toward $4800-5000
Post-January FOMC consolidation following Fed pause at 3.5-3.75% with 67% YTD 2025 rally establishing $4000 as permanent paradigm support despite recent volatility spike
Central bank structural reallocation with 297 tonnes accumulated through November 2025 and 95% planning reserve increases providing permanent bid floor at $4400-4500 levels
Dollar persistent weakness at DXY 97.15 down 10% year-over-year creating sustained inverse correlation tailwind despite January 29 Fed pause amplifying safe-haven appeal
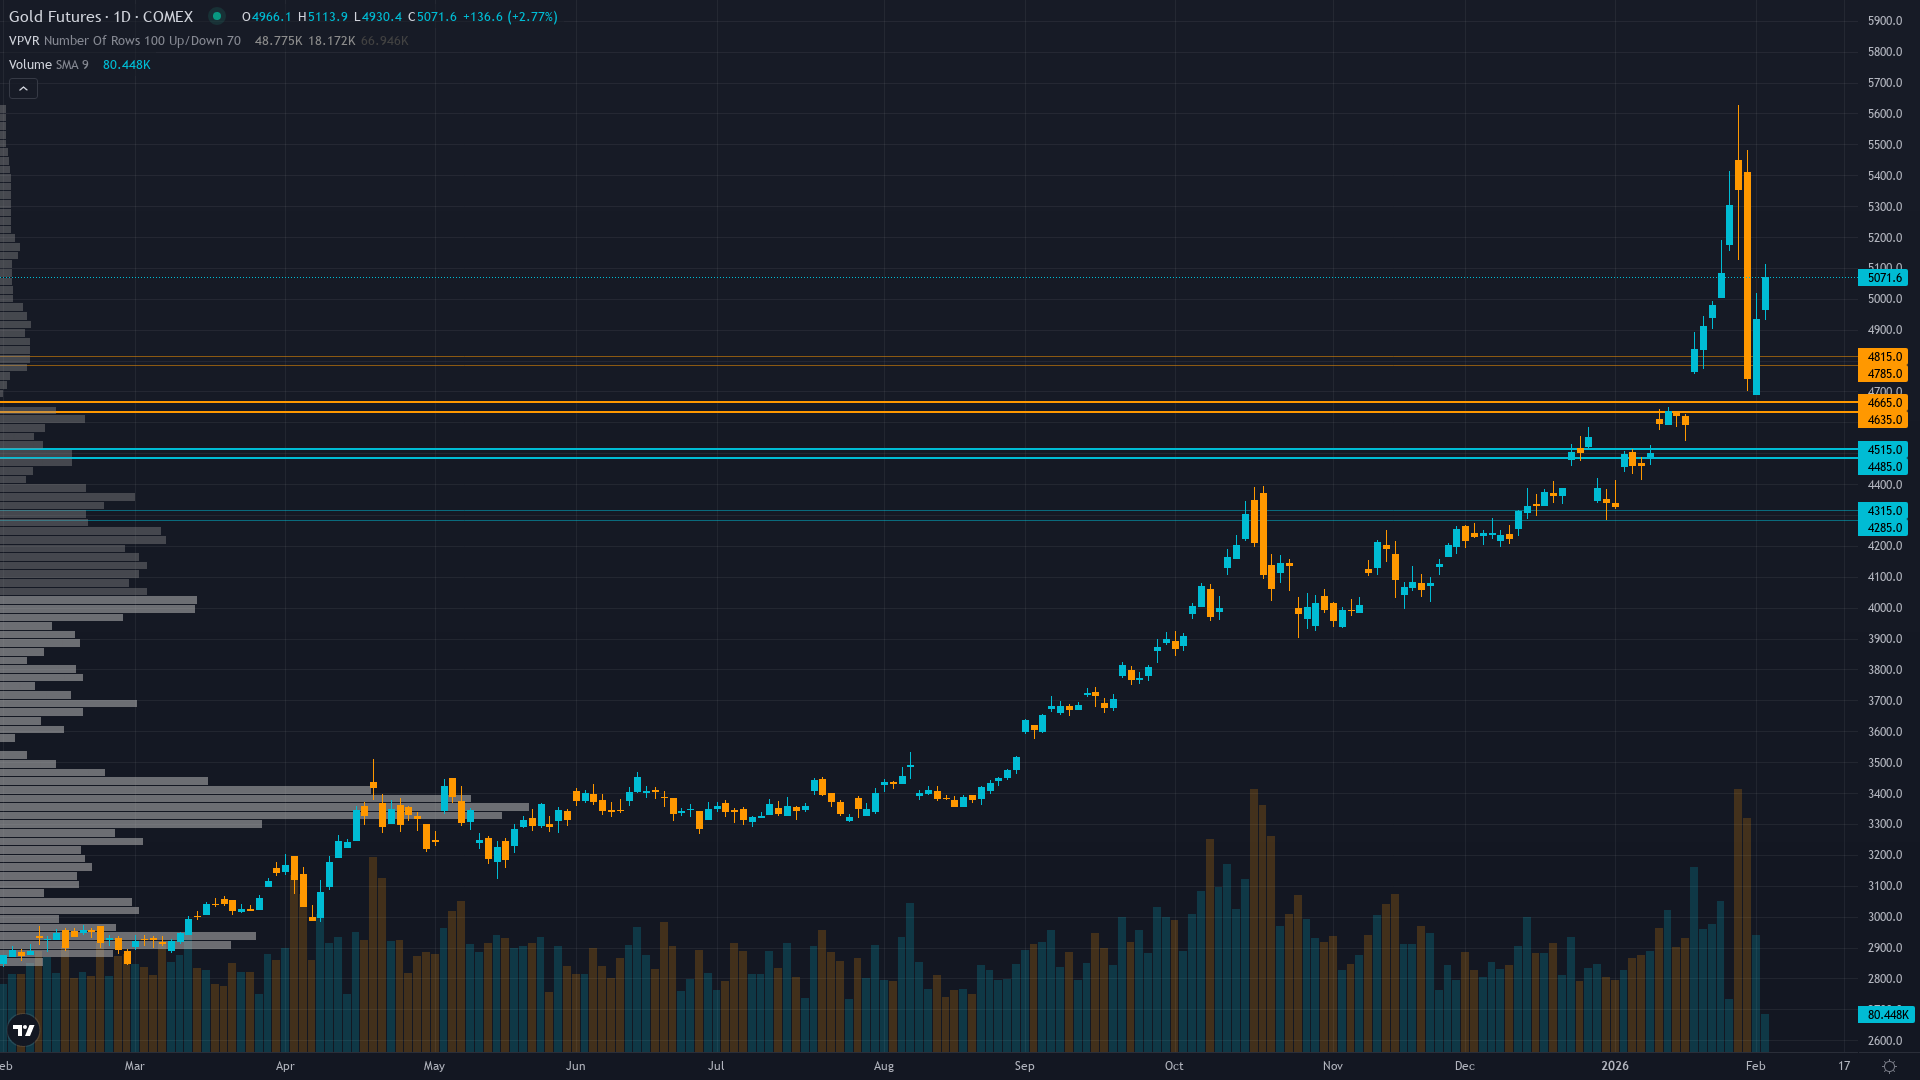
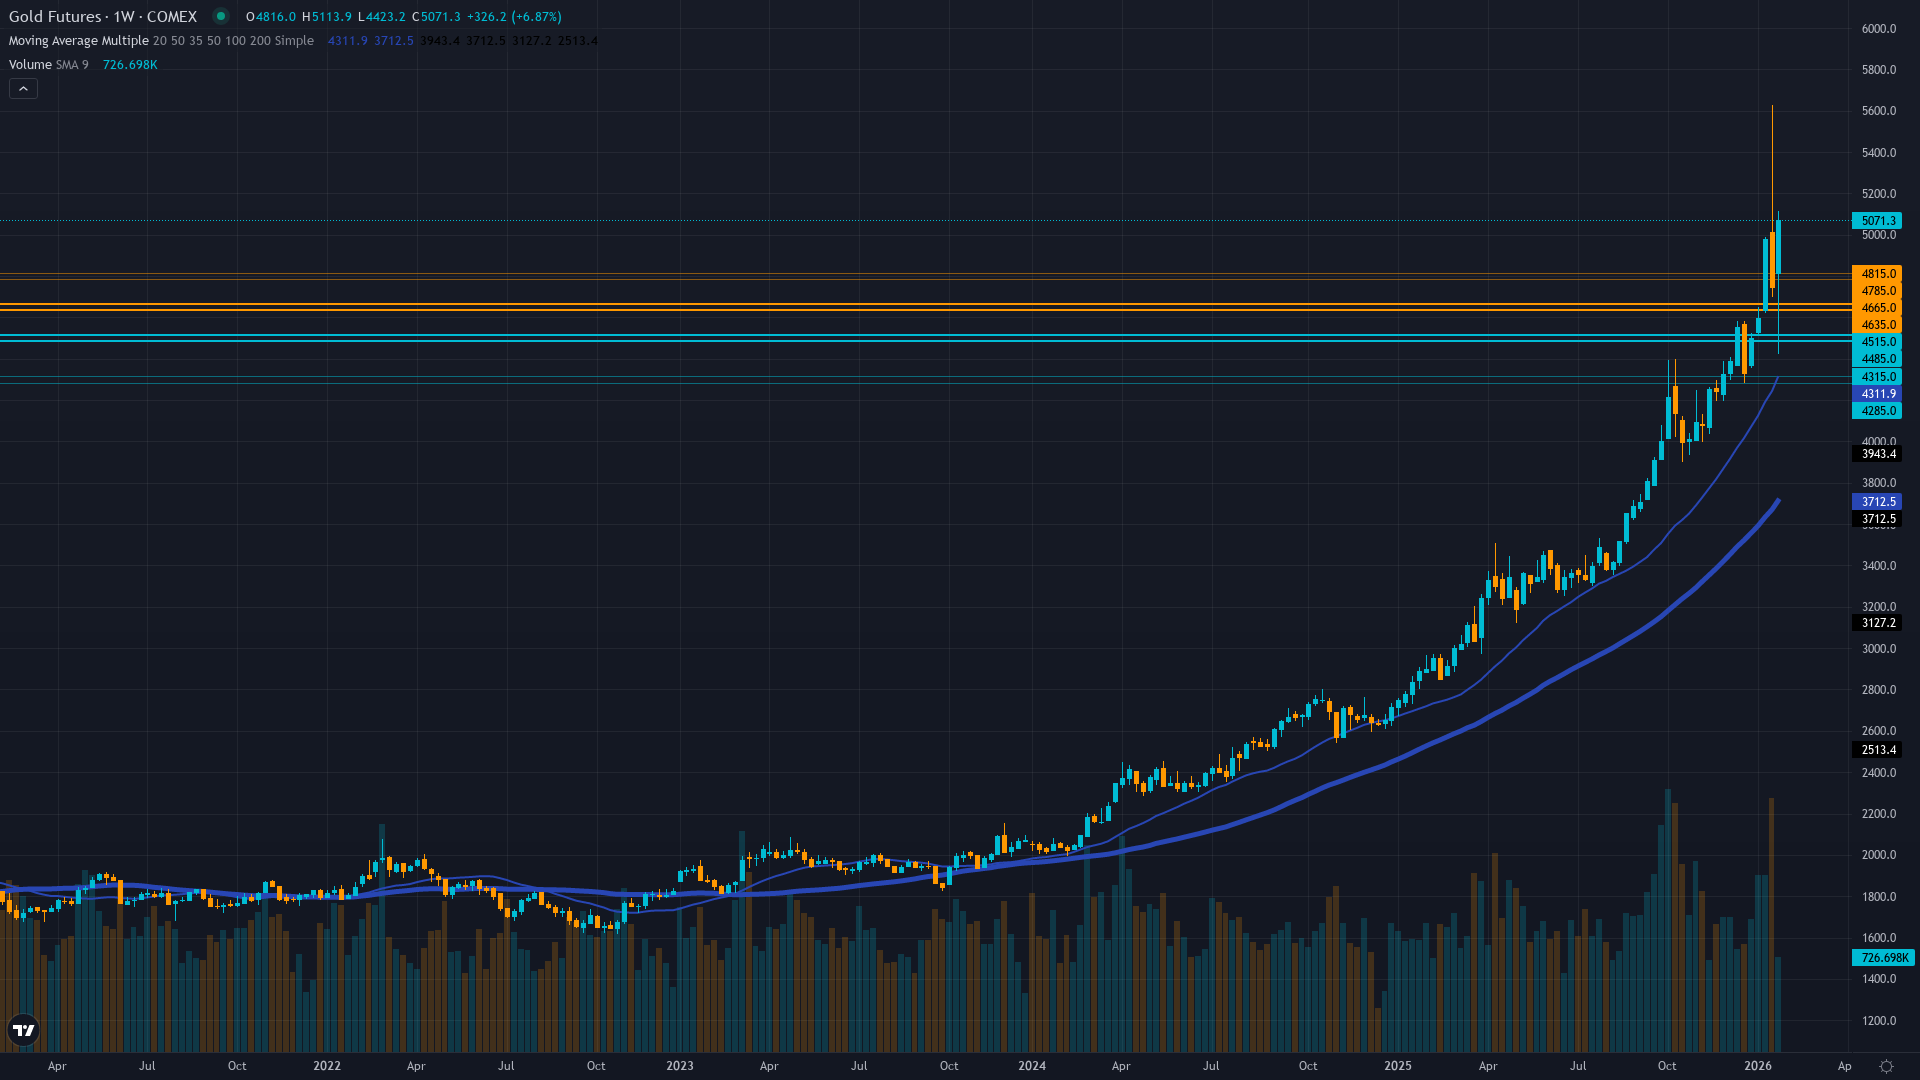
| ▲ Resistance Zone 2 | 4775 – 4825 |
| ▲ Resistance Zone 1 | 4625 – 4675 |
| ─ Pivot Area | ~4595 |
| ▼ Support Zone 1 | 4475 – 4525 |
| ▼ Support Zone 2 | 4275 – 4325 |
Consolidating at $4595 near December 2025 peak of $4650 with $4000 serving as major support rather than resistance marking historic paradigm shift in valuation regime
Exceptional structural support from Fed easing cycle paused at 3.5-3.75% following 100bp of 2025 cuts, persistent dollar weakness at multi-year lows, and permanent central bank reallocation accelerating into 2026
Central banks accumulated 297t YTD through November 2025 with 95% planning reserve increases while JP Morgan forecasts 585t quarterly demand in 2026 providing dual institutional conviction
GVZ volatility at 44.08 showing significantly elevated expectations in 52-week range 14.47-33.00 reflecting heightened uncertainty post-January FOMC pause with call activity clustering above $4700
Fed paused at January 29 meeting following 100bp of 2025 cuts maintaining 3.5-3.75% range, dollar at DXY 97.15 down 10% YTD, with March meeting next catalyst as markets reassess easing trajectory
Inverted - short term volatility at 22.5% significantly elevated above longer-term 19.2% indicating recent uncertainty spike
Post-FOMC pause volatility spikes historically compress within 10-15 days then resolve directionally; 70% of similar episodes during easing cycles continued higher within 30 days
High volatility regime day 5 typically lasts 7-12 days suggesting potential moderation into mid-February as market digests Fed pause, though GVZ at 44.08 indicates extreme fear premiums
Elevated volatility at 88th percentile requires wider stops with daily ranges potentially 3-5% versus normal 1.5-2%; breakouts from consolidation become highly reliable once volatility normalizes below 60th percentile
Current high volatility environment at $4595 with GVZ 44.08 suggests asymmetric 6-10% moves possible toward $4800-5000 versus 3-4% daily range; volatility spike creates tactical opportunity as mean reversion likely reduces risk premiums while structural support at $4300-4500 limits downside creating favorable 2:1 risk-reward skew
|
⚠️ Primary Risk
Extended Fed pause or hawkish pivot at upcoming meetings triggering dollar rebound from oversold levels causing profit-taking from elevated $4500-4600 consolidation area Probability: MEDIUM
|
✦ Primary Opportunity
February seasonality historically neutral-to-positive combined with ongoing central bank demand catalyzes continuation toward $4800-5000 zone if dollar weakness persists Timeframe: Next 4-6 weeks through March FOMC capitalizing on post-January consolidation and institutional positioning
|
Gold has reached a critical inflection point on February 1, 2026 at $4,595, consolidating near the psychologically critical $4,600 threshold following the extraordinary 67% rally in 2025 that decisively breached the historic $4,000 psychological level in October with December peak at $4,650. This represents a paradigm shift where $4,000 now serves as major support rather than resistance for the first time in history. The market is exhibiting post-catalyst consolidation following the January 29th FOMC meeting where the Fed paused its easing cycle at 3.5-3.75% after delivering 100bp of cuts in 2025, creating near-term uncertainty while the structural bull case remains unequivocally intact.
Current positioning at $4,595 represents healthy digestion of epic 2025 gains rather than trend reversal. The fundamental backdrop remains exceptionally supportive: the Fed's dovish stance despite the pause with markets pricing potential March resumption, systematic dollar weakness with DXY at 97.15 representing 10% YTD decline trading near multi-year lows, and most critically unprecedented central bank structural reallocation with 297 tonnes accumulated year-to-date through November as 95% of central banks plan reserve increases.
JP Morgan forecasts central bank and investor demand averaging 585 tonnes quarterly in 2026, projecting gold to reach $5,055 by Q4 2026, while State Street suggests potential $5,000 within months. February seasonality presents neutral-to-positive historical patterns, with gold showing variable performance though typically benefiting from continued safe-haven flows in uncertain environments. The volatility regime has spiked dramatically with GVZ at 44.08—the highest level in the 52-week range of 14.47-33.00—indicating significant market uncertainty as participants digest both the Fed pause and the extraordinary valuation levels.
Most significantly, central bank buying momentum continued into November 2025 with 45 tonnes net purchases bringing YTD to 297 tonnes, while record Q3 2025 ETF inflows of $26bn marked the strongest quarter ever recorded, confirming institutional conviction despite prices above $4,500. The negative real rates environment persists as Fed maintains accommodative stance while inflation remains sticky at 2.5% range, historically the most favorable backdrop for gold outperformance. Major institutions have converged on $4,800-5,200 targets for 2026 with several strategists seeing $6,000 as achievable by 2027.
The 52-week range of $2,672-$4,650 places current prices 72% above yearly lows, demonstrating the extraordinary structural appreciation throughout 2025. Current consolidation at $4,595 likely represents tactical pause within generational bull market rather than top, though elevated volatility signals near-term uncertainty as the market navigates the March Fed catalyst and reassesses the easing trajectory. Risk-reward remains constructive with robust downside support at $4,300-4,500 structural levels limiting correction risk to approximately 6-7%, while clear upside targets to $4,800-5,000 provide 4-9% potential.
This represents a definitive generational wealth transfer into hard assets as global monetary debasement accelerates and central banks strategically diversify away from dollar hegemony with gold establishing itself as monetary cornerstone of emerging multipolar financial system.
| Week | Bias | Confidence |
|---|---|---|
| February 1, 2026 | BULLISH | 8/10 |
| January 25, 2026 | BULLISH | 8/10 |
| January 18, 2026 | BULLISH | 8/10 |
| January 11, 2026 | BULLISH | 8/10 |
| January 4, 2026 | BULLISH | 8/10 |
| December 28, 2025 | BULLISH | 9/10 |
| December 21, 2025 | BULLISH | 8/10 |
| December 14, 2025 | BULLISH | 8/10 |
| December 7, 2025 | BULLISH | 8/10 |
| November 30, 2025 | BULLISH | 8/10 |
| November 23, 2025 | BULLISH | 8/10 |
| November 16, 2025 | BULLISH | 8/10 |


