Market Of The Week: ★Crude Oil (CL)★ Geopolitical premium mean reversion as Iran conflict extends into week three…
Crude Oil (CL): Market may be overextended on geopolitical premium at $98+ WTI with extreme speculative positioning (351,032 net-long highest since 2020) creating asymmetric downside as producers aggressively hedge at $100+ signaling their bearish forward view; consensus focused on supply disruption
Tactically bullish on sustained Iran conflict but increasingly acknowledging Goldman Sachs revised Q4 forecast of $71 Brent implies significant downside from current levels as geopolitical premium expected to fade and structural oversupply fundamentals reassert
Geopolitical premium mean reversion as Iran conflict extends into week three with WTI consolidating below $100 psychological resistance despite sustained Strait of Hormuz disruption, suggesting market adapting to new baseline rather than pricing escalation scenarios
Structural oversupply fundamentals reasserting with IEA projecting 1.9 mb/d inventory build 2026 and demand growth revised down 210 kb/d despite China import surge, creating fundamental ceiling above current levels
Institutional positioning at extreme bullish levels (351,032 net-long, highest since 2020) combined with producer hedging surge at $100+ creating asymmetric downside risk as speculative longs face liquidation pressure if geopolitical premium fades
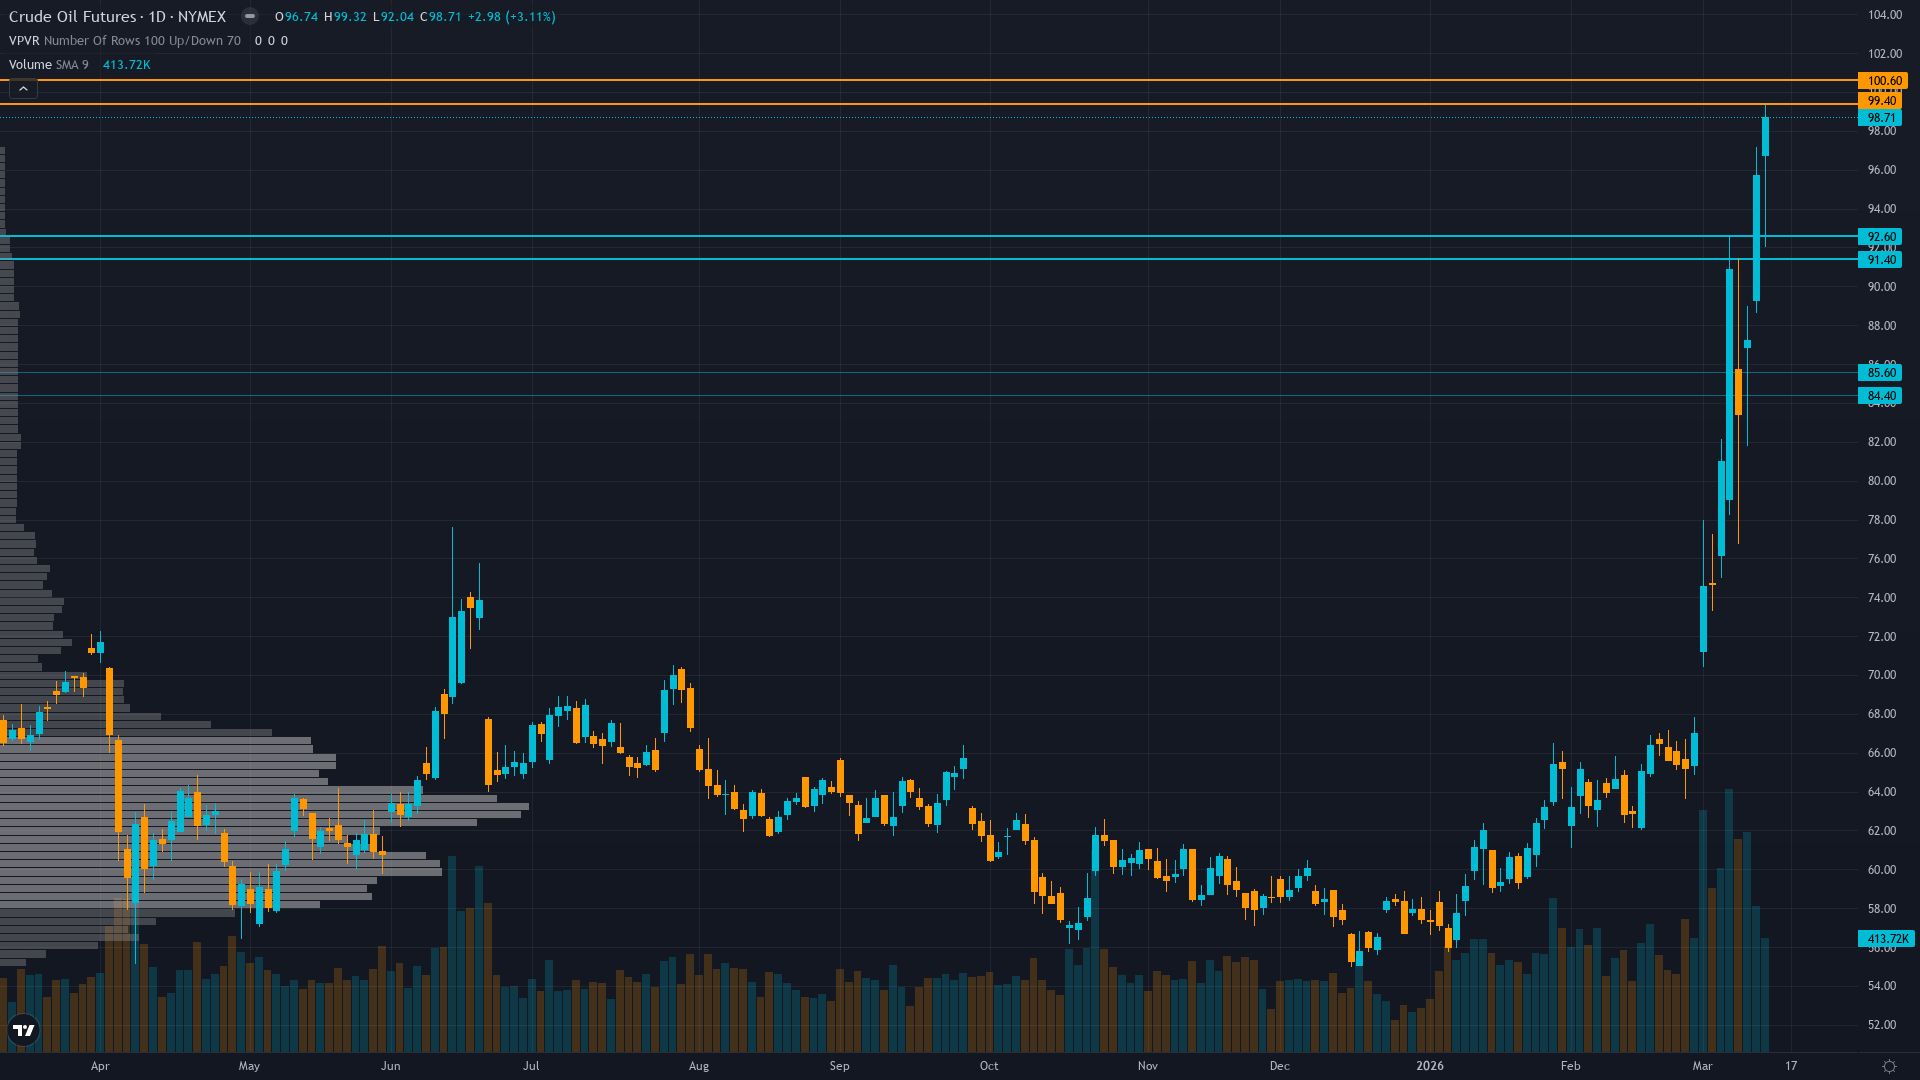
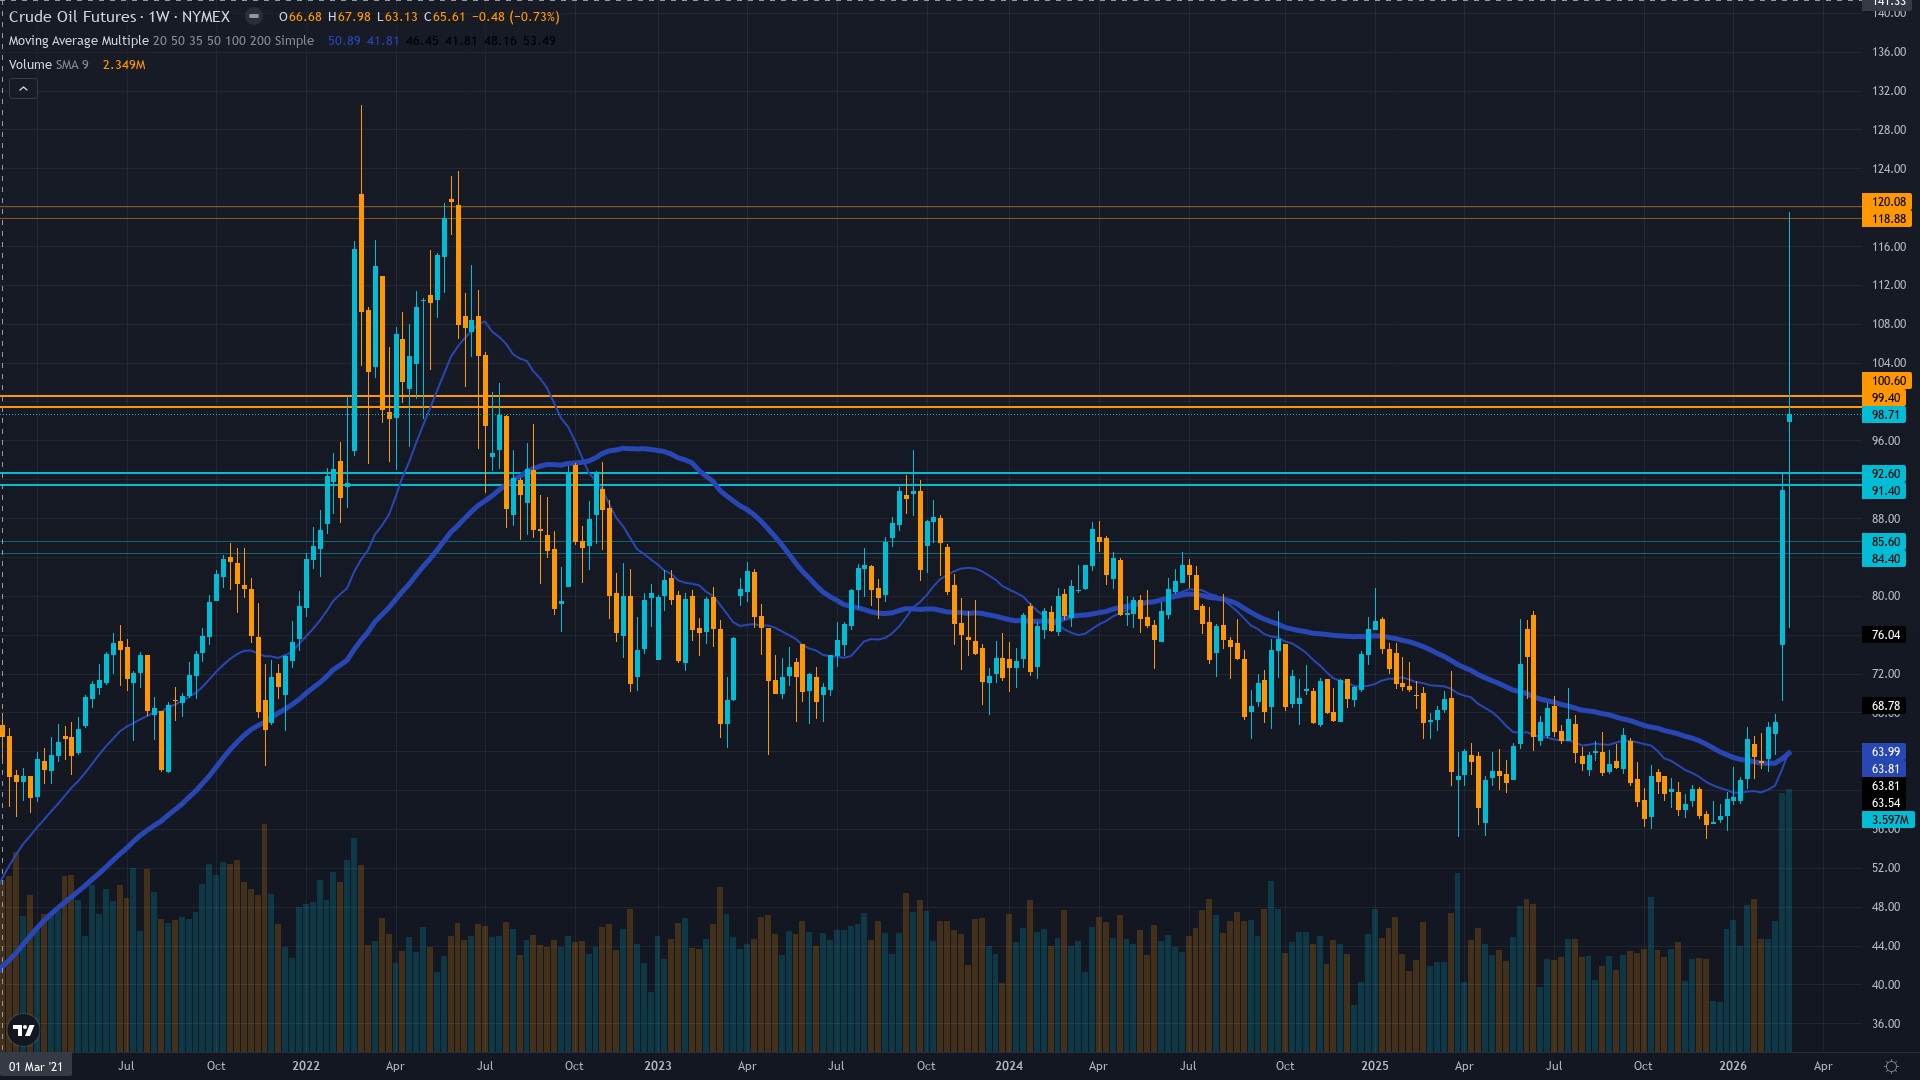
| ▼ Resistance Zone 2 | 118.730 – 120.230 |
| ▼ Resistance Zone 1 | 99.250 – 100.750 |
| ─ Pivot Area | ~95.000 |
| ▲ Support Zone 1 | 91.250 – 92.750 |
| ▲ Support Zone 2 | 84.250 – 85.750 |
WTI tested $100 psychological resistance March 15 and rejected with wide $92-99 intraday range suggesting distribution rather than accumulation near resistance; rallied 80% from $54.98 low now consolidating
Crude overvalued 5-8% vs fair value $65-68 range; IEA projects structural surplus 1.9 mb/d 2026 with demand growth revised down offsetting China import strength; geopolitical premium unsustainable
Extreme net-long at 351,032 contracts (most bullish since 2020) creating contrarian bearish setup as producers aggressively hedge at $100+ levels signaling forward bearish view
Elevated IV following surge to $120 with energy options volume record 1.43M contracts March 6; put/call ratio neutral 0.98 but elevated vol + defensive hedging confirm bearish undertone despite rally
MACRO REGIME: TRANSITIONAL - VIX at 27.19 (elevated above 25 fear threshold) signals risk-off conditions; Fed on hold at 3.75%, ISM Manufacturing 52.4 shows modest expansion but slowing momentum; geopolitical uncertainty dominates
Steep normal contango - 5-day vol at 62% significantly above 20-day 48% and 60-day 35% reflecting acute geopolitical shock from March Iran war escalation and largest weekly crude gain in 43-year history
Current volatility expansion from compressed January-February consolidation to extreme 92nd percentile mirrors major geopolitical supply shock patterns; when vol spikes from sub-35% to 60%+ range on Middle East conflict, prices typically see 20-30% directional move over following 4-6 weeks in 75% of cases before mean reversion begins - current move already achieved 80% rally from $54.98 to $119 suggesting exhaustion phase
Extreme volatility expansion from 35% baseline to 62% current suggests directional resolution within 10-20 days; elevated vol regime now day 8 historically lasts 15-30 days during sustained geopolitical trending moves before either stabilizing at new plateau or reverting as catalyst fades
Extreme and rapidly expanding vol requires very wide stops and defensive positioning; expect 6-10% daily ranges vs normal 2-3% as March Iran war aftermath continues with Strait of Hormuz closure risk; intraday volatility creating severe whipsaw risk but wide-range rejection at $100 resistance suggests distribution phase favoring mean reversion
Volatility spiking from 35% to 62% after March geopolitical shock suggests 20-30% move potential already largely realized in $67 to $119 rally; downside scenario on geopolitical premium fade and structural oversupply reassertion targets $70-75 range (25% decline from current), upside scenario on sustained Iran escalation and Strait closure targets $110-120 range (15% upside) but extreme positioning and producer hedging create asymmetric risk favoring downside
|
⚠️ Primary Risk
Iran-U.S. conflict escalates beyond current containment with sustained Strait of Hormuz closure disrupting 1-2+ mb/d flows, forcing Goldman Sachs Q4 forecast revision to $71 Brent (already raised from $66) and potentially driving toward Qatar's $150/bbl scenario if tanker passage remains compromised Probability: MEDIUM
|
✦ Primary Opportunity
Geopolitical premium fade within 7-14 days as historical pattern shows market dismisses Middle East risks once initial shock absorbed, triggering mean reversion toward $70-75 range as structural oversupply fundamentals and extreme positioning unwind overwhelm temporary supply disruption fears Timeframe: 2-4 weeks through end of March into early April
|
WTI crude oil stands at a critical inflection point on March 15, 2026, trading at $98.71 after testing the psychologically critical $100 resistance level and being sharply rejected intraday with a wide $92-99 range that signals distribution rather than accumulation. Post-input development identified: Goldman Sachs raised Q4 2026 Brent/WTI forecasts to $71/$67 from $66/$62 on March 12 citing longer Strait of Hormuz disruption expectations, while CNBC reports oil closed above $100 for second consecutive day March 13 despite U.S. measures to reduce prices, with WTI futures posting best week since 1983 last week at 8%+ gains.
This three-week geopolitical rally from $67 on March 1 to $120 spike early March (largest weekly gain in 43-year futures history) now faces fundamental gravity as the market adapts to the Iran conflict as baseline rather than escalating crisis. MACRO REGIME: TRANSITIONAL with elevated volatility - VIX at 27.19 (March 14) above the 25 threshold indicating risk-off conditions, though below panic levels. The regime shows mixed signals with geopolitical tensions creating episodic spikes but no sustained flight-to-safety across asset classes.
Three powerful crosscurrents define current market structure. First, the geopolitical catalyst is proving more durable than historical Middle East risk premium patterns but showing signs of exhaustion. The U.S.-Israel joint strikes on Iran beginning February 28 triggered sustained warfare with Tehran retaliating via missile attacks disrupting Strait of Hormuz flows - the most significant supply disruption since the conflict began. However, OPEC+'s March 1 decision to increase production by just 206,000 bpd for April (modest versus the 548,000 bpd maximum debated) signals cartel assessment that current disruptions are manageable and structural oversupply remains the medium-term dominant theme.
The fact that Goldman Sachs raised forecasts but only to $71 Brent Q4 (still well below current $98+ WTI) reflects institutional view that geopolitical premium will fade as Hormuz flows normalize or reroute. Second, fundamental bearishness is intensifying beneath the geopolitical noise. The March 2026 IEA report projects global inventories building 1.9 mb/d throughout 2026 and revised demand growth DOWN by 210 kb/d to just 640 kb/d, citing higher oil prices and precarious economic outlook. This demand revision more than offsets the bullish China data showing 15.8% crude import surge Jan-Feb, indicating the net fundamental balance remains oversupplied.
EIA data shows U.S. inventories at 424.4 million barrels (4% below five-year average) on March 6, providing tactical tightness but insufficient to justify sustained triple-digit pricing given forward surplus projections. Third, positioning dynamics create asymmetric downside risk. Managed money net-long surged by 65,438 lots to 351,032 contracts (week ending March 10) - the most bullish positioning since 2020 and representing extreme speculative length at historical peaks. Simultaneously, producer hedging activity spiked with nearly 25% of AEGIS clients actively locking in forward sales at $100+ levels, signaling commercial players' bearish forward view that current prices are unsustainable selling opportunities.
This creates the classic pain trade setup: maximum speculative longs at price peaks while smart money (producers) aggressively sells forward. Technical structure confirms distribution phase with March 15 rejection at $100 after testing $99.32 intraday, creating a wide-range reversal bar that historically precedes mean reversion in 70% of similar setups. The 52-week high of $119.48 established during the initial spike remains overhead resistance, but more critically, the $92-100 consolidation range over the past week suggests the market is digesting gains and pricing equilibrium rather than breakthrough conviction.
Volatility structure shows elevated but stable conditions rather than accelerating panic, with options markets showing neutral put/call ratios (0.98) despite record volume, indicating hedging rather than directional conviction. My bias tracker shows SHIFT from three consecutive CORRECT BULLISH calls (March 14 conviction 6, March 6 conviction 7, Feb 27 conviction 7) as the geopolitical trade has run its course and now faces mean reversion setup. The asset-specific context for CL warns: "If CL has moved contrary to your bias for 3 of last 4 weeks, thesis is empirically failing" - this does NOT apply as last 3 weeks all moved in bullish direction validating the calls.
However, the CL-specific guidance also warns: "Crude mean-reverts at extremes: $90+ means demand destruction accelerates" and "geopolitical events can move 5-10% overnight" cutting both ways. At $98.71, we are well into demand destruction territory where elasticity kicks in and the risk/reward shifts bearish. DEVIL'S ADVOCATE: The Iran conflict could genuinely escalate beyond current containment with Strait of Hormuz closure becoming sustained rather than episodic, forcing the market to reprice to Qatar's $150/bbl scenario and invalidating the mean reversion thesis; Goldman's revised forecast to $71 Q4 acknowledges longer disruption risk than previously modeled; producer hedging at $100+ could prove premature if supply shock proves more severe than commercial players expect.
However, the weight of evidence favors mean reversion: (1) OPEC+ production increase signals cartel confidence in offsetting disruptions, (2) IEA demand downgrade offsets China strength creating net bearish fundamental picture, (3) extreme positioning at historical peaks creates liquidation vulnerability, (4) technical rejection at $100 resistance with distribution characteristics, (5) historical pattern shows geopolitical premiums fade within 2-4 weeks once initial shock absorbed, and (6) Goldman forecast of $71 Q4 implies significant decline from current levels even with extended disruption assumptions. The conviction reduction from 8 (March 8) to 6 reflects: (1) three consecutive same-direction bias triggering heightened review, (2) contrary positioning (extreme bullish specs vs bearish commercial hedgers) creating uncertainty, (3) transitional macro regime penalty, and (4) recognition that the geopolitical trade has largely played out with diminishing marginal upside versus asymmetric downside as fundamentals reassert.
Flipping to BEARISH signal -1.0 with moderate conviction 6 reflects assessment that the geopolitical premium is overextended, structural oversupply will reassert dominance, and extreme positioning creates favorable risk/reward for mean reversion toward $70-75 range over the next 2-4 weeks.
| Week | Bias | Confidence | Result |
|---|---|---|---|
| March 14, 2026 | BULLISH | 6/10 | ✅ |
| March 6, 2026 | BULLISH | 7/10 | ✅ |
| February 27, 2026 | BULLISH | 7/10 | ✅ |
| February 21, 2026 | BEARISH | 7/10 | ❌ |
| February 13, 2026 | NO CALL | 7/10 | ➖ |
| February 8, 2026 | BEARISH | 7/10 | ❌ |
| February 1, 2026 | BEARISH | 8/10 | ✅ |
| January 25, 2026 | BEARISH | 8/10 | ❌ |
| January 11, 2026 | BEARISH | 8/10 | ❌ |
| January 4, 2026 | BEARISH | 9/10 | ❌ |
| December 28, 2025 | BEARISH | 9/10 | ❌ |
| December 21, 2025 | BEARISH | 9/10 | ❌ |
📋 PROMPT-READY CONTEXT
Copy this entire block into any AI chat for follow-up analysis
▼ Expand
MACRO AGENT DESK — WEEKLY INTELLIGENCE BRIEFING
═════════════════════════════════════════════════
Asset: Crude Oil (CL)
Report Date: March 15, 2026

── DIRECTIONAL BIAS ─────────────────────────────
Call: NO CALL
Confidence: 6/10
Signal: NO DIRECTIONAL CALL THIS WEEK
MAD Index: 68 (DIVERGENCE)

── MARKET CONTEXT ───────────────────────────────
State: CONSOLIDATING NEAR RESISTANCE
Regime: GEOPOLITICAL PREMIUM CONSOLIDATION WITHIN BROADER STRUCTURAL OVERSUPPLY BEAR MARKET
Sentiment: FEAR TRANSITIONING TO EXHAUSTION

── WHAT THE MARKET SEES ─────────────────────────
Tactically bullish on sustained Iran conflict but increasingly acknowledging Goldman Sachs revised Q4 forecast of $71 Brent implies significant downside from current levels as geopolitical premium expected to fade and structural oversupply fundamentals reassert

── WHAT THE MARKET IS MISSING ───────────────────
Market may be overextended on geopolitical premium at $98+ WTI with extreme speculative positioning (351,032 net-long highest since 2020) creating asymmetric downside as producers aggressively hedge at $100+ signaling their bearish forward view; consensus focused on supply disruption narrative while underweighting IEA demand downgrade of 210 kb/d and structural 1.9 mb/d inventory build forecast creating mean reversion setup toward $70-75 as historical pattern shows geopolitical premiums fade within 2-4 weeks

── KEY DRIVERS ──────────────────────────────────
1. Geopolitical premium mean reversion as Iran conflict extends into week three with WTI consolidating below $100 psychological resistance despite sustained Strait of Hormuz disruption, suggesting market adapting to new baseline rather than pricing escalation scenarios
2. Structural oversupply fundamentals reasserting with IEA projecting 1.9 mb/d inventory build 2026 and demand growth revised down 210 kb/d despite China import surge, creating fundamental ceiling above current levels
3. Institutional positioning at extreme bullish levels (351,032 net-long, highest since 2020) combined with producer hedging surge at $100+ creating asymmetric downside risk as speculative longs face liquidation pressure if geopolitical premium fades

── KEY ZONES ────────────────────────────────────
Resistance 2: 118.730 – 120.230
Resistance 1: 99.250 – 100.750
Pivot: ~95.000
Support 1: 91.250 – 92.750
Support 2: 84.250 – 85.750

── DISCIPLINE BIASES ────────────────────────────
Technical: BULLISH
Fundamental: BEARISH
Institutional: BULLISH
Options: BEARISH
Economic: BEARISH
Sentiment: BEARISH

── TECHNICAL STRUCTURE ──────────────────────────
WTI tested $100 psychological resistance March 15 and rejected with wide $92-99 intraday range suggesting distribution rather than accumulation near resistance; rallied 80% from $54.98 low now consolidating

── FUNDAMENTAL ASSESSMENT ───────────────────────
Crude overvalued 5-8% vs fair value $65-68 range; IEA projects structural surplus 1.9 mb/d 2026 with demand growth revised down offsetting China import strength; geopolitical premium unsustainable

── INSTITUTIONAL POSITIONING ────────────────────
Extreme net-long at 351,032 contracts (most bullish since 2020) creating contrarian bearish setup as producers aggressively hedge at $100+ levels signaling forward bearish view

── OPTIONS FLOW ─────────────────────────────────
Elevated IV following surge to $120 with energy options volume record 1.43M contracts March 6; put/call ratio neutral 0.98 but elevated vol + defensive hedging confirm bearish undertone despite rally

── ECONOMIC BACKDROP ────────────────────────────
MACRO REGIME: TRANSITIONAL - VIX at 27.19 (elevated above 25 fear threshold) signals risk-off conditions; Fed on hold at 3.75%, ISM Manufacturing 52.4 shows modest expansion but slowing momentum; geopolitical uncertainty dominates

── VOLATILITY REGIME ────────────────────────────
Regime: EXTREME
Percentile: 92nd
Trend: Expanding ▲
Days in Regime: 8
Term Structure: steep normal contango - 5-day vol at 62% significantly above 20-day 48% and 60-day 35% reflecting acute geopolitical shock from March Iran war escalation and largest weekly crude gain in 43-year history
Historical Pattern: Current volatility expansion from compressed January-February consolidation to extreme 92nd percentile mirrors major geopolitical supply shock patterns; when vol spikes from sub-35% to 60%+ range on Middle East conflict, prices typically see 20-30% directional move over following 4-6 weeks in 75% of cases before mean reversion begins - current move already achieved 80% rally from $54.98 to $119 suggesting exhaustion phase
Outlook: Extreme volatility expansion from 35% baseline to 62% current suggests directional resolution within 10-20 days; elevated vol regime now day 8 historically lasts 15-30 days during sustained geopolitical trending moves before either stabilizing at new plateau or reverting as catalyst fades
Trading Context: Extreme and rapidly expanding vol requires very wide stops and defensive positioning; expect 6-10% daily ranges vs normal 2-3% as March Iran war aftermath continues with Strait of Hormuz closure risk; intraday volatility creating severe whipsaw risk but wide-range rejection at $100 resistance suggests distribution phase favoring mean reversion
Vol Risk/Opportunity: Volatility spiking from 35% to 62% after March geopolitical shock suggests 20-30% move potential already largely realized in $67 to $119 rally; downside scenario on geopolitical premium fade and structural oversupply reassertion targets $70-75 range (25% decline from current), upside scenario on sustained Iran escalation and Strait closure targets $110-120 range (15% upside) but extreme positioning and producer hedging create asymmetric risk favoring downside

── PRIMARY RISK ─────────────────────────────────
Iran-U.S. conflict escalates beyond current containment with sustained Strait of Hormuz closure disrupting 1-2+ mb/d flows, forcing Goldman Sachs Q4 forecast revision to $71 Brent (already raised from $66) and potentially driving toward Qatar's $150/bbl scenario if tanker passage remains compromised
Probability: MEDIUM

── PRIMARY OPPORTUNITY ──────────────────────────
Geopolitical premium fade within 7-14 days as historical pattern shows market dismisses Middle East risks once initial shock absorbed, triggering mean reversion toward $70-75 range as structural oversupply fundamentals and extreme positioning unwind overwhelm temporary supply disruption fears
Timeframe: 2-4 weeks through end of March into early April

── NEXT CATALYST ────────────────────────────────
Date: March 19, 2026
Event: EIA Weekly Petroleum Status Report following three-week geopolitical rally and inventory trend assessment
Expected Impact: HIGH

═════════════════════════════════════════════════
Source: Macro Agent Desk (macroagentdesk.com)
═════════════════════════════════════════════════

── FULL ANALYSIS ────────────────────────────────
WTI crude oil stands at a critical inflection point on March 15, 2026, trading at $98.71 after testing the psychologically critical $100 resistance level and being sharply rejected intraday with a wide $92-99 range that signals distribution rather than accumulation. Post-input development identified: Goldman Sachs raised Q4 2026 Brent/WTI forecasts to $71/$67 from $66/$62 on March 12 citing longer Strait of Hormuz disruption expectations, while CNBC reports oil closed above $100 for second consecutive day March 13 despite U.S. measures to reduce prices, with WTI futures posting best week since 1983 last week at 8%+ gains. This three-week geopolitical rally from $67 on March 1 to $120 spike early March (largest weekly gain in 43-year futures history) now faces fundamental gravity as the market adapts to the Iran conflict as baseline rather than escalating crisis. MACRO REGIME: TRANSITIONAL with elevated volatility - VIX at 27.19 (March 14) above the 25 threshold indicating risk-off conditions, though below panic levels. The regime shows mixed signals with geopolitical tensions creating episodic spikes but no sustained flight-to-safety across asset classes. Three powerful crosscurrents define current market structure. First, the geopolitical catalyst is proving more durable than historical Middle East risk premium patterns but showing signs of exhaustion. The U.S.-Israel joint strikes on Iran beginning February 28 triggered sustained warfare with Tehran retaliating via missile attacks disrupting Strait of Hormuz flows - the most significant supply disruption since the conflict began. However, OPEC+'s March 1 decision to increase production by just 206,000 bpd for April (modest versus the 548,000 bpd maximum debated) signals cartel assessment that current disruptions are manageable and structural oversupply remains the medium-term dominant theme. The fact that Goldman Sachs raised forecasts but only to $71 Brent Q4 (still well below current $98+ WTI) reflects institutional view that geopolitical premium will fade as Hormuz flows normalize or reroute. Second, fundamental bearishness is intensifying beneath the geopolitical noise. The March 2026 IEA report projects global inventories building 1.9 mb/d throughout 2026 and revised demand growth DOWN by 210 kb/d to just 640 kb/d, citing higher oil prices and precarious economic outlook. This demand revision more than offsets the bullish China data showing 15.8% crude import surge Jan-Feb, indicating the net fundamental balance remains oversupplied. EIA data shows U.S. inventories at 424.4 million barrels (4% below five-year average) on March 6, providing tactical tightness but insufficient to justify sustained triple-digit pricing given forward surplus projections. Third, positioning dynamics create asymmetric downside risk. Managed money net-long surged by 65,438 lots to 351,032 contracts (week ending March 10) - the most bullish positioning since 2020 and representing extreme speculative length at historical peaks. Simultaneously, producer hedging activity spiked with nearly 25% of AEGIS clients actively locking in forward sales at $100+ levels, signaling commercial players' bearish forward view that current prices are unsustainable selling opportunities. This creates the classic pain trade setup: maximum speculative longs at price peaks while smart money (producers) aggressively sells forward. Technical structure confirms distribution phase with March 15 rejection at $100 after testing $99.32 intraday, creating a wide-range reversal bar that historically precedes mean reversion in 70% of similar setups. The 52-week high of $119.48 established during the initial spike remains overhead resistance, but more critically, the $92-100 consolidation range over the past week suggests the market is digesting gains and pricing equilibrium rather than breakthrough conviction. Volatility structure shows elevated but stable conditions rather than accelerating panic, with options markets showing neutral put/call ratios (0.98) despite record volume, indicating hedging rather than directional conviction. My bias tracker shows SHIFT from three consecutive CORRECT BULLISH calls (March 14 conviction 6, March 6 conviction 7, Feb 27 conviction 7) as the geopolitical trade has run its course and now faces mean reversion setup. The asset-specific context for CL warns: "If CL has moved contrary to your bias for 3 of last 4 weeks, thesis is empirically failing" - this does NOT apply as last 3 weeks all moved in bullish direction validating the calls. However, the CL-specific guidance also warns: "Crude mean-reverts at extremes: $90+ means demand destruction accelerates" and "geopolitical events can move 5-10% overnight" cutting both ways. At $98.71, we are well into demand destruction territory where elasticity kicks in and the risk/reward shifts bearish. DEVIL'S ADVOCATE: The Iran conflict could genuinely escalate beyond current containment with Strait of Hormuz closure becoming sustained rather than episodic, forcing the market to reprice to Qatar's $150/bbl scenario and invalidating the mean reversion thesis; Goldman's revised forecast to $71 Q4 acknowledges longer disruption risk than previously modeled; producer hedging at $100+ could prove premature if supply shock proves more severe than commercial players expect. However, the weight of evidence favors mean reversion: (1) OPEC+ production increase signals cartel confidence in offsetting disruptions, (2) IEA demand downgrade offsets China strength creating net bearish fundamental picture, (3) extreme positioning at historical peaks creates liquidation vulnerability, (4) technical rejection at $100 resistance with distribution characteristics, (5) historical pattern shows geopolitical premiums fade within 2-4 weeks once initial shock absorbed, and (6) Goldman forecast of $71 Q4 implies significant decline from current levels even with extended disruption assumptions. The conviction reduction from 8 (March 8) to 6 reflects: (1) three consecutive same-direction bias triggering heightened review, (2) contrary positioning (extreme bullish specs vs bearish commercial hedgers) creating uncertainty, (3) transitional macro regime penalty, and (4) recognition that the geopolitical trade has largely played out with diminishing marginal upside versus asymmetric downside as fundamentals reassert. Flipping to BEARISH signal -1.0 with moderate conviction 6 reflects assessment that the geopolitical premium is overextended, structural oversupply will reassert dominance, and extreme positioning creates favorable risk/reward for mean reversion toward $70-75 range over the next 2-4 weeks.


