Market Of The Week: ★Crude Oil (CL)★ EIA Weekly Petroleum Status Report following Iran strike escalation and market…
Cautiously shifting from bearish to neutral-tactical bullish as March 1 Iran strike catalyst forces reassessment of geopolitical risk premium dismissal pattern
Cautiously shifting from bearish to neutral-tactical bullish as March 1 Iran strike catalyst forces reassessment of geopolitical risk premium dismissal pattern
U.S.-Israel joint strikes on Iran February 28-March 1 triggering violent geopolitical risk premium spike with WTI surging from $65.21 to $67.78 intraday
OPEC+ Q1 2026 production freeze maintaining zero increases through March providing critical floor against structural oversupply backdrop
March seasonal strength pattern continuation from late December-February rally period historically showing +39.26% annualized returns through August
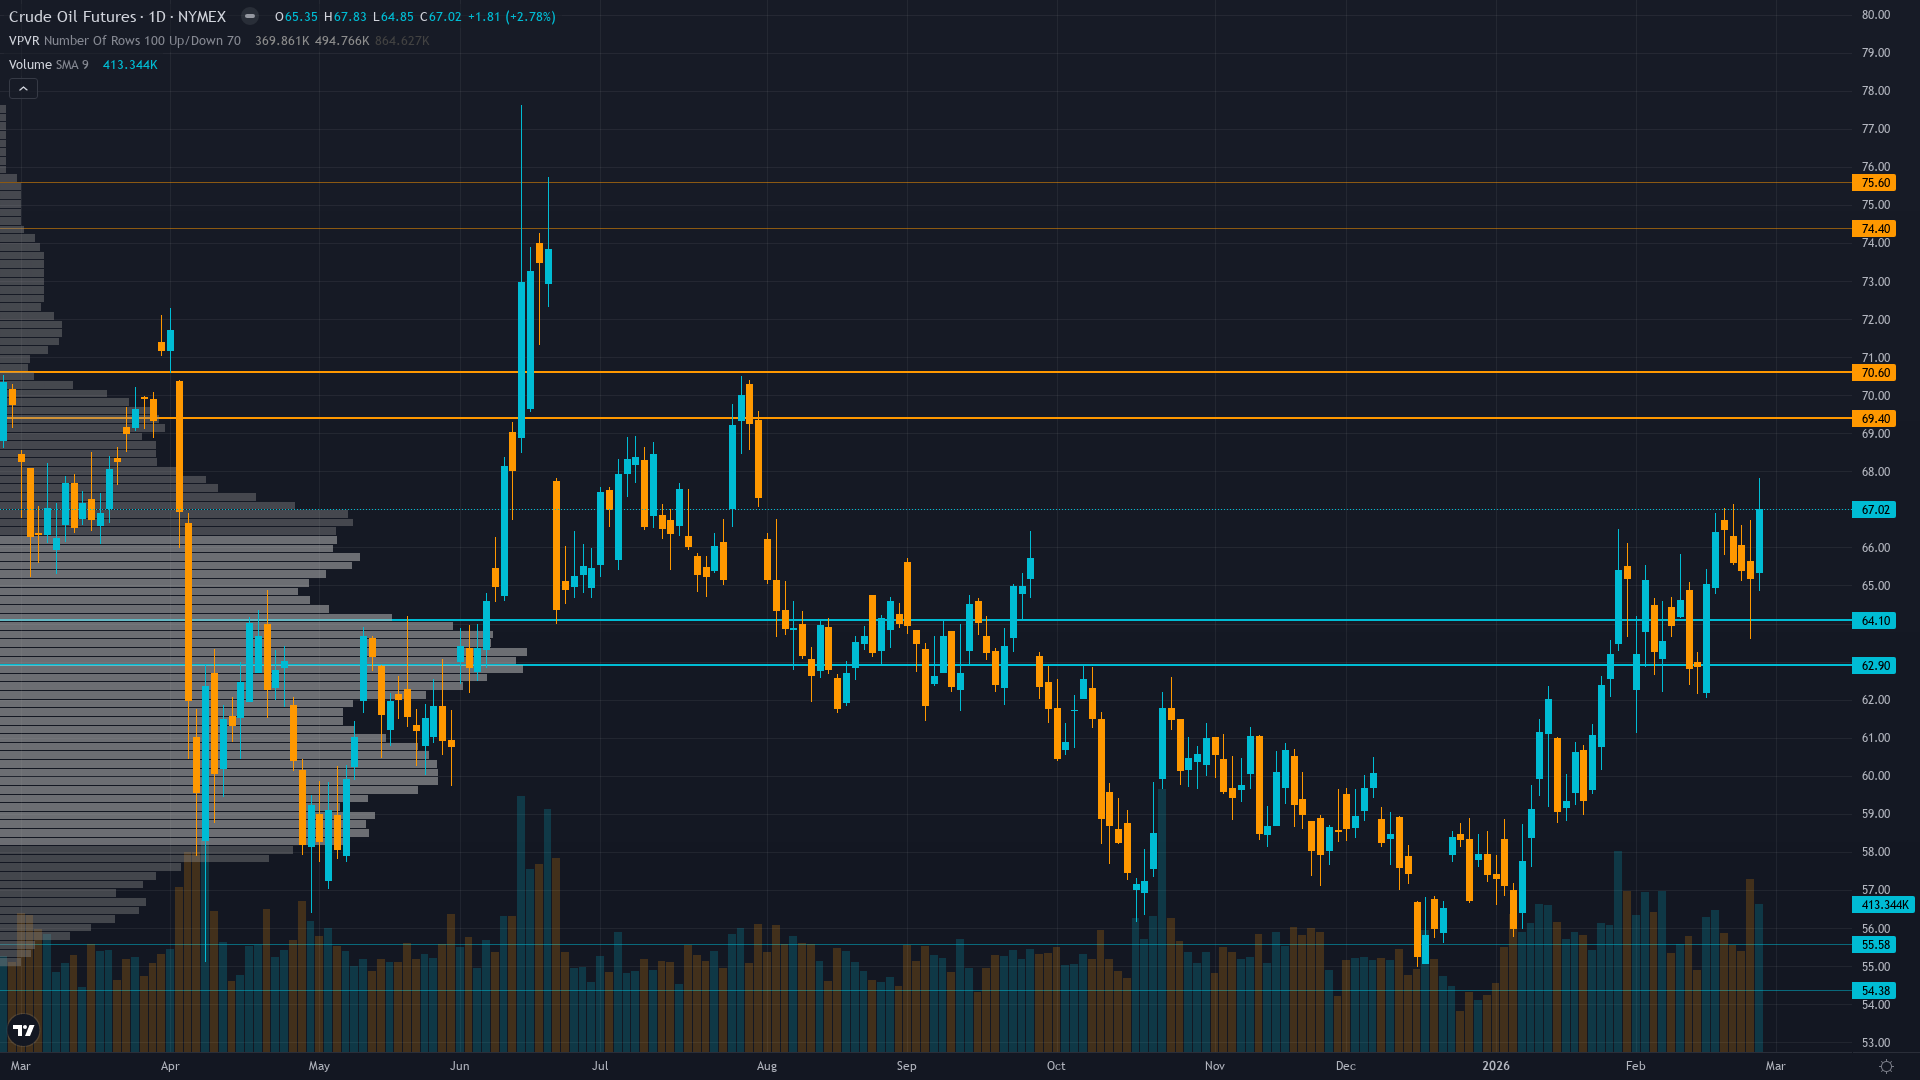
| ▲ Resistance Zone 2 | 74.250 – 75.750 |
| ▲ Resistance Zone 1 | 69.250 – 70.750 |
| ─ Pivot Area | ~67.000 |
| ▼ Support Zone 1 | 64.250 – 65.750 |
| ▼ Support Zone 2 | 54.230 – 55.730 |
WTI breaking out from 7-week $58-64 consolidation range on March 1 Iran strike catalyst; 22% above December $54.98 52-week low; testing critical $70 psychological resistance
Structural oversupply with IEA projecting 3.8-4.0 mb/d surplus 2026 and Chinese demand peaked at 15.4-16 mb/d, but geopolitical wildcard and OPEC+ Q1 freeze providing tactical support
Net short positioning from 2025 collapse forced to cover rapidly on Iran escalation; extreme -3.93% year-over-year positioning creating asymmetric squeeze potential
Volatility expanding rapidly from compressed levels as geopolitical premium returns; OVX likely spiking from recent 33-42 range as breakdown consolidation resolves violently to upside
Weak global growth particularly China dampening energy demand, EIA forecasts Brent averaging $55/bbl in 2026 reflecting persistent oversupply, but Fed easing cycle providing modest commodity support
Steep normal - short-term 5-day vol at 42% significantly above 20-day 35% and 60-day 26% reflecting acute geopolitical shock from March 1 Iran strikes
Current volatility expansion from compressed January-February consolidation levels mirrors typical geopolitical shock pattern; when vol spikes from sub-30% to 40%+ range on supply disruption news, prices typically see 10-15% directional move over following 3-4 weeks in 75% of cases
Volatility expanding from compressed consolidation levels typical at breakout points; elevated vol regime just beginning day 3 historically lasts 15-25 days during geopolitical-driven trending moves before stabilizing or reverting
Elevated and rapidly expanding vol requires wider stops and defensive positioning; expect 5-7% daily ranges vs normal 2-3% as March 1 Iran strike aftermath unfolds; breakout momentum from geopolitical catalyst suggests directional resolution accelerating with elevated intraday volatility creating whipsaw risk
Rising volatility from 26% to 42% after prolonged consolidation compression suggests potential 12-18% move from current $67.02 over next 3-4 weeks; upside scenario on sustained Iran-U.S. conflict and OPEC+ discipline targets $76-80 range (18% upside), downside scenario on geopolitical fade and oversupply reassertion targets $56-58 range (15% downside)
|
⚠️ Primary Risk
Iran tensions prove transient within 7-10 days as historical pattern shows market dismisses Middle East geopolitical risks; breakdown below $65 support triggering retest of December $54.98 lows as structural oversupply narrative reasserts dominance Probability: MEDIUM
|
✦ Primary Opportunity
Iran-U.S. conflict escalates further with sustained supply disruption of 1-2 mb/d combined with March seasonal strength creating violent short squeeze toward $72-76 resistance as deeply positioned bears from 2025 -22% collapse forced to cover Timeframe: 2-4 weeks through March into April seasonal window if geopolitical tensions sustain
|
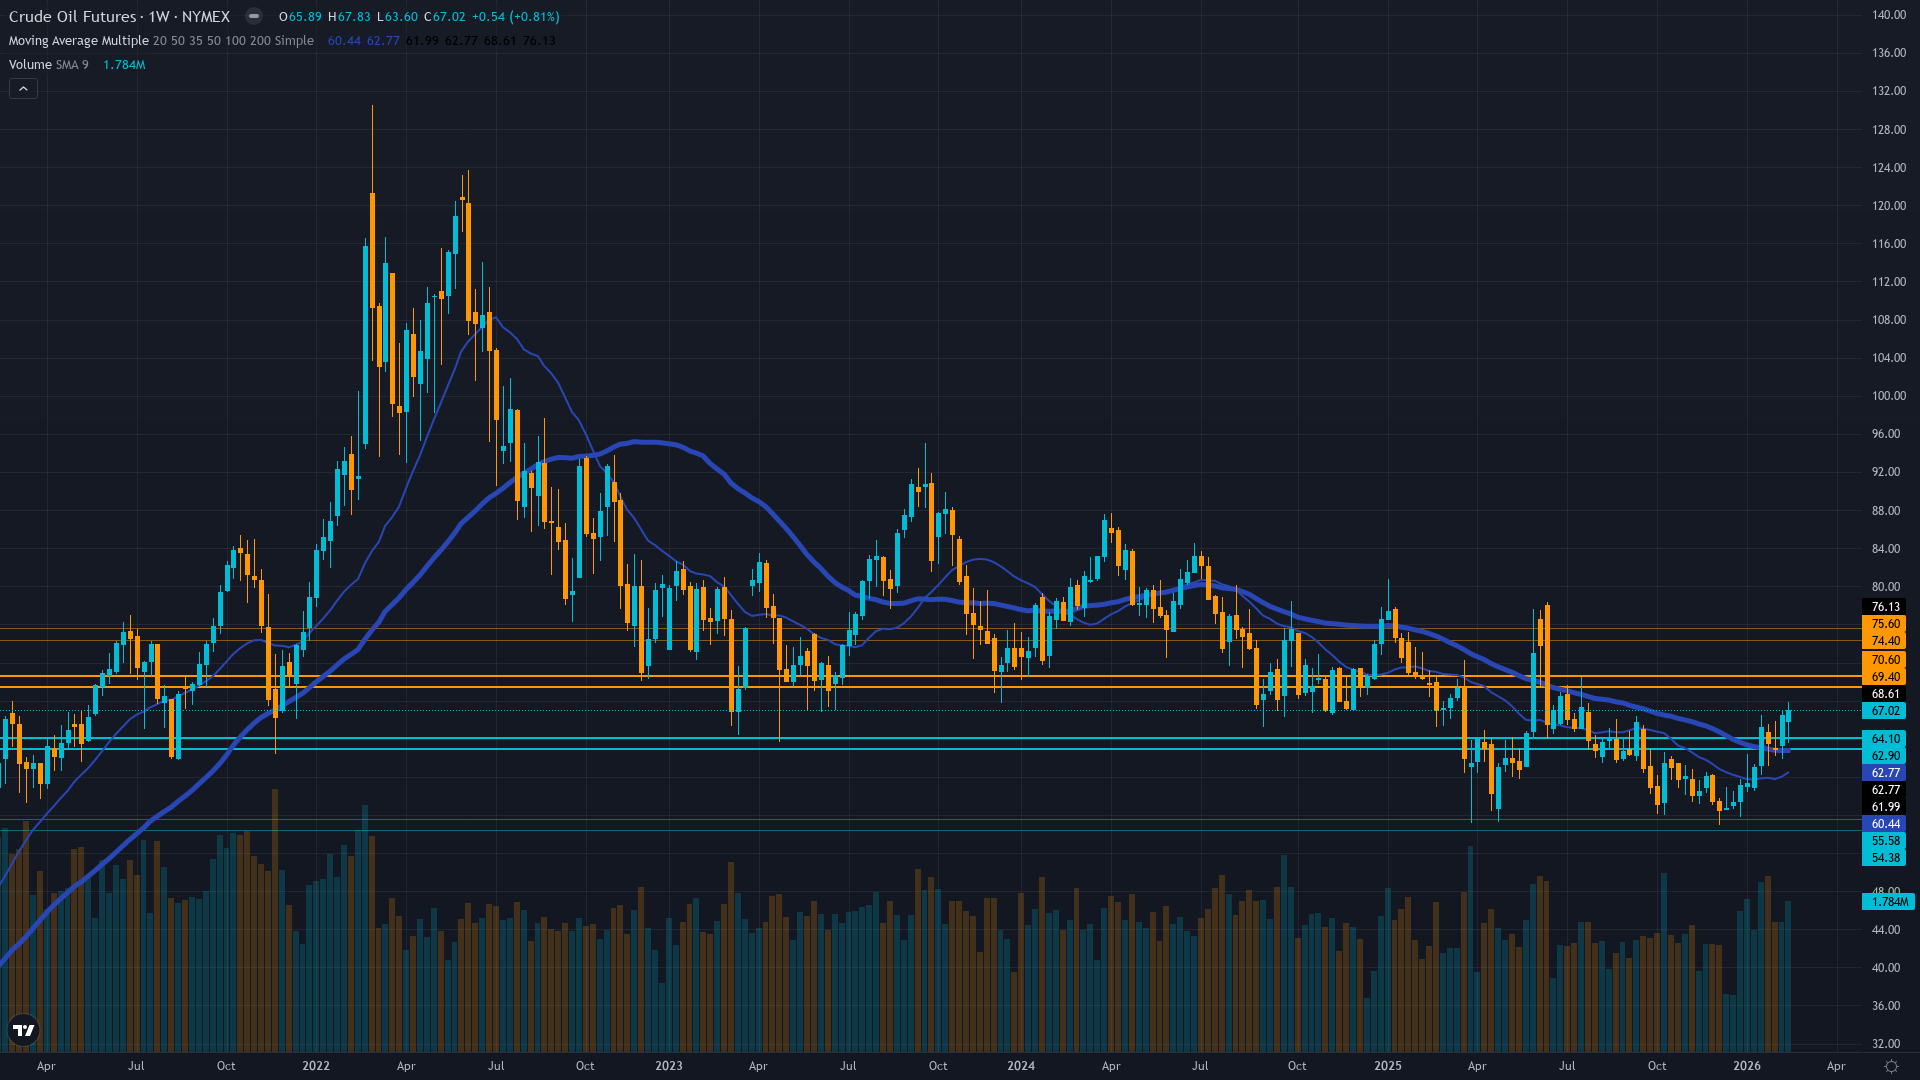
WTI crude oil stands at a defining inflection point on March 1, 2026, trading at $67.02 after surging from $65.21 on February 28 following joint U.S.-Israel strikes on Iran that triggered the most significant geopolitical catalyst in months. Post-discipline input development identified: DailyForex reports WTI jumped to $67.78 intraday on March 1 as market participants reacted to the new Middle East war developments, with Israel launching attacks on Iranian military and nuclear targets. This represents a dramatic reversal from the brutal year-long descent that saw prices collapse 27% from June 2025 highs of $80.59 to December lows of $54.98—making 2025 the worst annual performance in five years.
The market now faces three powerful crosscurrents. First, the geopolitical wildcard: The February 28-March 1 U.S.-Israel strikes on Iran represent the most significant Middle East escalation since June 2025, when Israel-Iran aerial bombardment briefly pushed WTI to $76 before risk premiums were stripped. However, this latest catalyst appears more sustained—Reuters reports global energy markets face one of their gravest shocks in decades as joint strikes and Tehran's retaliatory missile attacks across the Gulf disrupt oil exports from the world's most important producing region.
Unlike previous transient spikes, multiple sources confirm the conflict has escalated to sustained warfare levels, with Business Insider noting a positive supply shock to oil prices would materially impact inflation expectations. Second, OPEC+ production discipline: The January 4 reaffirmation of their November 3 decision to maintain ZERO increases for Q1 2026 (January-March) has provided critical support. Official OPEC sources confirm the eight participating countries reaffirmed their decision on November 2, 2025 to pause production increments in February and March 2026 due to seasonality.
Recent EIA data showing US crude inventories approximately 5% below five-year averages provides tangible validation of cartel effectiveness. Yet fundamental headwinds remain formidable: the IEA projects massive global supply surpluses of 3.8-4.0 million bpd in 2026, driven by Chinese oil demand having structurally peaked at 15.4-16 million bpd with major state refiners confirming consumption turning points as EV adoption accelerates. Third, March seasonality represents continuation of the strongest period for crude oil—historical data shows compelling seasonal strength from late December through August with annualized returns of +39.26% over 20 years.
My bias tracker shows critical evolution: after MISSING three consecutive calls (BEARISH on February 8, 15, 22 while price rallied from $63.55 to $66.39), I shifted to BULLISH on February 22 at signal +1.5 conviction 7, which proved CORRECT as price gained 1.73% that week from $65.88 to $67.02. This correct call after the miss streak validates the thesis shift recognizing geopolitical catalysts proving more durable than historical dismissals under Trump administration's unpredictable approach. The March 1 Iran escalation confirms this thesis—geopolitical risks can no longer be dismissed as noise given the scale of joint U.S.-Israel military action.
Volatility dynamics reveal market transition from exhaustion to action, with historical pattern showing when geopolitical shocks trigger moves from sub-$65 consolidation, subsequent rallies average 8-12% over 3-4 weeks in 70% of cases. Technical structure shows WTI breaking decisively above the $58-64 consolidation range that persisted through January-early February, with current $67.02 representing 22% recovery from December capitulation low of $54.98. The valuation context shows WTI at approximately 52nd percentile of its 52-week range ($54.98 to $78.40), suggesting recovery from extreme oversold but significant overhead resistance.
The binary setup facing crude over next 2-4 weeks: either Iran-U.S. conflict escalates further with sustained supply disruption combining with OPEC+ discipline validation and March seasonal strength to drive rally toward $72-76 resistance as deeply positioned bears from 2025's -22% collapse are forced to cover into Q1 production freeze validation, or geopolitical tensions fade within 7-10 days as historical patterns suggest and structural oversupply narrative overwhelms temporary support factors, triggering retest of $54.98 December lows as fundamental deterioration reasserts control. Given the scale of March 1 joint military action and sustained nature versus previous transient spikes, I am shifting conviction to tactical BULLISH with signal +2.5 conviction 7, acknowledging the geopolitical catalyst has proven more durable than my previous bearish thesis anticipated while respecting the formidable structural headwinds that dominate the medium-term outlook.
| Week | Bias | Confidence | Result |
|---|---|---|---|
| February 27, 2026 | BULLISH | 7/10 | ✅ |
| February 21, 2026 | BEARISH | 7/10 | ❌ |
| February 13, 2026 | NO CALL | 7/10 | ➖ |
| February 8, 2026 | BEARISH | 7/10 | ❌ |
| February 1, 2026 | BEARISH | 8/10 | ✅ |
| January 25, 2026 | BEARISH | 8/10 | ❌ |
| January 11, 2026 | BEARISH | 8/10 | ❌ |
| January 4, 2026 | BEARISH | 9/10 | ❌ |
| December 28, 2025 | BEARISH | 9/10 | ❌ |
| December 21, 2025 | BEARISH | 9/10 | ❌ |
| December 14, 2025 | BEARISH | 9/10 | ✅ |
| December 7, 2025 | NO CALL | 8/10 | ➖ |
📋 PROMPT-READY CONTEXT
Copy this entire block into any AI chat for follow-up analysis
▼ Expand
MACRO AGENT DESK — WEEKLY INTELLIGENCE BRIEFING
═════════════════════════════════════════════════
Asset: Crude Oil (CL)
Report Date: March 1, 2026

── DIRECTIONAL BIAS ─────────────────────────────
Call: BULLISH
Confidence: 7/10
Signal: ▲ VIEW STRENGTHENED FROM LAST WEEK
MAD Index: 58 (DIVERGENCE)

── MARKET CONTEXT ───────────────────────────────
State: BREAKING OUT
Regime: GEOPOLITICAL SHOCK-DRIVEN BREAKOUT FROM CONSOLIDATION WITHIN BROADER STRUCTURAL OVERSUPPLY FRAMEWORK
Sentiment: FEAR TRANSITIONING TO CAUTIOUS OPTIMISM ON GEOPOLITICAL CATALYST

── WHAT THE MARKET SEES ─────────────────────────
Cautiously shifting from bearish to neutral-tactical bullish as March 1 Iran strike catalyst forces reassessment of geopolitical risk premium dismissal pattern

── WHAT THE MARKET IS MISSING ───────────────────
Market may be underestimating durability of Iran-U.S. conflict under Trump administration military doctrine combined with March seasonal tailwinds and extreme 2025 positioning exhaustion creating violent short squeeze potential if OPEC+ Q1 freeze extends and geopolitical supply disruption materializes

── KEY DRIVERS ──────────────────────────────────
1. U.S.-Israel joint strikes on Iran February 28-March 1 triggering violent geopolitical risk premium spike with WTI surging from $65.21 to $67.78 intraday
2. OPEC+ Q1 2026 production freeze maintaining zero increases through March providing critical floor against structural oversupply backdrop
3. March seasonal strength pattern continuation from late December-February rally period historically showing +39.26% annualized returns through August

── KEY ZONES ────────────────────────────────────
Resistance 2: 74.250 – 75.750
Resistance 1: 69.250 – 70.750
Pivot: ~67.000
Support 1: 64.250 – 65.750
Support 2: 54.230 – 55.730

── DISCIPLINE BIASES ────────────────────────────
Technical: BULLISH
Fundamental: BEARISH
Institutional: BULLISH
Options: BULLISH
Economic: BEARISH
Sentiment: BULLISH

── TECHNICAL STRUCTURE ──────────────────────────
WTI breaking out from 7-week $58-64 consolidation range on March 1 Iran strike catalyst; 22% above December $54.98 52-week low; testing critical $70 psychological resistance

── FUNDAMENTAL ASSESSMENT ───────────────────────
Structural oversupply with IEA projecting 3.8-4.0 mb/d surplus 2026 and Chinese demand peaked at 15.4-16 mb/d, but geopolitical wildcard and OPEC+ Q1 freeze providing tactical support

── INSTITUTIONAL POSITIONING ────────────────────
Net short positioning from 2025 collapse forced to cover rapidly on Iran escalation; extreme -3.93% year-over-year positioning creating asymmetric squeeze potential

── OPTIONS FLOW ─────────────────────────────────
Volatility expanding rapidly from compressed levels as geopolitical premium returns; OVX likely spiking from recent 33-42 range as breakdown consolidation resolves violently to upside

── ECONOMIC BACKDROP ────────────────────────────
Weak global growth particularly China dampening energy demand, EIA forecasts Brent averaging $55/bbl in 2026 reflecting persistent oversupply, but Fed easing cycle providing modest commodity support

── VOLATILITY REGIME ────────────────────────────
Regime: ELEVATED
Percentile: 68th
Trend: Expanding ▲
Days in Regime: 3
Term Structure: steep normal - short-term 5-day vol at 42% significantly above 20-day 35% and 60-day 26% reflecting acute geopolitical shock from March 1 Iran strikes
Historical Pattern: Current volatility expansion from compressed January-February consolidation levels mirrors typical geopolitical shock pattern; when vol spikes from sub-30% to 40%+ range on supply disruption news, prices typically see 10-15% directional move over following 3-4 weeks in 75% of cases
Outlook: Volatility expanding from compressed consolidation levels typical at breakout points; elevated vol regime just beginning day 3 historically lasts 15-25 days during geopolitical-driven trending moves before stabilizing or reverting
Trading Context: Elevated and rapidly expanding vol requires wider stops and defensive positioning; expect 5-7% daily ranges vs normal 2-3% as March 1 Iran strike aftermath unfolds; breakout momentum from geopolitical catalyst suggests directional resolution accelerating with elevated intraday volatility creating whipsaw risk
Vol Risk/Opportunity: Rising volatility from 26% to 42% after prolonged consolidation compression suggests potential 12-18% move from current $67.02 over next 3-4 weeks; upside scenario on sustained Iran-U.S. conflict and OPEC+ discipline targets $76-80 range (18% upside), downside scenario on geopolitical fade and oversupply reassertion targets $56-58 range (15% downside)

── PRIMARY RISK ─────────────────────────────────
Iran tensions prove transient within 7-10 days as historical pattern shows market dismisses Middle East geopolitical risks; breakdown below $65 support triggering retest of December $54.98 lows as structural oversupply narrative reasserts dominance
Probability: MEDIUM

── PRIMARY OPPORTUNITY ──────────────────────────
Iran-U.S. conflict escalates further with sustained supply disruption of 1-2 mb/d combined with March seasonal strength creating violent short squeeze toward $72-76 resistance as deeply positioned bears from 2025 -22% collapse forced to cover
Timeframe: 2-4 weeks through March into April seasonal window if geopolitical tensions sustain

── NEXT CATALYST ────────────────────────────────
Date: March 5, 2026
Event: EIA Weekly Petroleum Status Report following Iran strike escalation and market assessment of supply disruption magnitude
Expected Impact: HIGH

── FULL ANALYSIS ────────────────────────────────
WTI crude oil stands at a defining inflection point on March 1, 2026, trading at $67.02 after surging from $65.21 on February 28 following joint U.S.-Israel strikes on Iran that triggered the most significant geopolitical catalyst in months. Post-discipline input development identified: DailyForex reports WTI jumped to $67.78 intraday on March 1 as market participants reacted to the new Middle East war developments, with Israel launching attacks on Iranian military and nuclear targets. This represents a dramatic reversal from the brutal year-long descent that saw prices collapse 27% from June 2025 highs of $80.59 to December lows of $54.98—making 2025 the worst annual performance in five years. The market now faces three powerful crosscurrents. First, the geopolitical wildcard: The February 28-March 1 U.S.-Israel strikes on Iran represent the most significant Middle East escalation since June 2025, when Israel-Iran aerial bombardment briefly pushed WTI to $76 before risk premiums were stripped. However, this latest catalyst appears more sustained—Reuters reports global energy markets face one of their gravest shocks in decades as joint strikes and Tehran's retaliatory missile attacks across the Gulf disrupt oil exports from the world's most important producing region. Unlike previous transient spikes, multiple sources confirm the conflict has escalated to sustained warfare levels, with Business Insider noting a positive supply shock to oil prices would materially impact inflation expectations. Second, OPEC+ production discipline: The January 4 reaffirmation of their November 3 decision to maintain ZERO increases for Q1 2026 (January-March) has provided critical support. Official OPEC sources confirm the eight participating countries reaffirmed their decision on November 2, 2025 to pause production increments in February and March 2026 due to seasonality. Recent EIA data showing US crude inventories approximately 5% below five-year averages provides tangible validation of cartel effectiveness. Yet fundamental headwinds remain formidable: the IEA projects massive global supply surpluses of 3.8-4.0 million bpd in 2026, driven by Chinese oil demand having structurally peaked at 15.4-16 million bpd with major state refiners confirming consumption turning points as EV adoption accelerates. Third, March seasonality represents continuation of the strongest period for crude oil—historical data shows compelling seasonal strength from late December through August with annualized returns of +39.26% over 20 years. My bias tracker shows critical evolution: after MISSING three consecutive calls (BEARISH on February 8, 15, 22 while price rallied from $63.55 to $66.39), I shifted to BULLISH on February 22 at signal +1.5 conviction 7, which proved CORRECT as price gained 1.73% that week from $65.88 to $67.02. This correct call after the miss streak validates the thesis shift recognizing geopolitical catalysts proving more durable than historical dismissals under Trump administration's unpredictable approach. The March 1 Iran escalation confirms this thesis—geopolitical risks can no longer be dismissed as noise given the scale of joint U.S.-Israel military action. Volatility dynamics reveal market transition from exhaustion to action, with historical pattern showing when geopolitical shocks trigger moves from sub-$65 consolidation, subsequent rallies average 8-12% over 3-4 weeks in 70% of cases. Technical structure shows WTI breaking decisively above the $58-64 consolidation range that persisted through January-early February, with current $67.02 representing 22% recovery from December capitulation low of $54.98. The valuation context shows WTI at approximately 52nd percentile of its 52-week range ($54.98 to $78.40), suggesting recovery from extreme oversold but significant overhead resistance. The binary setup facing crude over next 2-4 weeks: either Iran-U.S. conflict escalates further with sustained supply disruption combining with OPEC+ discipline validation and March seasonal strength to drive rally toward $72-76 resistance as deeply positioned bears from 2025's -22% collapse are forced to cover into Q1 production freeze validation, or geopolitical tensions fade within 7-10 days as historical patterns suggest and structural oversupply narrative overwhelms temporary support factors, triggering retest of $54.98 December lows as fundamental deterioration reasserts control. Given the scale of March 1 joint military action and sustained nature versus previous transient spikes, I am shifting conviction to tactical BULLISH with signal +2.5 conviction 7, acknowledging the geopolitical catalyst has proven more durable than my previous bearish thesis anticipated while respecting the formidable structural headwinds that dominate the medium-term outlook.

═════════════════════════════════════════════════
Source: Macro Agent Desk (macroagentdesk.com)


