Wheat Key Levels This Week — Support, Resistance & Confluence Zones
Wheat key levels breakdown: support zones, resistance zones, confluence and price structure.

Structural Assessment
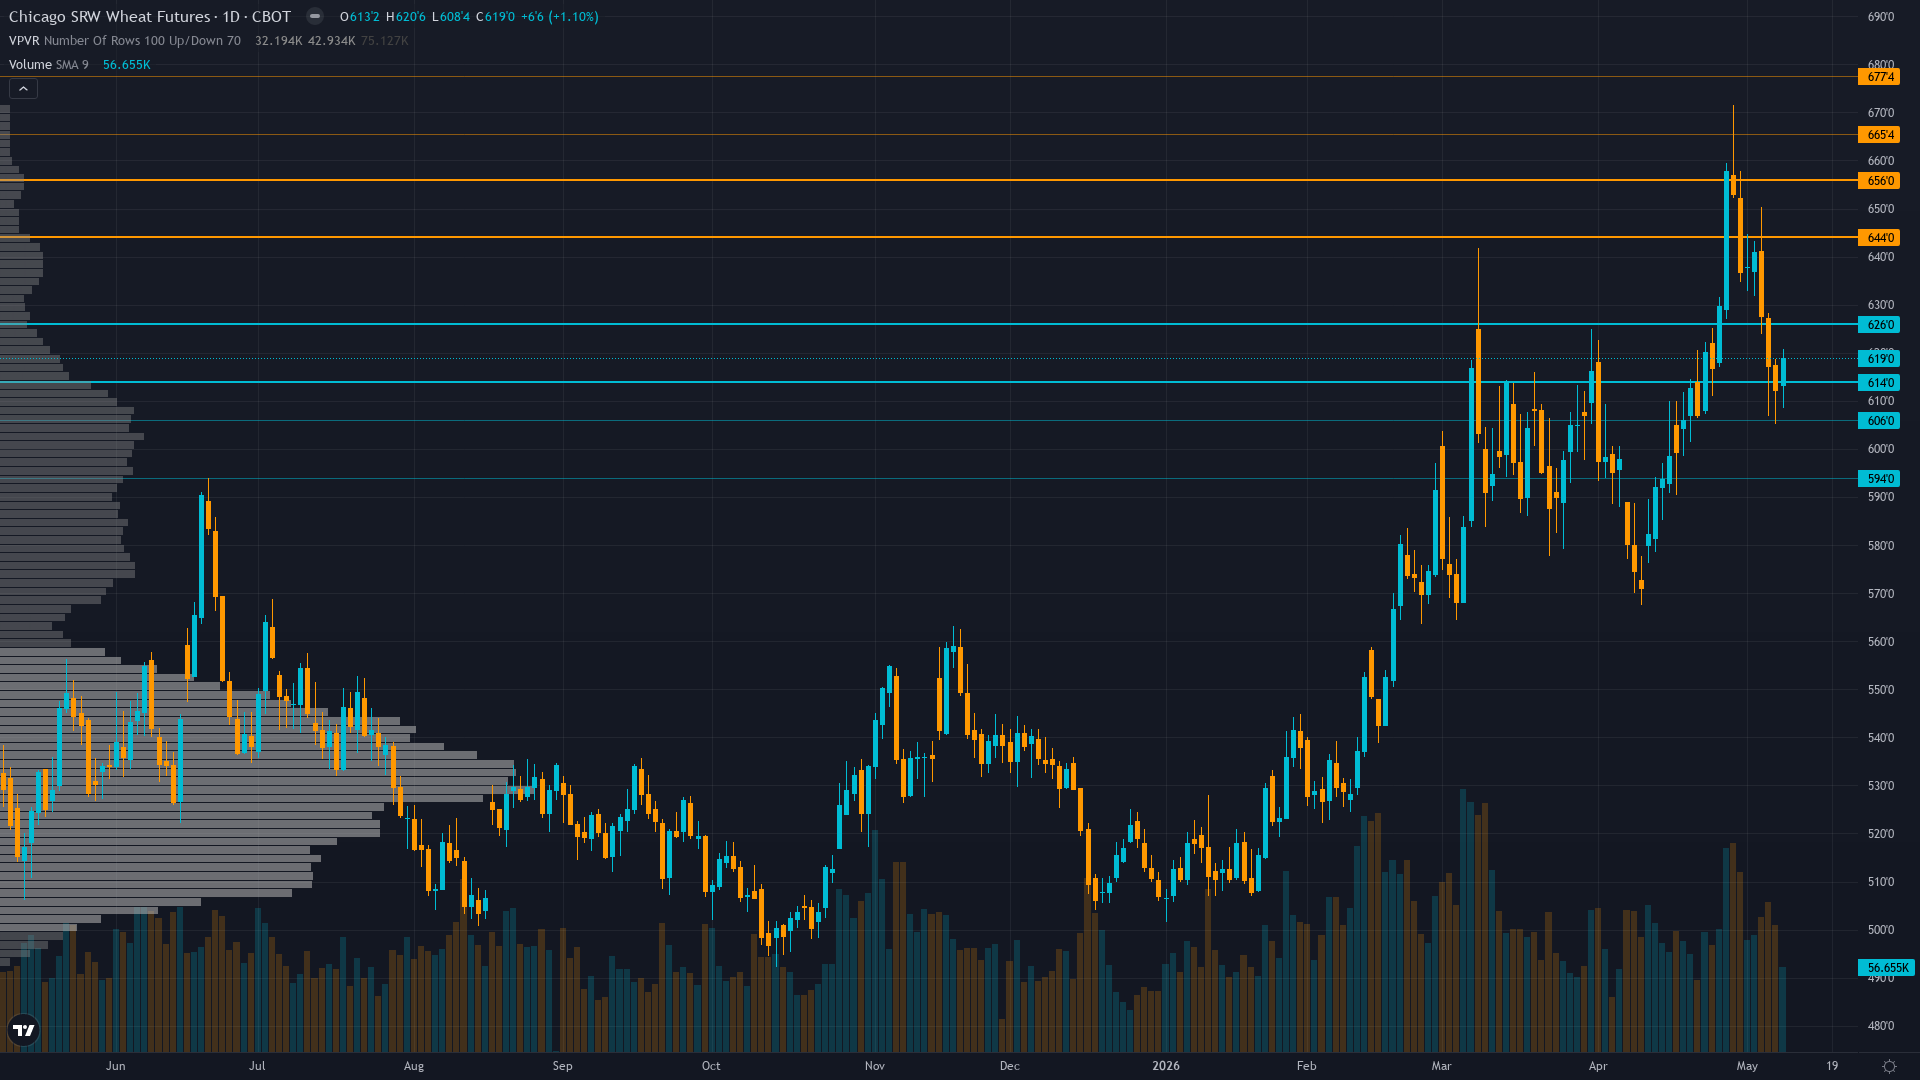
Trading at 611.63 with a 0.10% uptick, wheat is drifting higher without strong conviction. wheat futures is in a consolidating after pullback market state, requiring careful assessment of current conditions.
Price at 611.63 consolidated in 600-620 range after 6% pullback from April 28 highs with technical indicators showing Sell signals yet price holding above 600 psychological support suggesting indecision ahead of May 12 WASDE binary event
At 4/10, trend strength is middling — enough to suggest a lean, but not enough to trade with high confidence.
Support Architecture
Support levels for wheat are defined by zones of prior institutional demand. The depth and frequency of prior tests at these levels determines their likely strength.
The strength of support depends on the current TRANSITIONAL macro environment with VIX 17.39 neutral USD weakness at 97.84 DXY supporting export competitiveness yet crude oil elevated at $95/bbl raising input costs creating mixed agricultural margin backdrop ahead of binary WASDE catalyst regime and volume profile at each level.
Upside Barriers
Resistance levels above CBOT wheat current price represent zones of historical supply. The significance of each level scales with the number of prior tests and the volume traded there.
The current consolidating after pullback regime influences how aggressively these resistance zones are likely to be tested and whether they hold or fold.
Confluence & Methodology
Confluence is the differentiator between a line on a chart and a level worth trading. For wheat futures, the zones with the highest conviction are those validated across technical, institutional, and derivatives dimensions simultaneously.
Daily ranges expanded from prior 12-18 cents to current 20-30 cent action requiring wider stops - May 12 WASDE represents high-impact binary event likely triggering 3-5% move in either direction based on production estimate surprises with current consolidation in 600-620 range representing compressed volatility ahead of catalyst
Beyond Lines on a Chart
Our approach to key levels is designed to filter noise from signal. Six independent agents each assess the same price zones from different perspectives. A level confirmed by one discipline is interesting. A level confirmed by four or five is worth building a trade plan around.
This multi-discipline approach means the levels in our paid reports carry institutional-grade confluence — not just lines on a chart, but zones validated across every analytical dimension that matters.
Our paid reports include specific support and resistance levels identified by six specialist agents — technical structure, institutional positioning, options flow, fundamentals, sentiment, and economic analysis. Not just lines on a chart, but zones validated by multi-discipline confluence.
Start Free — Get the Market of the WeekFree weekly report · No credit card · Upgrade anytime


