Wheat Key Levels This Week — Support, Resistance & Confluence Zones
Wheat key levels breakdown: support zones, resistance zones, confluence and price structure.

Price Architecture
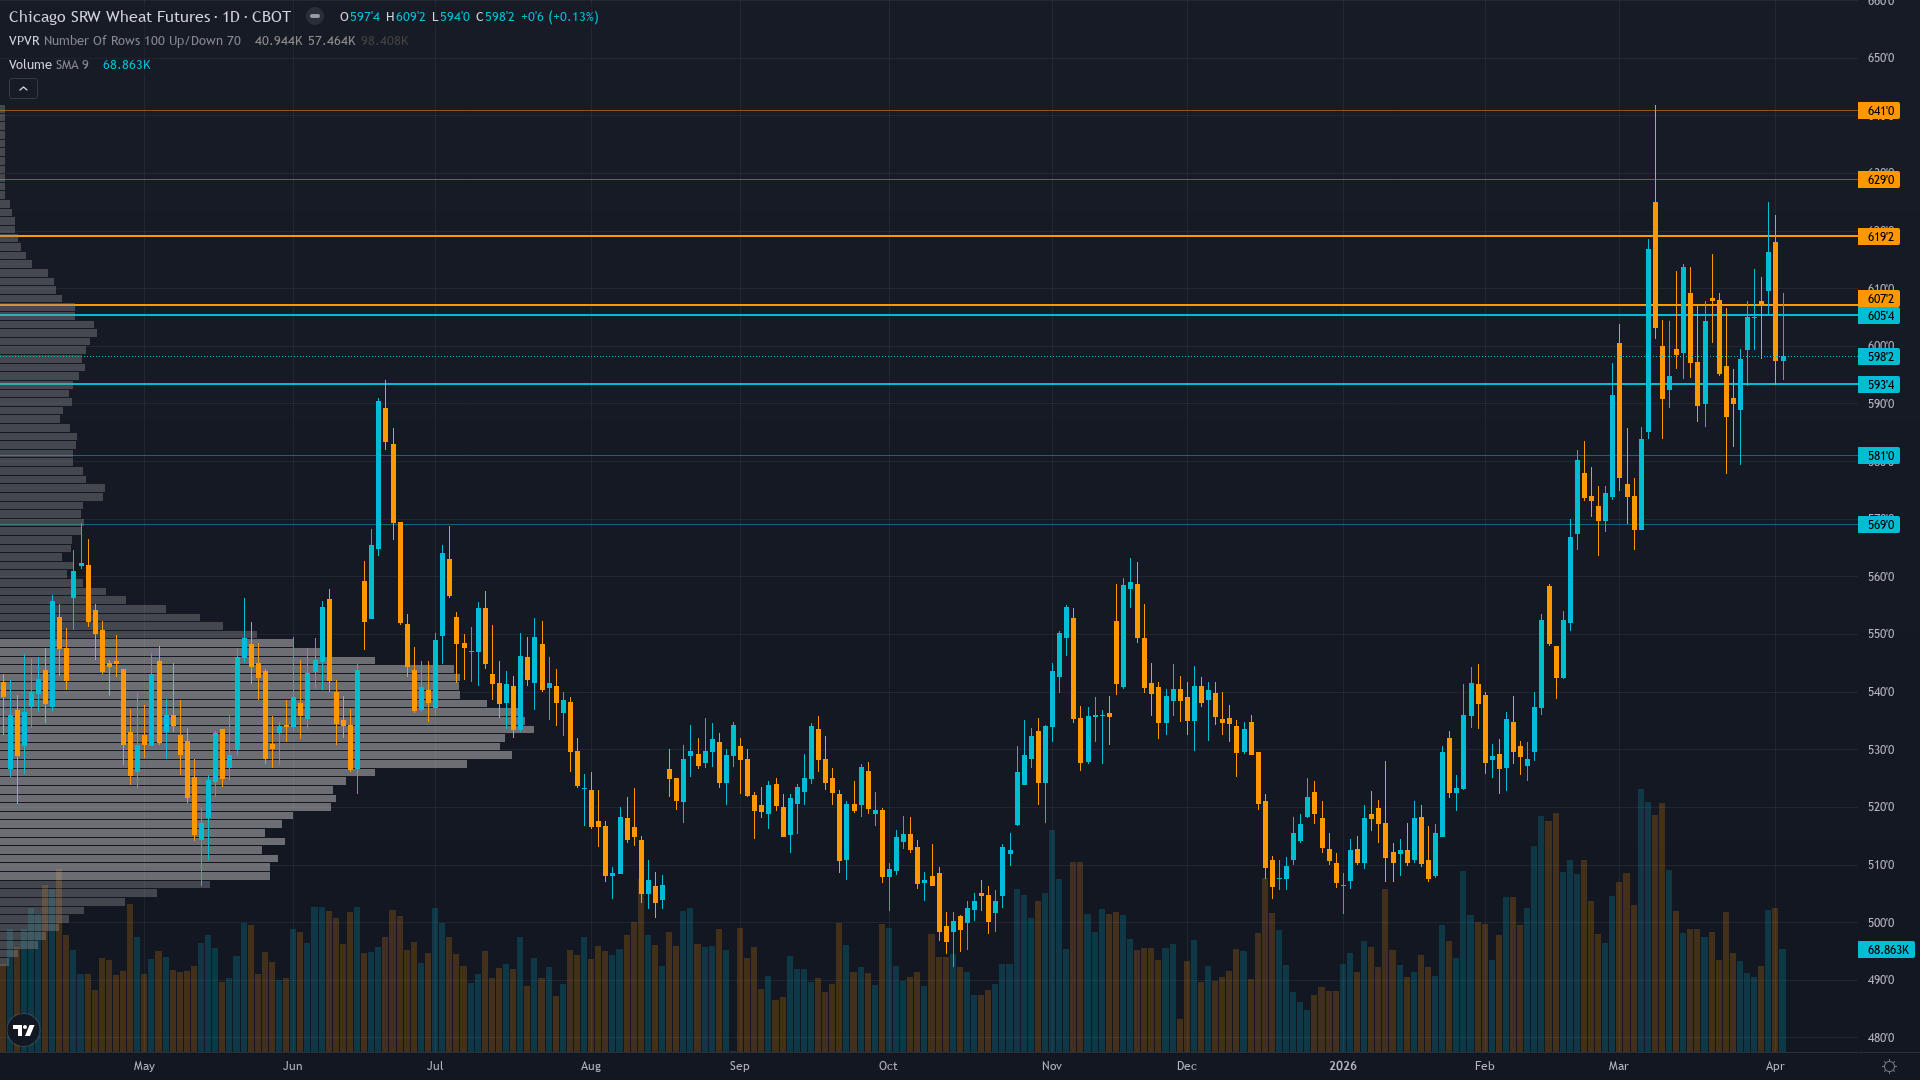
At 606.3, wheat has gained 1.56% over the past session with buying pressure clearly in the driving seat. The market in wheat futures is coiling, with narrowing price ranges suggesting stored energy that will eventually release.
Price at 606.30 holding above 50-day and 200-day moving averages for first time in months establishing emerging uptrend yet daily consolidation 594-607 range shows hesitation at resistance ahead of April 9 WASDE
Trend strength sits at 5/10, reflecting moderate directional pressure without clear dominance.
Downside Protection
The downside architecture for ZW futures features support zones rooted in prior buying activity. These are not arbitrary lines but areas where real capital has previously been committed.
The reliability of support under consolidating ahead of binary WASDE catalyst conditions is shaped by the interplay between volatility regime and historical volume at each level.
Resistance Zone Context
The upside path for wheat price is marked by resistance zones where prior selling activity created structural barriers. Clearing these zones requires either strong momentum or a shift in the fundamental picture.
In the current market state, resistance zones remain key decision points.
Analytical Convergence
The most actionable levels for wheat are those where multiple analytical disciplines converge. When technical structure, institutional positioning, and options flow all point to the same zone, the probability of price reacting there increases meaningfully.
Daily ranges expanded from compressed 10-16 cents during late 2025 to current 15-25 cent action requiring wider stops - WASDE April 9 represents high-impact binary event likely triggering 3-5% move in either direction based on production estimate surprises
Our Multi-Agent Approach to Key Levels
The levels in our paid reports are generated by six specialist agents working in parallel. Technical analysis provides the structural framework, institutional data shows where capital is committed, options flow reveals hedging behaviour, fundamentals anchor levels to value, sentiment gauges crowd positioning, and economic analysis times the catalysts.
The output is a curated set of levels with institutional-grade validation — the kind of multi-dimensional analysis that hedge fund research desks produce, delivered at a fraction of the cost.
Our paid reports include specific support and resistance levels identified by six specialist agents — technical structure, institutional positioning, options flow, fundamentals, sentiment, and economic analysis. Not just lines on a chart, but zones validated by multi-discipline confluence.
Start Free — Get the Market of the WeekFree weekly report · No credit card · Upgrade anytime


