Wheat Forecast This Week — Outlook, Drivers & Key Levels
This week's Wheat outlook: key drivers, volatility context, risk-opportunity assessment and the week ahead.

This Week's Starting Point
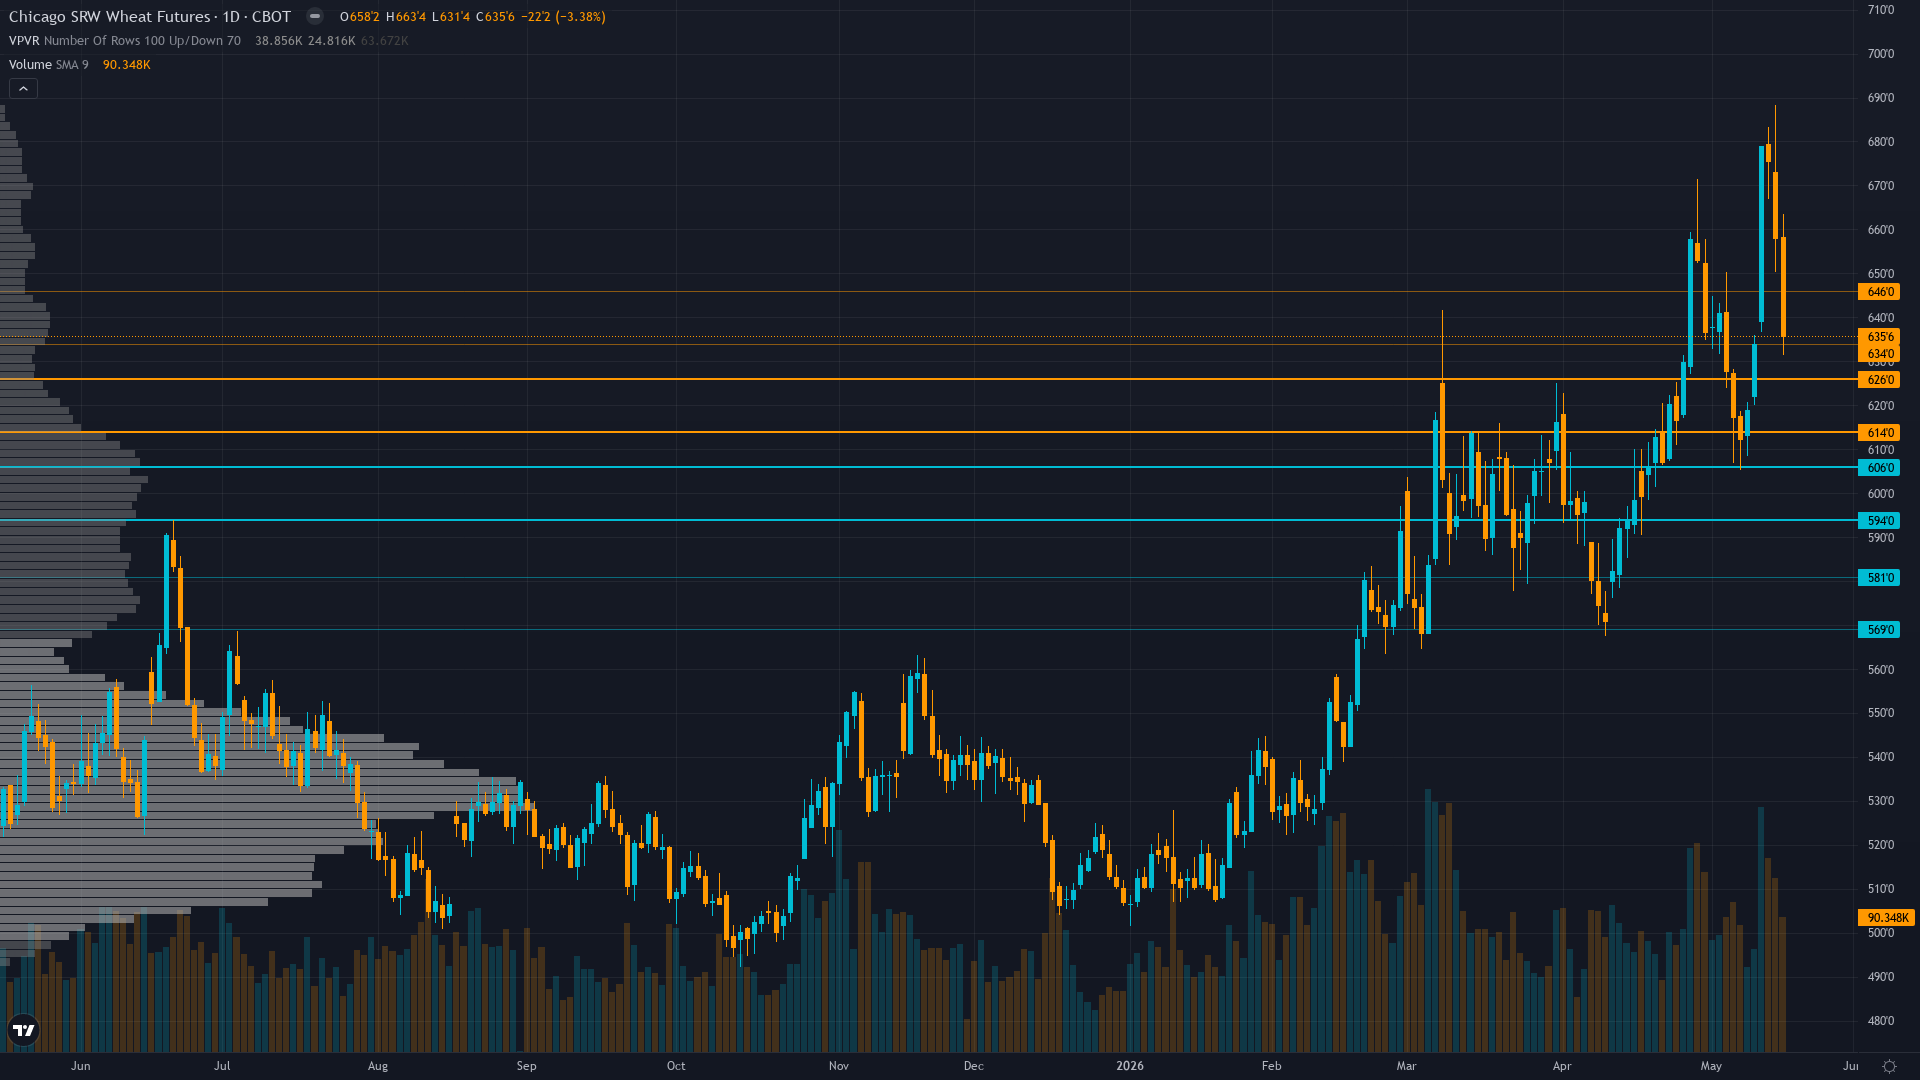
At 635.75, wheat has dropped 3.38% with sellers in control of the session. wheat futures is in a consolidating after pullback market state, requiring careful assessment of current conditions.
Cautiously bullish on May 12 WASDE production downgrades confirming most severe U.S. wheat shortfall since 1972 yet increasingly skeptical about sustainability above 650 given 7.6% pullback from highs, May 8 frost fears proving unfounded, and global stocks at 34.52% stocks-to-use ratio suggesting structural oversupply may overwhelm U.S. regional supply tightening
Forces in Play
Primary driver: May 12 WASDE confirmed most severe U.S. wheat production shortfall since 1972 with output down 21% YoY to 1,561 million bushels and crop conditions deteriorated to 28% good-to-excellent versus 46% last year, creating material supply-side catalyst that has driven prices 27% above year-ago levels yet market consolidating at 635.75 following 3.38% pullback from May 14 highs near 688 as frost fears proved unfounded
Secondary factor: Post-input development identified: May 8 (9 days ago) frost damage fears in U.S. Plains failed to materialize per Sentiment data causing weather premium removal and triggering pullback from 688.25 52-week high to current 635.75, yet fundamental drought conditions persist with 69% of winter wheat production areas under drought per May 5 U.S. Drought Monitor creating continued production risk
Additional influence: Institutional positioning remains net short -53,852 contracts per May 5 COT data representing continuation of bearish trend-following stance despite fundamental supply tightening, yet 84% of extreme short positioning from prior months already covered removing asymmetric squeeze fuel that drove February-March rallies while creating balanced two-way risk at current levels
Economic backdrop: TRANSITIONAL macro regime with VIX 17.99 neutral, USD weakness to 97.7 DXY (lowest since February 2026) following Powell-to-Warsh Fed Chair transition with dovish tilt supporting U.S. export competitiveness, crude oil retreating from $106 to $89/bbl on Iran de-escalation reducing input costs (fertilizer, fuel) for wheat production creating mixed agricultural margin backdrop where export advantages offset by easing weather premium
Fundamental assessment: Profoundly bullish with May 12 WASDE confirming U.S. production at 1,561 million bushels (lowest since 1972, down 21% YoY) and all-wheat yield at 47.5 bushels/acre (5.8 below 2025 record), crop conditions at 28% good-to-excellent versus 46% last year with 40% poor-to-very-poor versus 18% last year, yet global stocks at 34.52% stocks-to-use ratio with 819.1 MMT production creates fundamental tension where U.S. regional supply destruction meets global structural surplus baseline
Technical Landscape
Price at 635.75 consolidating in 620-650 range following 3.38% pullback from 688.25 52-week high with breakdown from 650-660 zone on May 16-17 testing 631.50 support, trading 27% above October 492 lows yet 7.6% below recent peaks suggesting market pricing partial drought premium without full commitment to production catastrophe scenario
Trend strength sits at 5/10, reflecting moderate directional pressure without clear dominance.
Risk-Reward Assessment
Primary risk: June 10 WASDE confirms May 8 frost fears overestimated with timely rainfall in Southern Plains salvaging late-season yield potential sending market back toward 600-615 support as global stocks at 34.52% stocks-to-use ratio (819.1 MMT production) reassert structural oversupply narrative dominance over U.S. regional drought concerns (Probability: medium)
Primary opportunity: Intensifying Plains drought through late May-June combined with demand destruction from price-sensitive importers proving more limited than expected triggers additional production downgrades in June 10 WASDE driving rally toward 670-688 retest as 69% drought coverage with only 28% good-to-excellent ratings materializes sustained yield losses exceeding current market pricing (Timeframe: Next 3-4 weeks through June 10 WASDE and critical May-June weather window for final 2026 crop development before harvest begins)
This week's edge: Market may be underestimating duration and severity of production losses from 69% drought coverage affecting winter wheat areas with only 28% good-to-excellent crop ratings (versus 46% last year) creating scenario where June 10 WASDE confirms sustained yield degradation beyond current pricing at 635.75 as months-long drought stress cannot be reversed by isolated rainfall events, yet desk acknowledges global 34.52% stocks-to-use ratio creates genuine two-way uncertainty requiring balanced conviction versus entrenched bullish stance
Risk Environment
With vol at the 70th percentile, wheat price is trading in an elevated regime where daily ranges can surprise even experienced traders. Volatility is stable, with realised vol holding steady across timeframes. This equilibrium can persist but eventually resolves into expansion or contraction.
Seasonal Context
Historically, May 2026 has favoured the upside for CBOT wheat (62% win rate). Crop condition reports and weather risk peak.
Week Ahead Outlook
The next major catalyst is USDA June 2026 WASDE Report with updated winter wheat production estimates incorporating final spring weather conditions and initial harvest progress data plus 2026/27 crop year demand projections on Wednesday 10 June — a high-impact event that could materially shift the directional picture.
For wheat, the balance between existing momentum and scheduled risk events sets the stage for the week ahead.
This analysis covers one dimension. Our full weekly report combines six specialist agents into a single actionable briefing with directional bias, key levels, and risk-opportunity matrix.
Start Free — Get the Market of the WeekFree weekly report · No credit card · Upgrade anytime


