Wheat Forecast This Week — Outlook, Drivers & Key Levels
This week's Wheat outlook: key drivers, volatility context, risk-opportunity assessment and the week ahead.

Market Overview
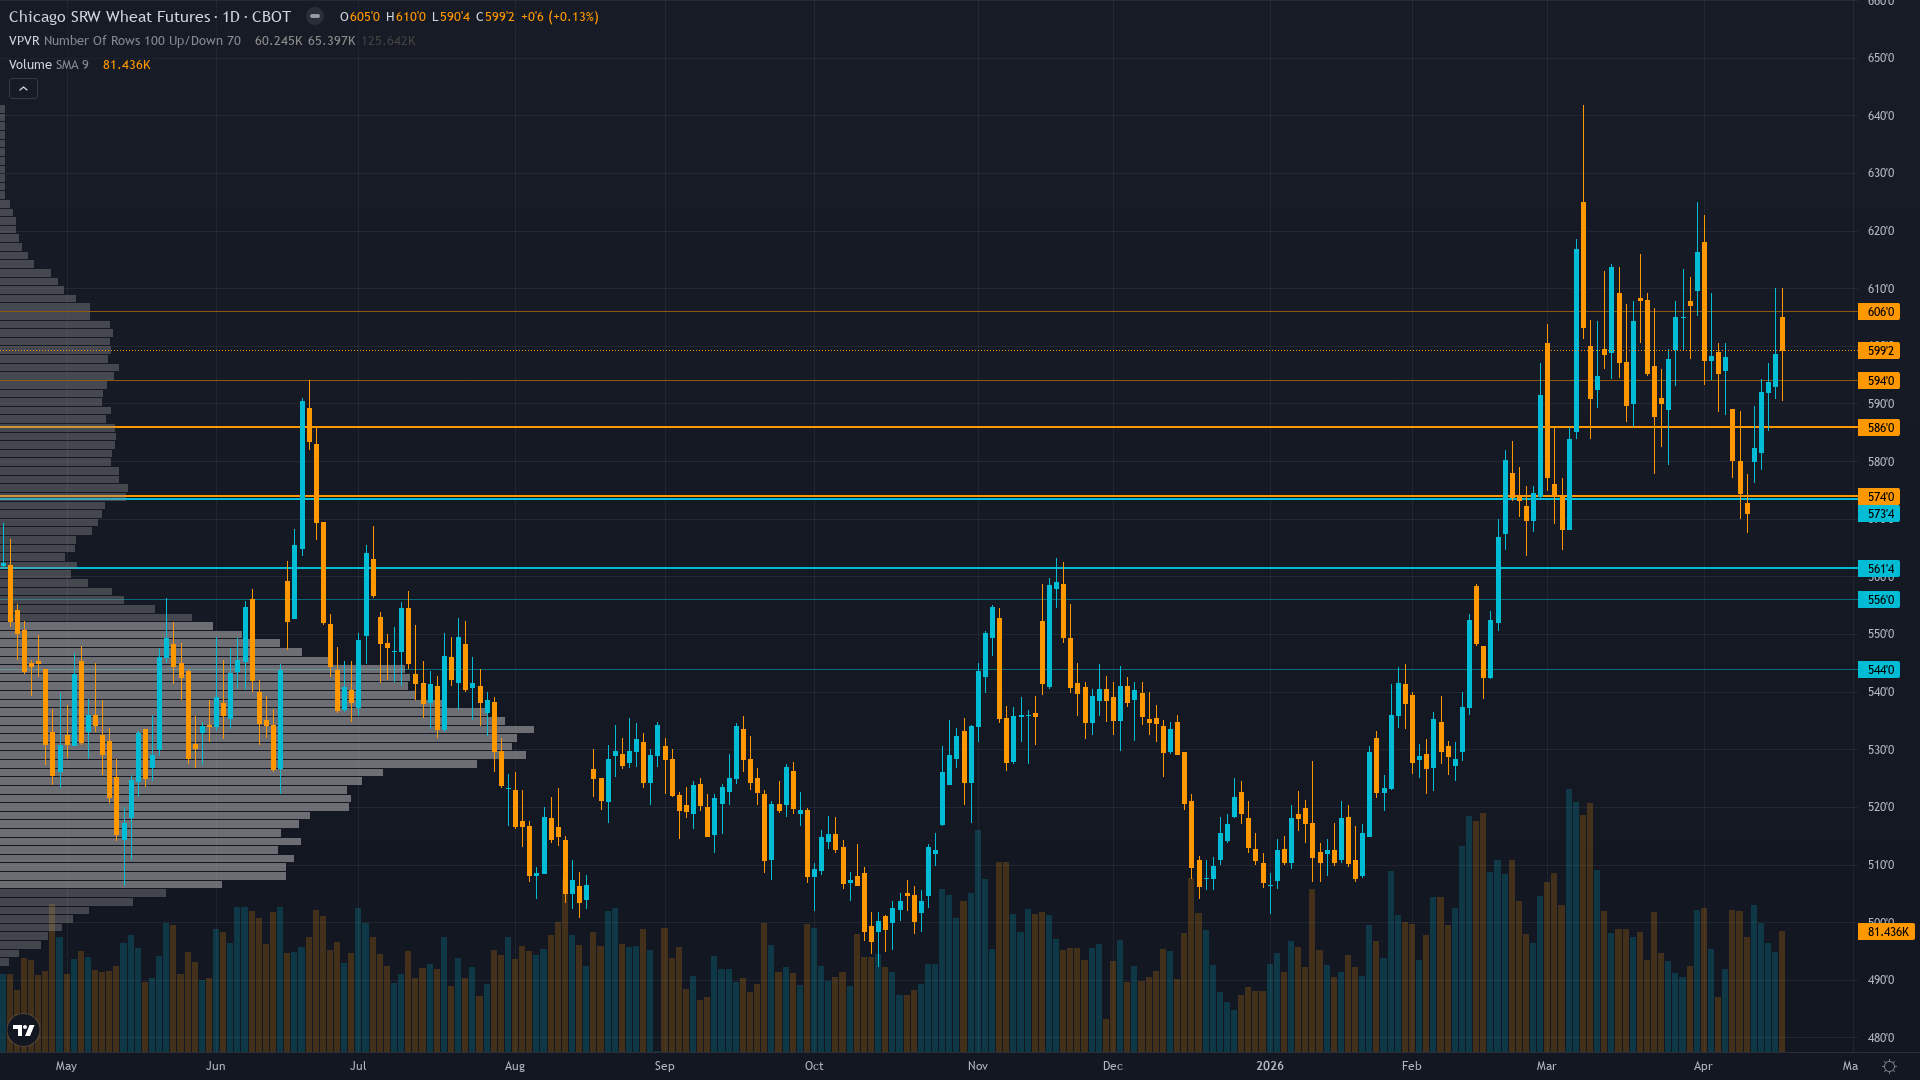
wheat stands at 600.5, having rallied 1.09% as bulls press their advantage. wheat futures is range-bound and tightening, with decreasing volatility signalling a directional resolution ahead.
Mixed to neutral with fundamental analysts bearish on April 9 WASDE oversupply confirmation expecting pressure toward 575-590 support yet technical analysts noting uptrend establishment above moving averages and momentum into 600-610 resistance creating conflicting narratives without clear consensus direction
This Week's Catalysts & Drivers
Primary driver: April 9 WASDE bearish supply shock showing U.S. ending stocks at 938 million bushels (highest since 2019/20) and global production raised to 283.12 MMT creates oversupply dominance clashing with technical rally momentum and two consecutive missed directional calls requiring analytical recalibration
Secondary factor: Technical rally from 571 to current 600.50 (+5.2% in 9 days) establishes price above 50-day (~575) and 200-day (~555) moving averages yet occurs against fundamental backdrop of record global stocks at 951.5 million tonnes and 32% stocks-to-use ratio creating disconnect between price action and supply reality
Additional influence: Southern Plains drought covering 65% of winter wheat areas with only 35% good-to-excellent crop ratings creates production tail-risk scenario yet market pricing indicates global surplus overwhelming U.S. regional concerns with managed money positioning at -18,400 contracts showing modest bearish stance without extreme
Economic backdrop: USD weakness to 97.70 DXY (down 2.38% monthly) supports U.S. export competitiveness yet crude oil elevated near $92-98/bbl following geopolitical tensions raises input costs creating mixed macro backdrop for agricultural margins
Fundamental assessment: Overwhelmingly bearish with April 9 WASDE confirming global wheat production 283.12 MMT and U.S. ending stocks 938 million bushels (highest since 2019/20) creating 951.5 million tonne global stocks at 32% stocks-to-use ratio yet 65% drought coverage in Southern Plains creates fundamental tension market resolving in favor of supply surplus over weather tail-risk
Technical Picture
Price at 600.50 establishing daily uptrend above 50-day MA (~575) and 200-day MA (~555) after rally from April 10 low of 577.50 yet momentum into 600-610 resistance zone shows hesitation with RSI estimated 55-60 range indicating bullish momentum without overbought conditions
At 5/10, trend strength is middling — enough to suggest a lean, but not enough to trade with high confidence.
Bull & Bear Case
Primary risk: Continuation of rally above 610 resistance toward testing 620-622 range driven by technical momentum and short-covering from -18,400 contract positioning despite April 9 WASDE bearish supply confirmation creating disconnect where price advances against fundamental gravity (Probability: medium)
Primary opportunity: Mean reversion pullback toward 575-590 support as April 9 WASDE bearish supply reality (938 million bushel U.S. stocks highest since 2019/20 and 283.12 MMT global production) reasserts dominance over technical rally with 65% drought coverage proving insufficient to materialize production downgrades justifying weather premium (Timeframe: Next 2-4 weeks through May 12 WASDE as market digests post-April 9 supply outlook without fresh bullish catalyst emerging)
This week's edge: Resetting after 2 consecutive misses (April 17 BEARISH missed +4.73%, April 10 NO CALL missed -5.99%) - analytical discipline requires acknowledging insufficient edge to overcome 0.75% noise threshold when fundamental oversupply reality from April 9 WASDE clashes with technical rally momentum and drought tail-risk creating genuine two-way uncertainty without fresh catalyst before May 12 WASDE 23 days away
Volatility Regime
Volatility for wheat price is at the 68th percentile over 90 days — a normal regime that allows for standard position sizing and conventional trade management. The vol trend is flat, with no meaningful shift across timeframes. Stable vol environments often lull traders before a regime change arrives.
Daily ranges expanded from prior 15-20 cents to current 18-28 cent action following WASDE breakdown and subsequent rally requiring wider stops - sustained move below 590 or breakout above 610 would trigger accelerated directional moves given elevated volatility environment and conflicting fundamental-technical forces
What History Shows
CBOT wheat enters a seasonally bullish window in April 2026, backed by a 60% historical win rate. Weather premium builds as growing season starts.
The Week Ahead
USDA May 2026 WASDE Report with updated winter wheat production estimates incorporating spring weather conditions and final damage assessments from Southern Plains drought plus initial 2026/27 crop year projections on Tuesday 12 May is a high-impact catalyst with the potential to redefine the near-term outlook entirely.
How wheat futures navigates the confluence of consolidating conditions and incoming data will determine whether the current directional thesis holds or breaks.
This analysis covers one dimension. Our full weekly report combines six specialist agents into a single actionable briefing with directional bias, key levels, and risk-opportunity matrix.
Start Free — Get the Market of the WeekFree weekly report · No credit card · Upgrade anytime


