Wheat Forecast This Week — Outlook, Drivers & Key Levels
This week's Wheat outlook: key drivers, volatility context, risk-opportunity assessment and the week ahead.

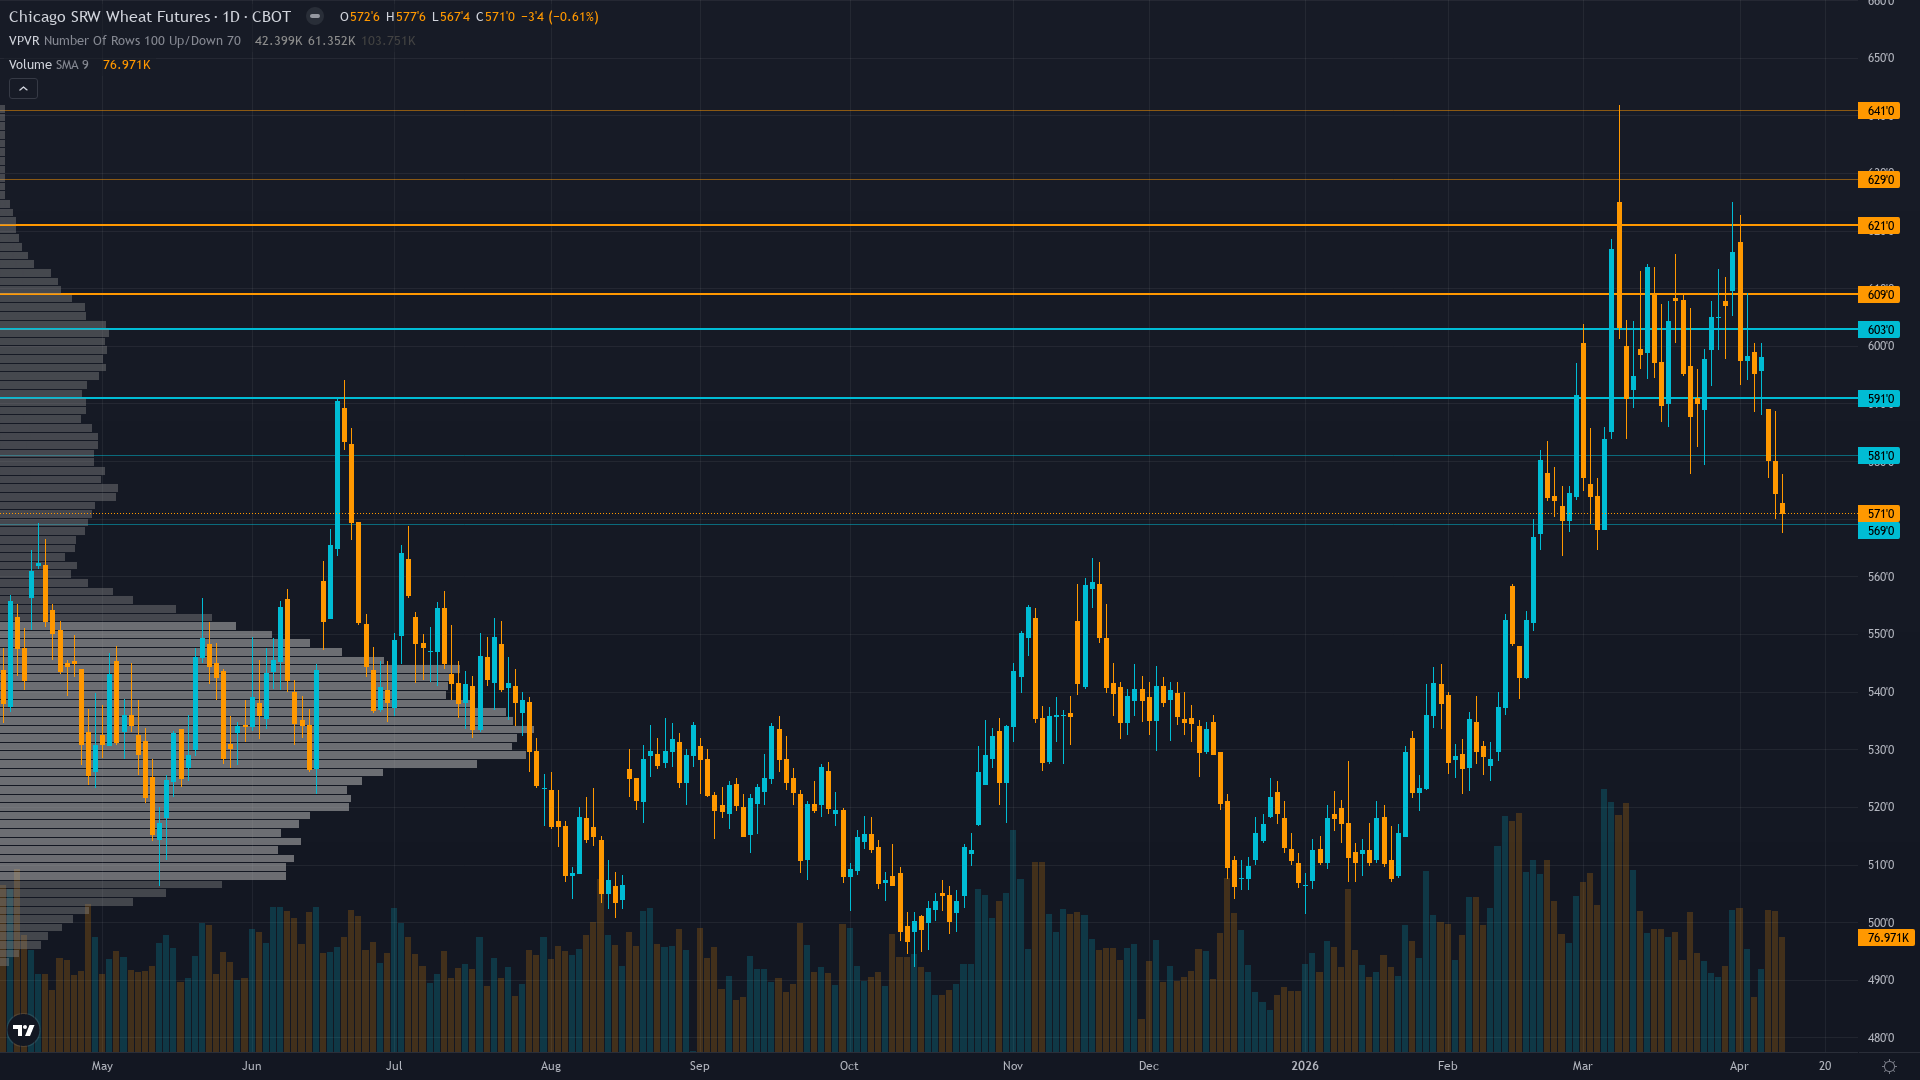
Current Market Picture
At 571, wheat has eased 0.70% in a controlled retreat. wheat futures is in a breaking down market state, requiring careful assessment of current conditions.
Bearish following April 9 WASDE confirmation of global oversupply with wheat prices expected to continue pressure toward 550-560 support as abundant global stocks overshadow U.S. drought concerns
Risk & Opportunity
Primary risk: Continued breakdown below 567.50 support toward testing 550.00 psychological level as April 9 WASDE bearish supply outlook dominates despite drought concerns with short-covering exhaustion and USD strength at 100 DXY creating export competitiveness headwinds reinforcing oversupply narrative (Probability: high)
Primary opportunity: Late-season freeze event or significant weather deterioration in spring wheat planting season (Apr-May) triggers renewed production concerns and short-covering rally back above 580.00 toward 600.00 as 65% drought coverage creates tail-risk scenario for severe yield losses (Timeframe: Next 2-6 weeks through May 9 WASDE and critical April-May spring weather window for 2026 crop development)
This week's edge: Market has fully priced April 9 WASDE bearish supply outlook yet may be underestimating duration of USD strength at 100+ DXY as geopolitical tensions persist, creating sustained export competitiveness headwind for U.S. wheat that could extend weakness below 567.50 toward 550.00 psychological support over coming weeks
What's Driving Price
Primary driver: April 9 WASDE delivered bearish surprise with global wheat production raised 6.16 MMT to 283.12 MMT while U.S. ending stocks hit highest level since 2019/20 at 938 million bushels - market repricing oversupply dominance as price breaks below 580.00 support despite 65% of U.S. winter wheat in drought
Secondary factor: Technical breakdown confirmed as ZW fell below 580.00 support following WASDE, now trading at 571.00 after reaching two-week lows below 575.00 on April 8 with price below both 50-day MA (~595) and 200-day MA (~585) in confirmed downtrend
Additional influence: Short-covering exhaustion complete as managed money positioning moved from extremely short to moderately short (-18.7K contracts as of April 10) removing primary squeeze fuel while sentiment agents note war/weather premium removed from market April 1-2
Economic backdrop: USD strength near 100 DXY creates direct export headwind for U.S. wheat competitiveness while crude oil near $98/bbl and diesel at $5.80/gal elevate input costs - VIX declining to 19.23 suggests improving risk appetite yet geopolitical tensions (Iran Strait of Hormuz) maintain safe-haven USD bid
Fundamental assessment: Overwhelmingly bearish with April 9 WASDE raising global production to 283.12 MMT and U.S. stocks to 938 million bushels (highest since 2019/20) creating record global stocks at 951.5 million tonnes yet 65% of U.S. winter wheat in drought creates fundamental tension that market is resolving in favor of supply surplus
Chart Assessment
Confirmed downtrend with price at 571.00 well below 50-day MA (~595) and 200-day MA (~585) following breakdown below 580.00 support - RSI 35-40 oversold but no bullish divergence with immediate support at 567.50 and major support at 550.00 psychological level
With trend strength at only 3/10, any directional bias is thin and easily disrupted.
Volatility Context
At the 72th percentile of its 90-day range, wheat price volatility is running hot, creating both opportunity and risk for directional traders. Realised vol is holding its current level, suggesting the market has found a temporary equilibrium in its risk pricing.
Daily ranges expanded from prior 15-20 cents to current 18-28 cent action following WASDE breakdown requiring wider stops - sustained move below 567.50 or recovery above 580.00 would trigger accelerated moves given failed resistance and elevated volatility environment
Seasonal Patterns
The seasonal tailwind for CBOT wheat in April 2026 is well-documented at 60%. Weather premium builds as growing season starts.
Looking Forward
All eyes turn to USDA May 2026 WASDE Report with initial 2026/27 crop estimates and updated production forecasts incorporating spring weather conditions and final winter wheat damage assessments on Saturday 9 May, which carries enough weight to force a decisive directional move.
The week ahead for wheat price hinges on whether the prevailing breaking down regime can absorb the scheduled catalysts without a regime shift.
This analysis covers one dimension. Our full weekly report combines six specialist agents into a single actionable briefing with directional bias, key levels, and risk-opportunity matrix.
Start Free — Get the Market of the WeekFree weekly report · No credit card · Upgrade anytime


