Wheat Forecast This Week — Outlook, Drivers & Key Levels
This week's Wheat outlook: key drivers, volatility context, risk-opportunity assessment and the week ahead.

This Week's Starting Point
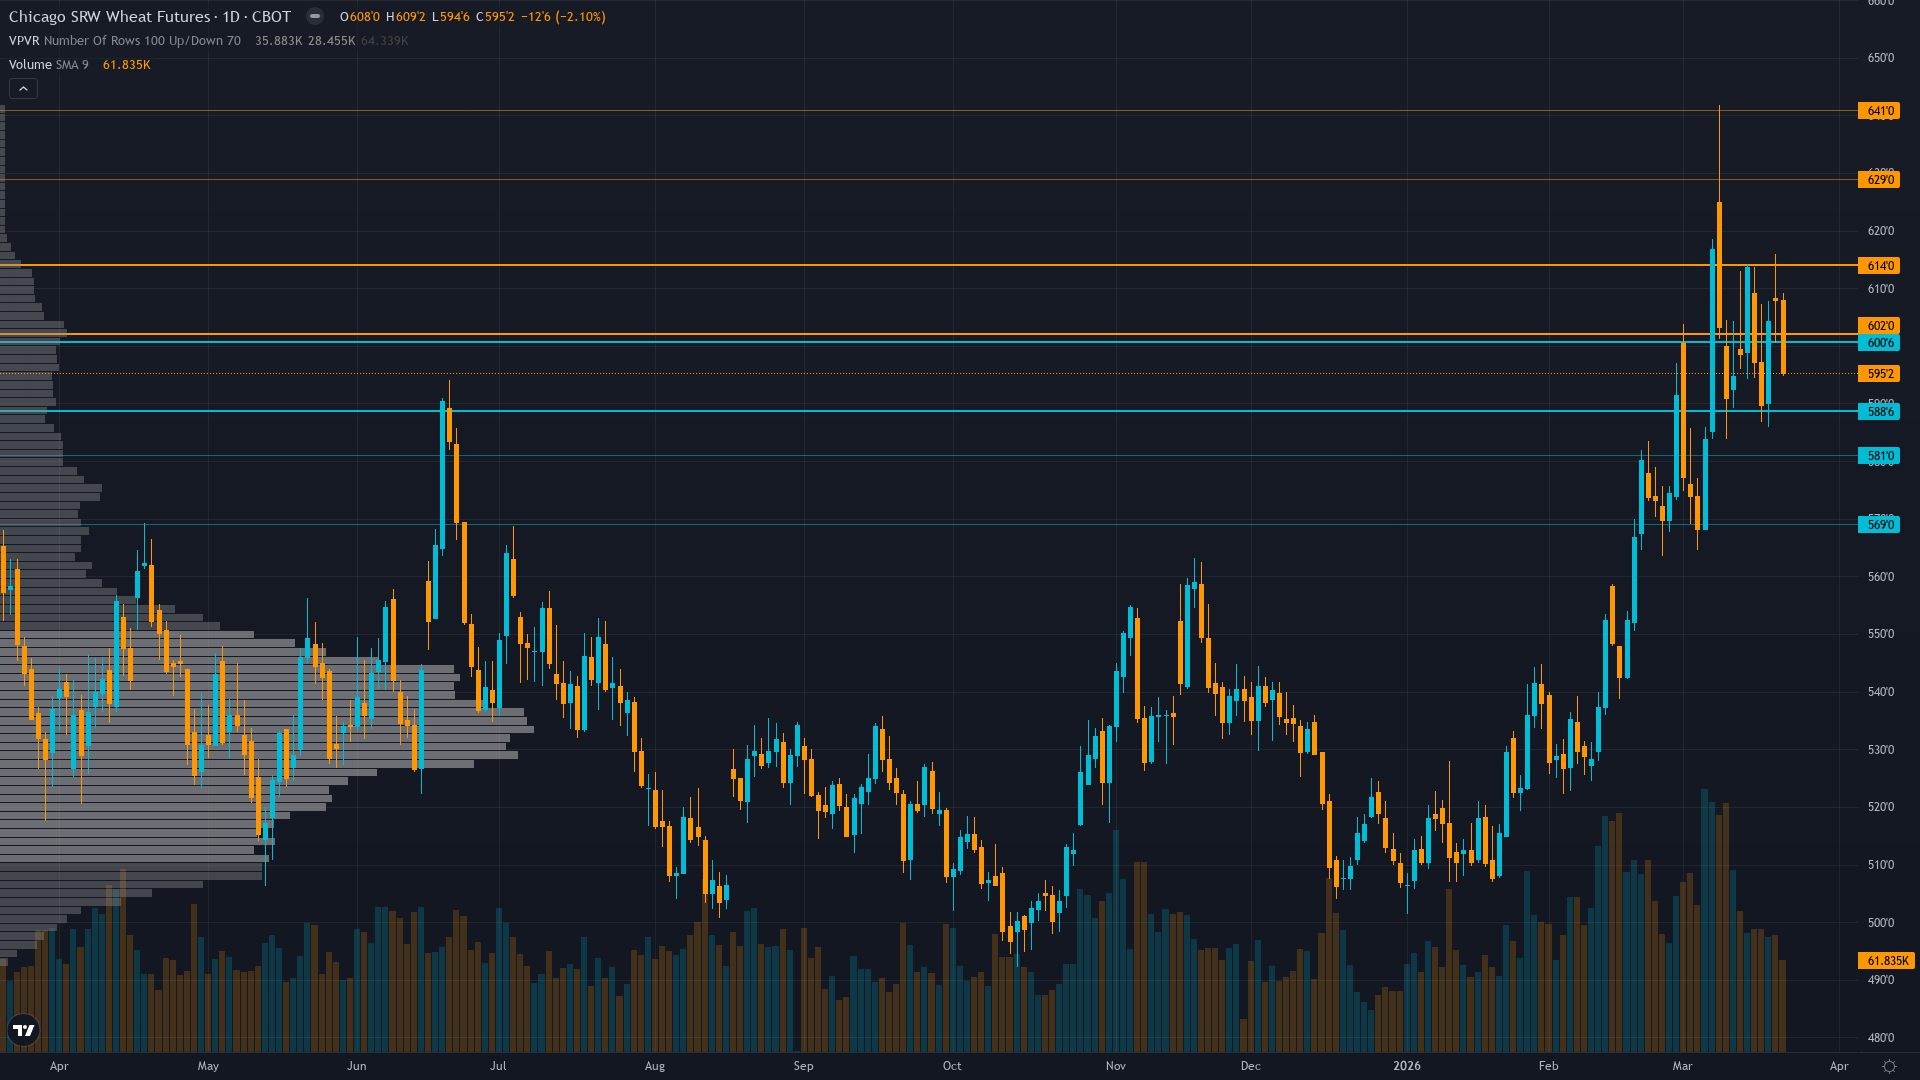
wheat sits at 595.25, having shed 1.94% as bears maintain the upper hand. wheat futures is in a breaking down market state, requiring careful assessment of current conditions.
Cautiously bearish following March rally reversal with market viewing advance as short-covering event within structural bear market expecting mean reversion toward 575-590 once weather premium fully dissipates and positioning dynamics stabilize
Bull & Bear Case
Primary risk: Continuation of breakdown below 594 support toward retesting 575-580 zone as short-covering exhaustion combines with USD strength headwinds structural oversupply narrative reasserting dominance and absence of fresh bullish catalysts following March 19 rally failure (Probability: high)
Primary opportunity: Late March-April freeze event damages winter wheat that broke dormancy early in late February triggering renewed weather premium and short-covering toward 620-635 range as March-April historically represents peak freeze vulnerability window for crops in active growth (Timeframe: Next 2-4 weeks through April WASDE and critical March-April weather window)
This week's edge: Market may be underestimating March-April freeze risk from unusually early dormancy break in late February 2026 creating tail-risk scenario for severe crop damage if arctic air returns yet positioning exhaustion and USD headwinds combined with absence of fresh catalysts and two consecutive MISSED calls requiring Thesis Health Score downgrade suggest NEUTRAL stance appropriate as probable weekly move approaches 0.75% noise threshold with conviction insufficient for directional call
This Week's Catalysts & Drivers
Primary driver: Sharp technical breakdown from March 19 intraday high near 609 to current 595.25 erasing rally gains and confirming failed breakout structure with declining open interest signaling weakening conviction despite structural oversupply fundamentals remaining dominant
Secondary factor: USD strength headwind intensifying as DXY held near 99.5 following March geopolitical shock creating direct export competitiveness pressure offsetting strong 900 million bushel US export forecast floor
Additional influence: Plains drought concerns from March 19 rally driver fading as market digests March 10 WASDE showing minimal changes and no production downgrades despite early dormancy break creating March-April freeze vulnerability window
Economic backdrop: Transitional macro regime with VIX at 26.78 signaling elevated fear USD strength at 99.5 creating export headwinds and crude oil spike to 92/bbl following Iran-Hormuz conflict raising input costs offsetting stable agricultural demand environment
Fundamental assessment: Overwhelmingly bearish with global stocks at record 277.5 MMT and 33.7% stocks-to-use ratio yet market holding above 590 suggests worst-case scenarios fully discounted after October capitulation to 492 lows with strong US export pace providing tangible floor
Technical Picture
Failed breakout at 609 resistance followed by sharp 2.1% decline to 595.25 confirming rally exhaustion with declining open interest at 230,820 contracts signaling weakening trend participation and potential for retest of 575-580 support zone
At 4/10, trend strength is middling — enough to suggest a lean, but not enough to trade with high confidence.
Risk Environment
With vol at the 68th percentile over 90 days, wheat price is in a measured regime that doesn't require unusual adjustments. Volatility is stable, with realised vol holding steady across timeframes. This equilibrium can persist but eventually resolves into expansion or contraction.
Daily ranges expanded from compressed 10-16 cents during late 2025 consolidation to current 15-25 cent action requiring wider stops with breakdown below 594 or recovery above 608 triggering accelerated moves given failed breakout structure and elevated volatility environment
Seasonal Context
Historically, March 2026 has favoured the upside for CBOT wheat (58% win rate). Spring planting intentions report drives positioning.
Week Ahead Outlook
USDA April 2026 WASDE Report with winter wheat acreage estimates production forecasts and condition assessments incorporating weather-adjusted outlook following March early dormancy break and drought concerns on Thursday 9 April is the next scheduled catalyst, with moderate potential to influence near-term price action.
For wheat, the balance between existing momentum and scheduled risk events sets the stage for the week ahead.
This analysis covers one dimension. Our full weekly report combines six specialist agents into a single actionable briefing with directional bias, key levels, and risk-opportunity matrix.
Start Free — Get the Market of the WeekFree weekly report · No credit card · Upgrade anytime


