Wheat COT & Institutional Positioning — Smart Money Analysis

Wheat institutional positioning: COT data, sentiment analysis and smart money flow assessment.

Share
Wheat COT & Institutional Positioning — Smart Money Analysis
Wheat
Week of 7 Jun 2026
BREAKING DOWN
Trend 3/10
Sentiment
FEAR
Market Regime
TRANSITIONAL - VIX ELEVATED NEAR 21.51 (ABOVE 20 THRESHOLD INDICATING MILD FEAR PER JUNE 5 DATA YET BELOW 25 EXTREME PANIC) WITH USD AT 100.07 DXY STRENGTHENING 1.34% MONTHLY CREATING EXPORT COMPETITIVENESS HEADWIND WHILE BROAD COMMODITY COMPLEX FACES CROSS-CURRENTS FROM GEOPOLITICAL TENSIONS AND SLOWING GLOBAL GROWTH CREATING ENVIRONMENT WHERE AGRICULTURAL FUNDAMENTALS MUST STAND ALONE WITHOUT MACRO TAILWIND SUPPORT

Institutional Positioning

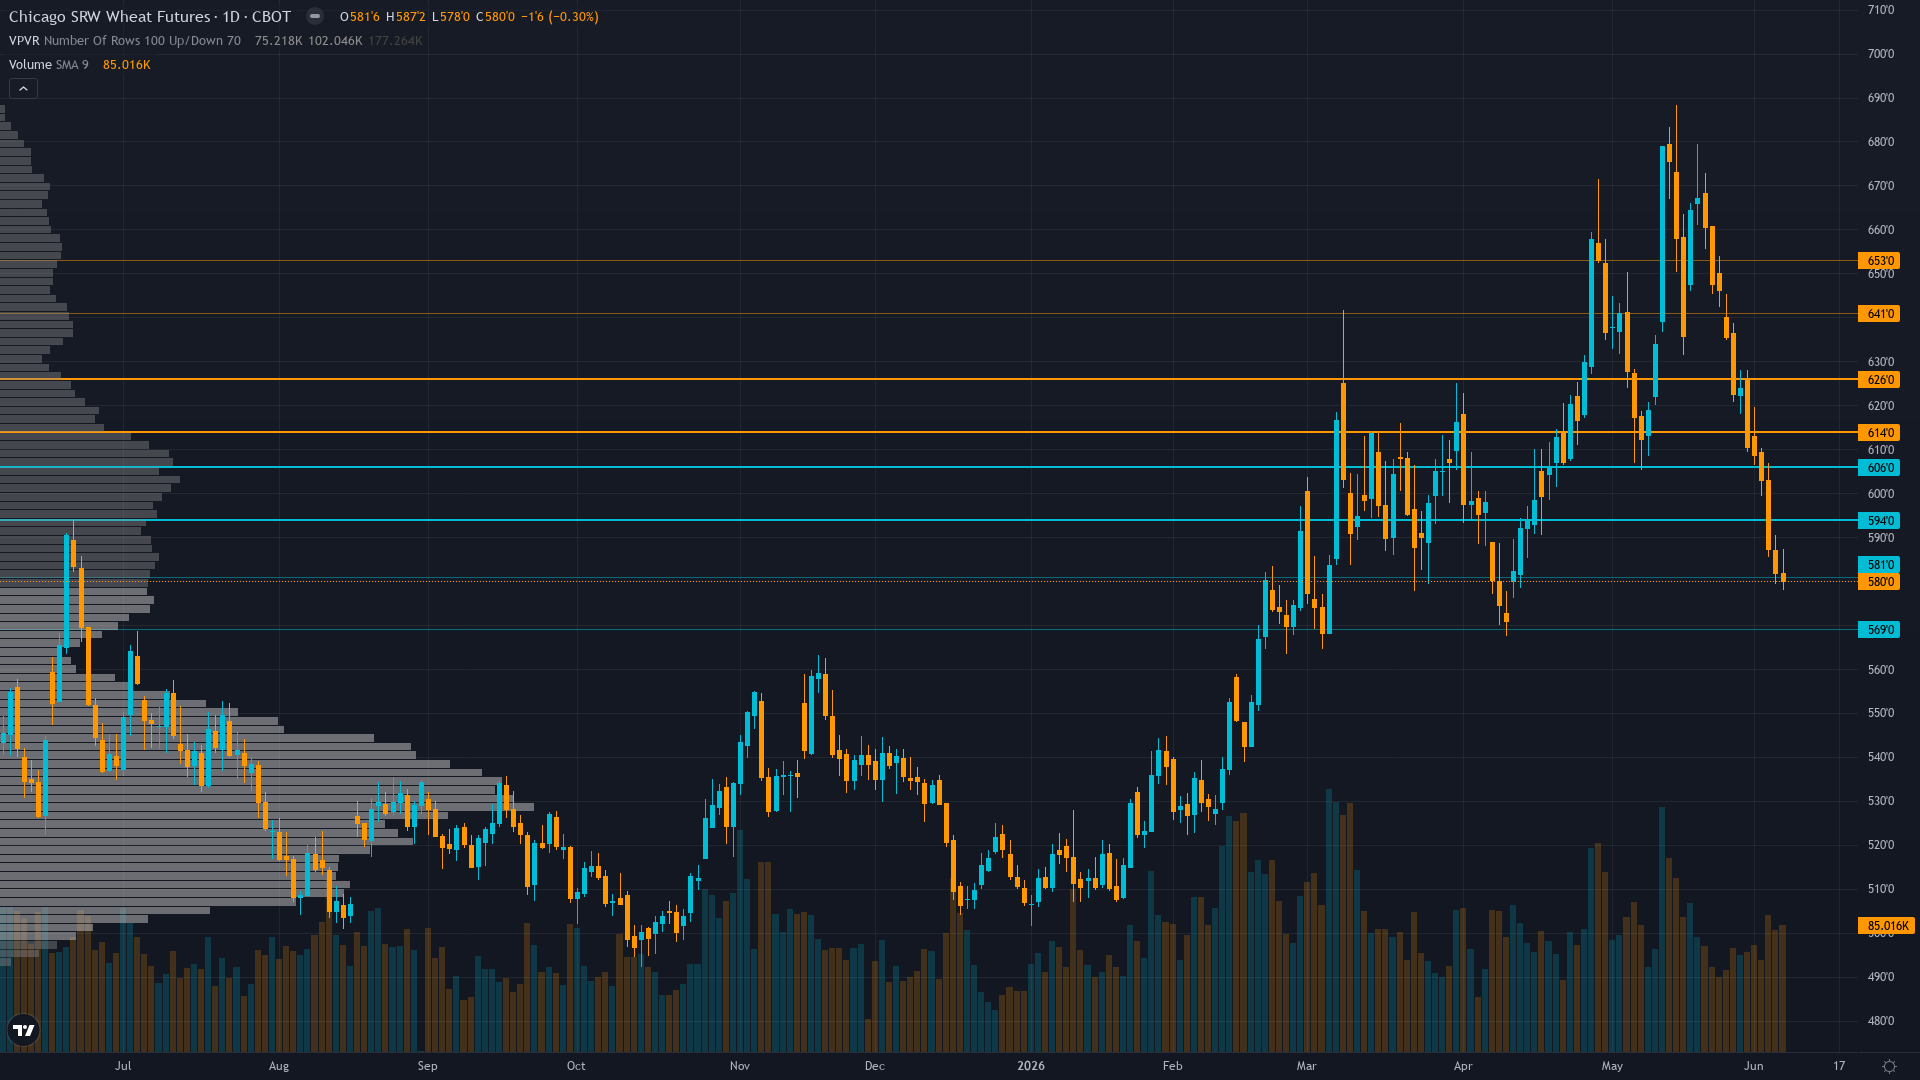
At 580.25, wheat has eased 0.17% in a controlled retreat.

Managed money executed historic bearish shift to net short -57,871 contracts as of June 2 COT data adding 39,165 contracts in single week representing largest Tuesday-to-Tuesday bear move on record back to 2006 per Barchart removing all squeeze potential and creating positioning setup where only fresh bullish catalyst can reverse trend momentum

Crowd Psychology

Neither side has committed heavily to wheat futures, leaving sentiment in a neutral zone that offers little directional guidance on its own.

Options Flow

Implied volatility data unavailable for current ZW contracts due to thin agricultural options markets limiting directional signal clarity though historical WASDE-driven volatility patterns suggest elevated two-way risk persists in post-May 13 catalyst repricing phase

Market Consensus vs Our Analysis

Market consensus: Bearish following May 13 WASDE rally reversal with market viewing late-May advance from 610 to 647 as short-covering event within structural bear market expecting seasonal June-August harvest pressure to drive prices toward 550-575 support as global stocks at 951.5 million tonnes overwhelm U.S. regional production concerns

Primary driver: Continued breakdown from last week's BEARISH conviction 5 call that correctly captured -4.95% move (610.5 to 580.25) as managed money net short positioning surged to -57,871 contracts per June 2 COT data representing largest single-week bearish positioning shift on record since 2006 removing any remaining squeeze fuel from market structure

Putting It Together

In summary, the positioning picture for wheat reflects fear conviction levels set against a breaking down market backdrop. Trend strength registers just 3/10, which typically corresponds to choppy, directionless price action. The interplay between smart money activity, retail sentiment, and options market signals will shape how this positioning resolves.

Consensus vs Reality
Last Week's Consensus

“Bearish following May 13 WASDE rally reversal with market viewing advance as weather scare within structural oversupply environment expecting seasonal June-August harvest pressure to drive prices toward 575-590 support as global stocks at 954.6 million tonnes overwhelm U.S. regional tightening”

What Actually Happened
-4.95%
610.5 → 580.25
Frequently Asked Questions
What is the Wheat forecast this week?

Bearish following May 13 WASDE rally reversal with market viewing late-May advance from 610 to 647 as short-covering event within structural bear market expecting seasonal June-August harvest pressure to drive prices toward 550-575 support as global stocks at 951.5 million tonnes overwhelm U.S. regional production concerns

Why is Wheat moving this week?

Continued breakdown from last week's BEARISH conviction 5 call that correctly captured -4.95% move (610.5 to 580.25) as managed money net short positioning surged to -57,871 contracts per June 2 COT data representing largest single-week bearish positioning shift on record since 2006 removing any remaining squeeze fuel from market structure

What does the Wheat volatility picture look like?

Wheat volatility is currently at the 72th percentile over 90 days, in a high regime with stable trend. Realised vol: 5-day 32%, 20-day 33.5%, 60-day 28%.

Does Wheat have a seasonal bias this month?

In June 2026, Wheat has historically shown a bullish pattern with 65% consistency. Winter wheat harvest begins, weather-driven.

What does the COT report show for Wheat?

Managed money executed historic bearish shift to net short -57,871 contracts as of June 2 COT data adding 39,165 contracts in single week representing largest Tuesday-to-Tuesday bear move on record back to 2006 per Barchart removing all squeeze potential and creating positioning setup where only fresh bullish catalyst can reverse trend momentum

Explore More
Want the Full Wheat Intelligence Briefing?

This analysis covers one dimension. Our full weekly report combines six specialist agents into a single actionable briefing with directional bias, key levels, and risk-opportunity matrix.

Start Free — Get the Market of the Week

Free weekly report · No credit card · Upgrade anytime