Wheat COT & Institutional Positioning — Smart Money Analysis
Wheat institutional positioning: COT data, sentiment analysis and smart money flow assessment.

Institutional Positioning
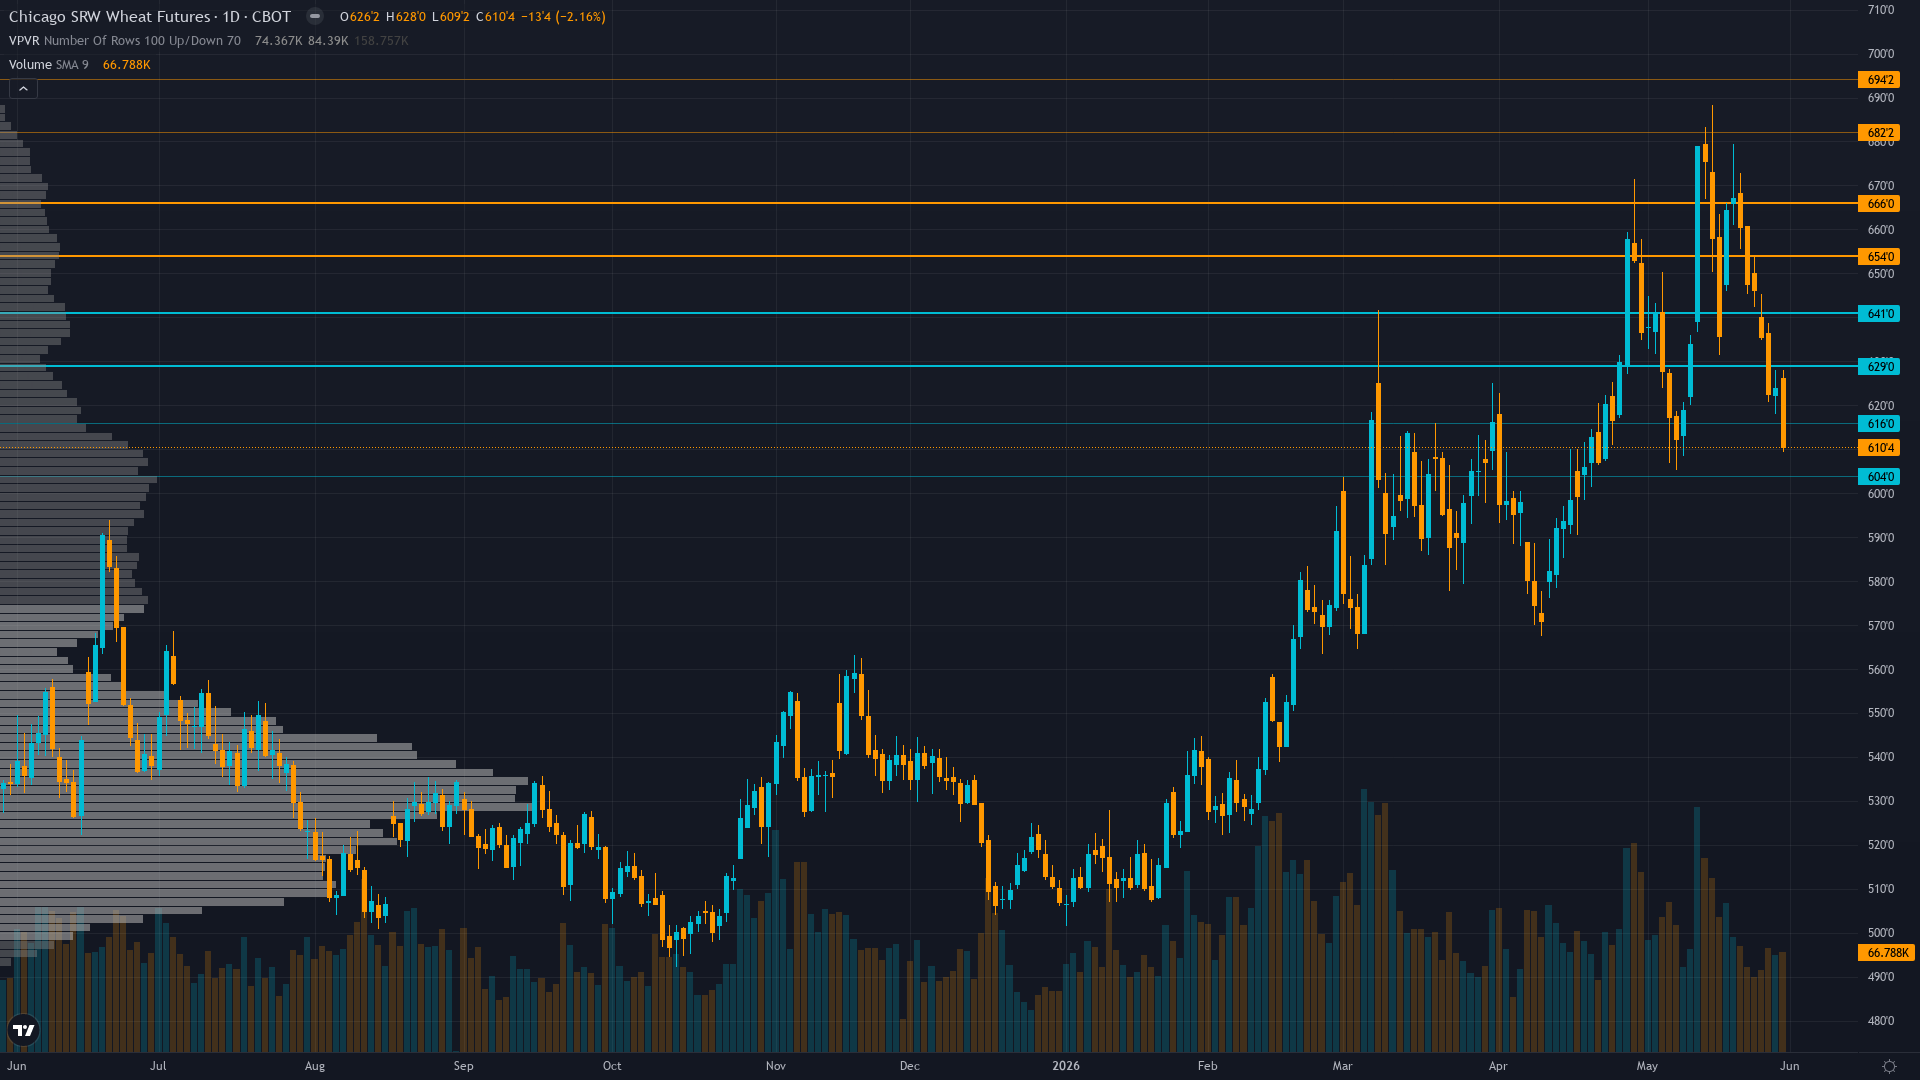
wheat sits at 610.5, having shed 2.00% as bears maintain the upper hand.
Managed money net short -16.7K contracts as of May 8 representing dramatic flip from marginal net long in early May, yet positioning approaching neutral mid-range after 84% of extreme February shorts already covered removes asymmetric squeeze potential that characterized prior rallies
Where We Agree & Diverge
Market consensus: Bearish following May 13 WASDE rally reversal with market viewing advance as weather scare within structural oversupply environment expecting seasonal June-August harvest pressure to drive prices toward 575-590 support as global stocks at 954.6 million tonnes overwhelm U.S. regional tightening
Primary driver: Severe technical breakdown from 647 to 610.50 (-5.68% weekly decline) following May 29 MISSED BULLISH call erases two-week rally and confirms failure of drought-driven thesis as price breaks below critical 620 support despite May 13 WASDE production shock showing 1,561 million bushels (lowest since 1972)
Consensus Gaps
Desk BEARISH stance at conviction 5 aligns broadly with market consensus following May 13 WASDE rally reversal and technical breakdown below 620 support - minimal divergence as both desk and consensus acknowledge fundamental drought concerns now fully priced with seasonal June-August harvest pressure and global oversupply at 954.6 million tonnes expected to dominate near-term price action toward 575-590 support absent fresh catalyst
Sentiment Analysis
Positioning in wheat futures is balanced, with neither bulls nor bears holding a decisive edge. Neutral sentiment typically precedes a directional catalyst.
Derivatives Intelligence
Insufficient data available for ZW options markets due to thin agricultural derivatives liquidity - IV metrics not accessible through public sources limiting directional signal clarity from options positioning
Net Assessment
The institutional landscape for wheat price shows neutral sentiment. Trend strength sits at 4/10, reflecting moderate directional pressure without clear dominance. The combination of positioning data, sentiment, and options flow provides context for understanding where smart money is leaning heading into the week.
This analysis covers one dimension. Our full weekly report combines six specialist agents into a single actionable briefing with directional bias, key levels, and risk-opportunity matrix.
Start Free — Get the Market of the WeekFree weekly report · No credit card · Upgrade anytime