TRANSITIONAL MACRO ENVIRONMENT WITH VIX AT 17.26 (NEUTRAL ZONE BELOW 20 THRESHOLD) INDICATING BALANCED EQUITY MARKET PSYCHOLOGY, USD WEAKNESS TO 97.7 DXY SUPPORTING U.S. EXPORT COMPETITIVENESS, CRUDE OIL RETREATING FROM $111 HIGHS TO SUB-$95 LEVELS EASING INPUT COST PRESSURES, YET COMMODITY-SPECIFIC DROUGHT FUNDAMENTALS DOMINATE DIRECTIONAL DYNAMICS OVER BROAD RISK APPETITE SIGNALS CREATING BIFURCATED REGIME WHERE MACRO BACKDROP SUPPORTS YET AGRICULTURAL SUPPLY CONCERNS DRIVE
Institutional Positioning
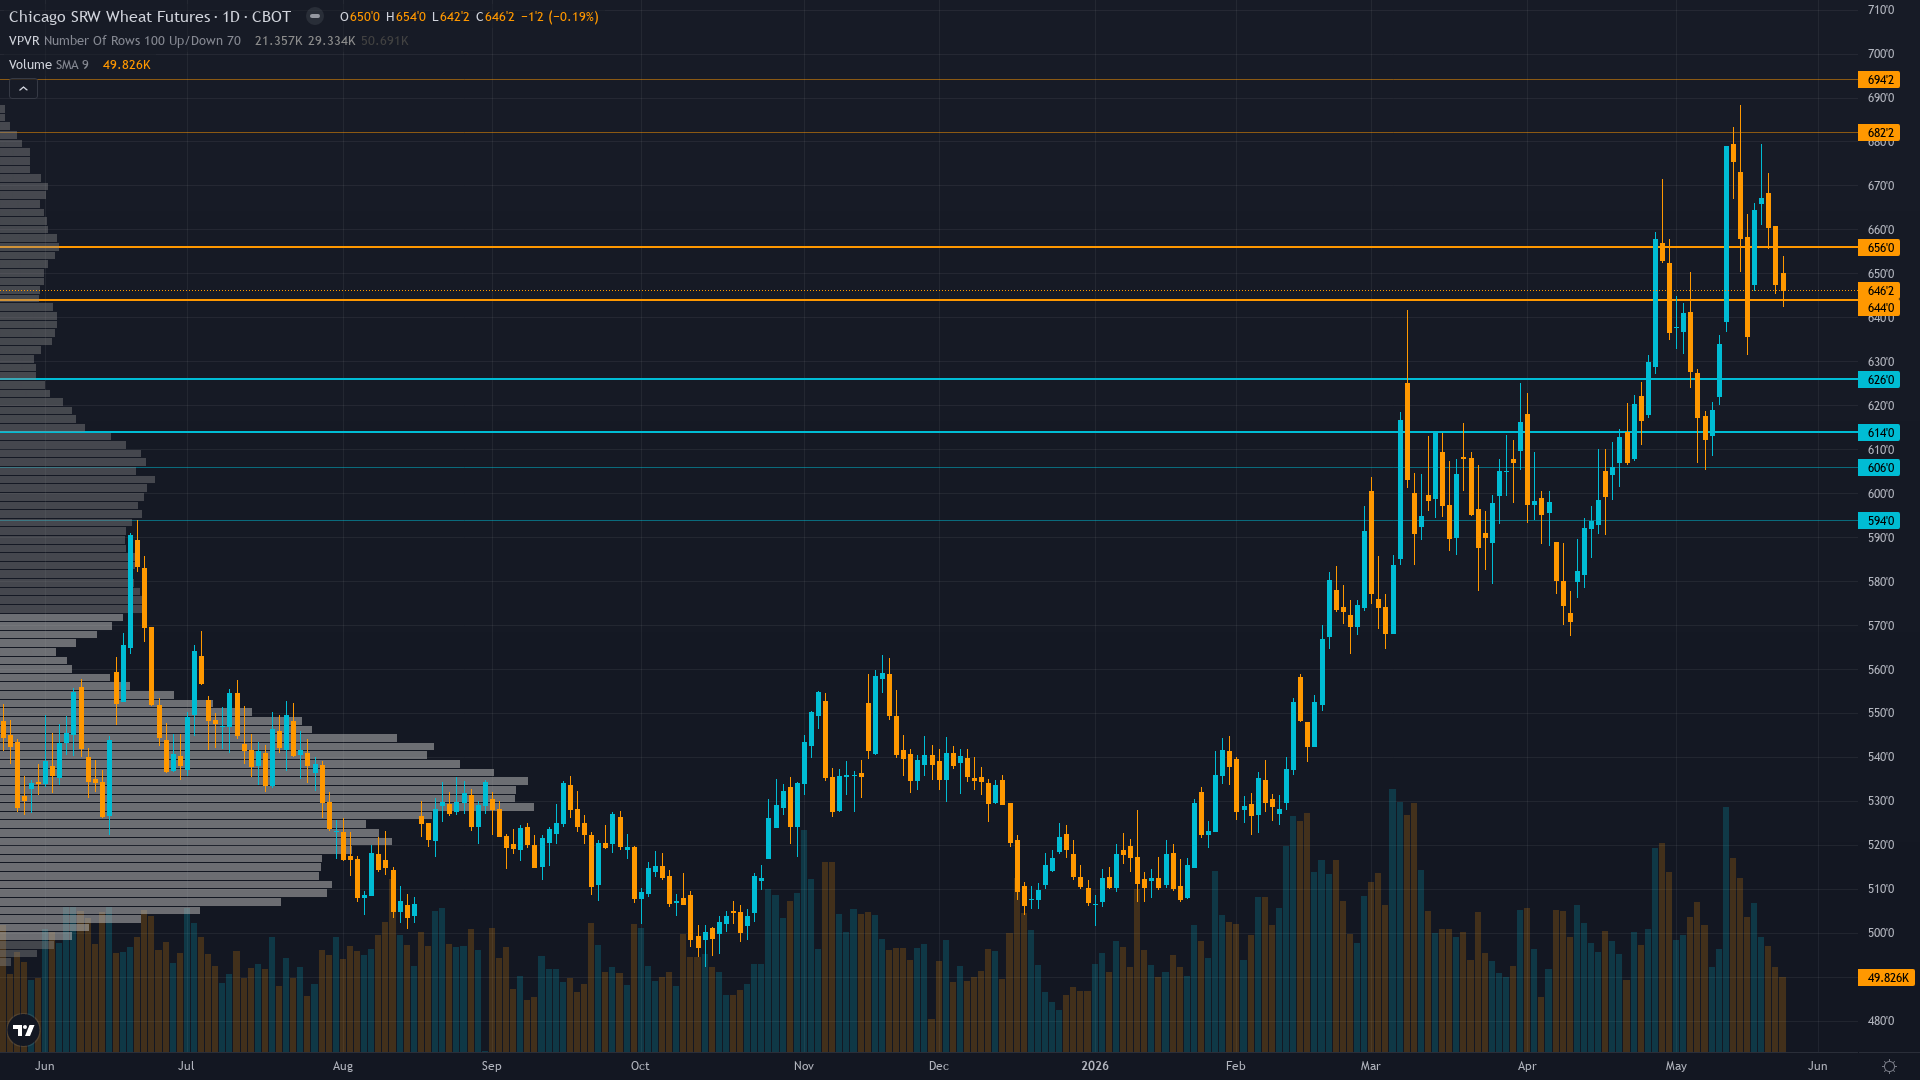
At 647, wheat has inched 0.14% higher in a measured advance.
Managed money net short -53,852 contracts per May 5 COT data representing shift from marginal net long +0.9K in prior period to decisive short position, yet absolute positioning remains mid-range (45th-55th percentile) without extreme after 84% of peak shorts covered creating balanced two-way risk with modest squeeze potential if production concerns intensify yet limited fuel for explosive moves versus February-March rally from extreme oversold
Crowd Psychology
Neither side has committed heavily to wheat futures, leaving sentiment in a neutral zone that offers little directional guidance on its own.
Options Flow
Implied volatility data unavailable for current wheat options contracts with thin agricultural derivatives markets limiting directional signal clarity, yet historical WASDE-driven volatility events typically produce 30-50% expansion over 1-2 weeks suggesting current elevated volatility around 70th percentile consistent with post-binary-event positioning phase
Market Consensus vs Our Analysis
Market consensus: Cautiously bullish on May 12 WASDE production downgrades confirming most severe U.S. wheat shortfall since 1972 with crop conditions at 28% good-to-excellent versus 46% last year, yet increasingly concerned about sustainability above 650 given 6% pullback from May 12 highs, global stocks at 951.5 million tonnes (34.52% stocks-to-use ratio), and approaching seasonal June-August harvest pressure period
Primary driver: May 12 WASDE bullish production shock showing U.S. wheat output at 1,561 million bushels (lowest since 1972, down 21.3% YoY) with crop conditions at 28% good-to-excellent versus 46% last year and 69% of winter wheat areas in drought, yet current price at 647 already reflects substantial weather premium 32% above October lows suggesting much of the supply tightening is priced while global stocks remain at record 951.5 million tonnes
Putting It Together
In summary, the positioning picture for wheat reflects neutral conviction levels set against a consolidating after rally market backdrop. Trend strength sits at 6/10, reflecting a market that has directional bias but hasn't reached extreme conviction. The interplay between smart money activity, retail sentiment, and options market signals will shape how this positioning resolves.
Consensus vs Reality
Last Week's Consensus
“Cautiously bullish on May 12 WASDE production downgrades confirming most severe U.S. wheat shortfall since 1972 yet increasingly skeptical about sustainability above 650 given 7.6% pullback from highs, May 8 frost fears proving unfounded, and global stocks at 34.52% stocks-to-use ratio suggesting structural oversupply may overwhelm U.S. regional supply tightening”
▲
What Actually Happened
+1.77%
635.75 → 647
Frequently Asked Questions
What is the Wheat forecast this week?
Cautiously bullish on May 12 WASDE production downgrades confirming most severe U.S. wheat shortfall since 1972 with crop conditions at 28% good-to-excellent versus 46% last year, yet increasingly concerned about sustainability above 650 given 6% pullback from May 12 highs, global stocks at 951.5 million tonnes (34.52% stocks-to-use ratio), and approaching seasonal June-August harvest pressure period
Why is Wheat moving this week?
May 12 WASDE bullish production shock showing U.S. wheat output at 1,561 million bushels (lowest since 1972, down 21.3% YoY) with crop conditions at 28% good-to-excellent versus 46% last year and 69% of winter wheat areas in drought, yet current price at 647 already reflects substantial weather premium 32% above October lows suggesting much of the supply tightening is priced while global stocks remain at record 951.5 million tonnes
What does the Wheat volatility picture look like?
Wheat volatility is currently at the 70th percentile over 90 days, in a high regime with stable trend. Realised vol: 5-day 29%, 20-day 32.5%, 60-day 27%.
Does Wheat have a seasonal bias this month?
In May 2026, Wheat has historically shown a bullish pattern with 62% consistency. Crop condition reports and weather risk peak.
What does the COT report show for Wheat?
Managed money net short -53,852 contracts per May 5 COT data representing shift from marginal net long +0.9K in prior period to decisive short position, yet absolute positioning remains mid-range (45th-55th percentile) without extreme after 84% of peak shorts covered creating balanced two-way risk with modest squeeze potential if production concerns intensify yet limited fuel for explosive moves versus February-March rally from extreme oversold
This analysis covers one dimension. Our full weekly report combines six specialist agents into a single actionable briefing with directional bias, key levels, and risk-opportunity matrix.