TRANSITIONAL MACRO ENVIRONMENT WITH VIX AT 17.99 (NEUTRAL ZONE BELOW 20 THRESHOLD) INDICATING CALM EQUITY MARKETS, USD WEAKENING TO 97.7 DXY (DOWN 2.42% YOY) FOLLOWING DOVISH FED LEADERSHIP TRANSITION TO CHAIR WARSH SUPPORTING U.S. EXPORT COMPETITIVENESS, CRUDE OIL DECLINING FROM $106 EARLY-MAY HIGHS TO $89/BBL ON IRAN CEASEFIRE EASING GEOPOLITICAL PREMIUM, CREATING MIXED CROSS-CURRENTS WHERE IMPROVING MACRO BACKDROP SUPPORTS AGRICULTURAL FUNDAMENTALS YET COMMODITY-SPECIFIC SUPPLY TENSIONS DOMINATE WHEAT DIRECTIONAL DYNAMICS
Institutional Positioning
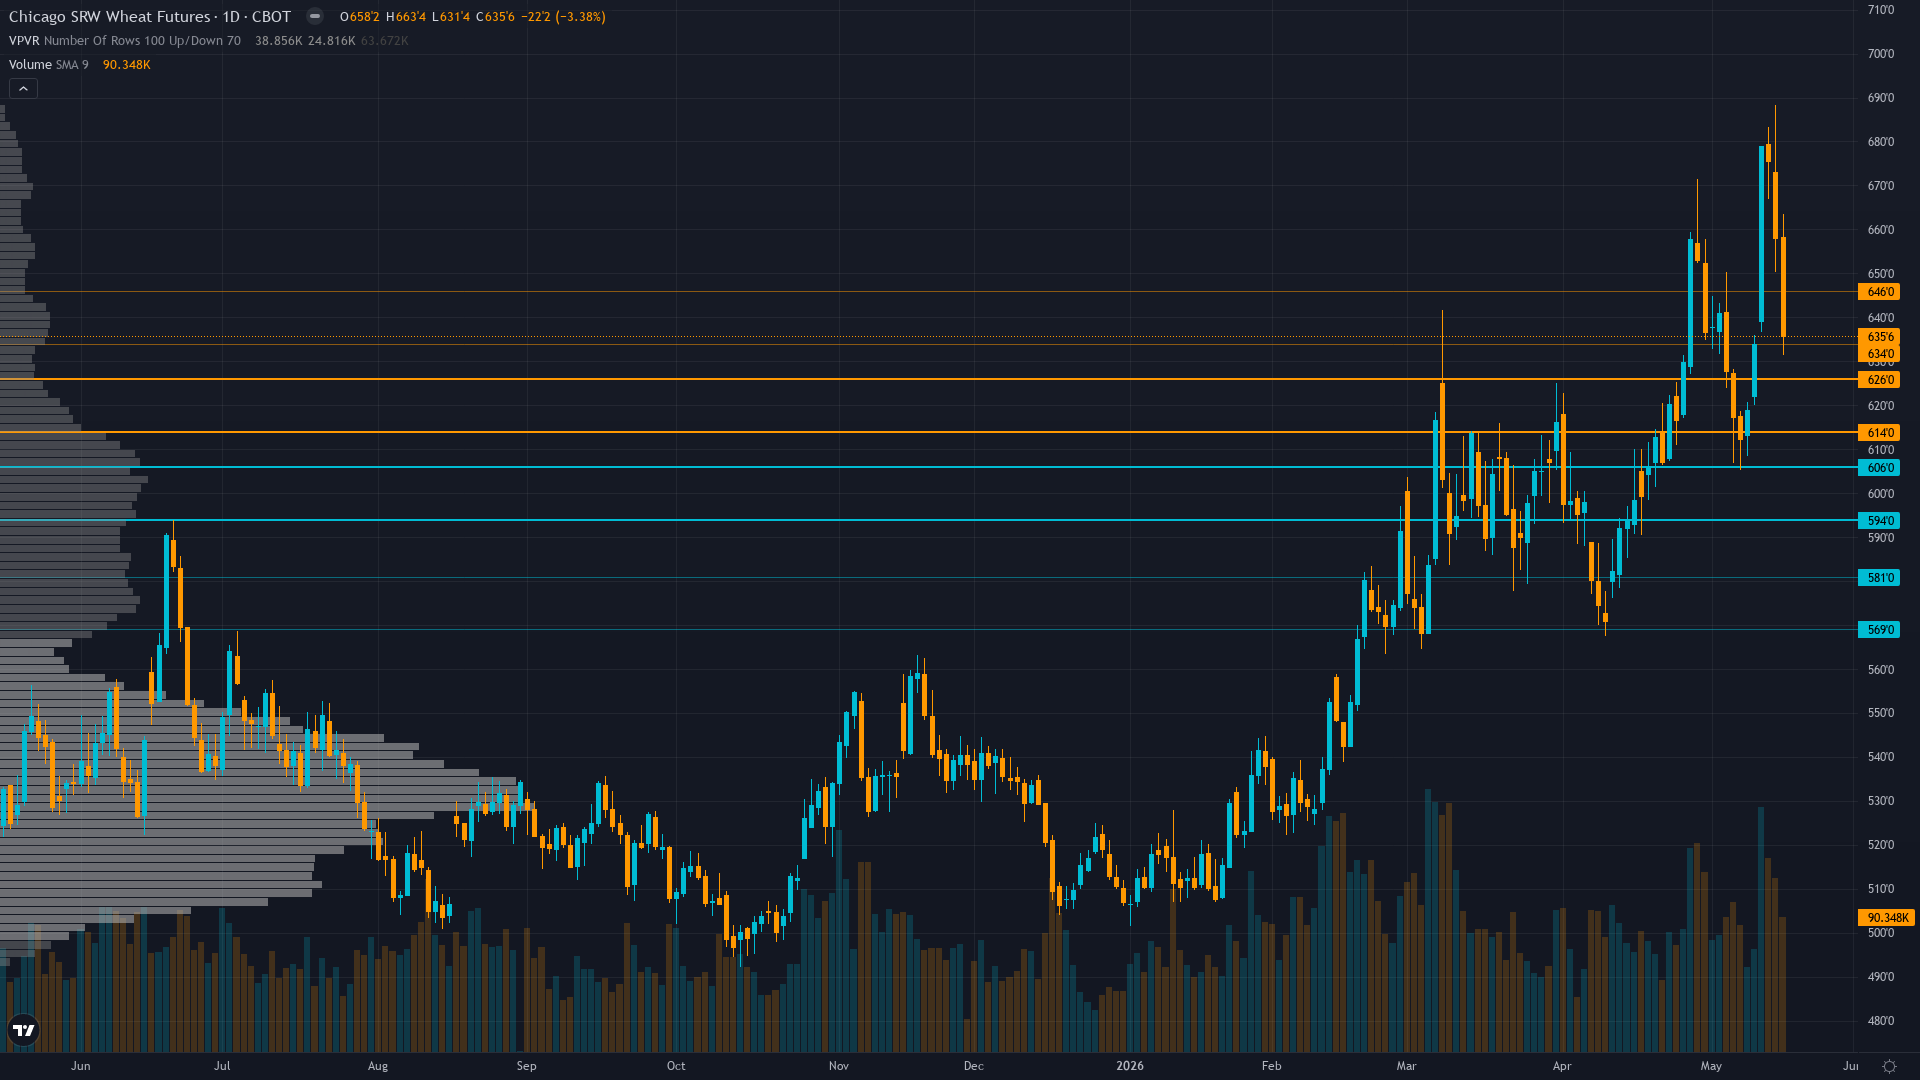
wheat sits at 635.75, having shed 3.38% as bears maintain the upper hand.
Managed money net short -53,852 contracts as of May 5 following dramatic reversal from marginal net long +0.9K to decisive net short representing material single-week positioning shift removing squeeze fuel yet positioning remains in mid-range without extreme creating balanced two-way risk ahead of seasonal June-July harvest pressure
Crowd Psychology
Neither side has committed heavily to wheat futures, leaving sentiment in a neutral zone that offers little directional guidance on its own.
Options Flow
Insufficient granular data available for ZW options markets with thin agricultural derivatives limiting directional signal clarity, implied volatility metrics inaccessible through public sources consistent with low liquidity commodity options environment
Market Consensus vs Our Analysis
Market consensus: Cautiously bullish on May 12 WASDE production downgrades confirming most severe U.S. wheat shortfall since 1972 yet increasingly skeptical about sustainability above 650 given 7.6% pullback from highs, May 8 frost fears proving unfounded, and global stocks at 34.52% stocks-to-use ratio suggesting structural oversupply may overwhelm U.S. regional supply tightening
Primary driver: May 12 WASDE confirmed most severe U.S. wheat production shortfall since 1972 with output down 21% YoY to 1,561 million bushels and crop conditions deteriorated to 28% good-to-excellent versus 46% last year, creating material supply-side catalyst that has driven prices 27% above year-ago levels yet market consolidating at 635.75 following 3.38% pullback from May 14 highs near 688 as frost fears proved unfounded
Putting It Together
In summary, the positioning picture for wheat reflects neutral conviction levels set against a consolidating after pullback market backdrop. Trend strength at 5/10 paints a picture of a market with some direction but lacking strong conviction. The interplay between smart money activity, retail sentiment, and options market signals will shape how this positioning resolves.
Consensus vs Reality
Last Week's Consensus
“Mixed to cautiously bullish on U.S. Plains drought damage supporting prices with wheat rallying to two-year highs in late April yet skeptical about sustainability above 620 given recent 6% pullback on rainfall forecasts and global oversupply fundamentals with market awaiting May 12 WASDE clarity”
▲
What Actually Happened
+3.94%
611.63 → 635.75
Key Questions Answered
What direction is Wheat likely to move?
Cautiously bullish on May 12 WASDE production downgrades confirming most severe U.S. wheat shortfall since 1972 yet increasingly skeptical about sustainability above 650 given 7.6% pullback from highs, May 8 frost fears proving unfounded, and global stocks at 34.52% stocks-to-use ratio suggesting structural oversupply may overwhelm U.S. regional supply tightening
What is driving Wheat price this week?
May 12 WASDE confirmed most severe U.S. wheat production shortfall since 1972 with output down 21% YoY to 1,561 million bushels and crop conditions deteriorated to 28% good-to-excellent versus 46% last year, creating material supply-side catalyst that has driven prices 27% above year-ago levels yet market consolidating at 635.75 following 3.38% pullback from May 14 highs near 688 as frost fears proved unfounded
What is the current volatility regime for Wheat?
Wheat is trading in a high volatility environment, with the 90-day percentile at 70. Realised vol reads 29% (5d), 32.5% (20d), and 27% (60d), with the trend stable.
Are there seasonal tendencies for Wheat right now?
Historical seasonal data shows a bullish tendency for Wheat in May 2026 with a 62% win rate. Crop condition reports and weather risk peak.
How are institutions positioned in Wheat?
Managed money net short -53,852 contracts as of May 5 following dramatic reversal from marginal net long +0.9K to decisive net short representing material single-week positioning shift removing squeeze fuel yet positioning remains in mid-range without extreme creating balanced two-way risk ahead of seasonal June-July harvest pressure
This analysis covers one dimension. Our full weekly report combines six specialist agents into a single actionable briefing with directional bias, key levels, and risk-opportunity matrix.