Wheat COT & Institutional Positioning — Smart Money Analysis
Wheat institutional positioning: COT data, sentiment analysis and smart money flow assessment.

Institutional Positioning
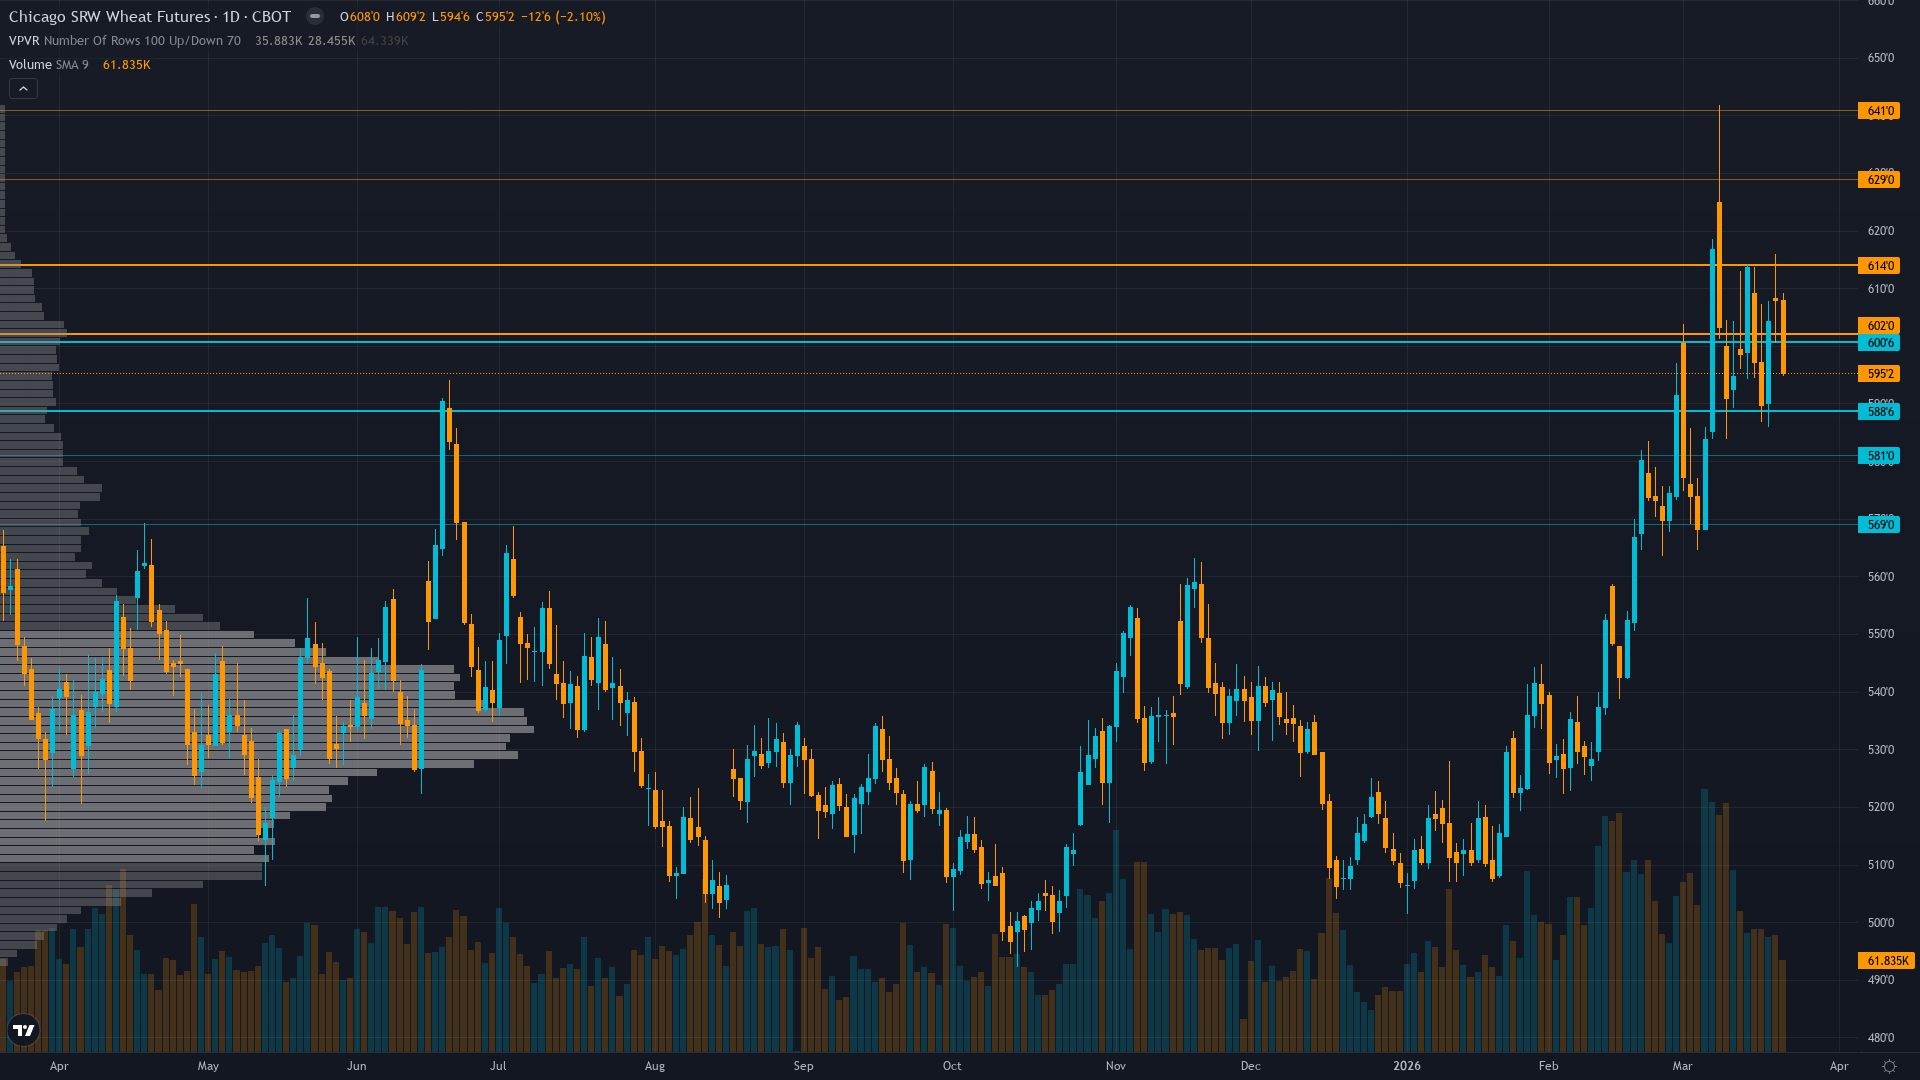
At 595.25, wheat has dropped 1.94% with sellers in control of the session.
Spec shorts reduced to 17,758 contracts from extreme 109,483 peak representing 84% covering exhaustion removing primary fuel for further rally with positioning now near neutral creating two-way risk
Where We Agree & Diverge
Market consensus: Cautiously bearish following March rally reversal with market viewing advance as short-covering event within structural bear market expecting mean reversion toward 575-590 once weather premium fully dissipates and positioning dynamics stabilize
Primary driver: Sharp technical breakdown from March 19 intraday high near 609 to current 595.25 erasing rally gains and confirming failed breakout structure with declining open interest signaling weakening conviction despite structural oversupply fundamentals remaining dominant
Consensus Gaps
Desk NEUTRAL stance aligns broadly with market consensus expecting mean reversion from rally extremes with limited divergence as both desk and consensus acknowledge positioning exhaustion and fundamental headwinds already priced while technical breakdown confirms reversal thesis
Sentiment Analysis
Positioning in wheat futures is balanced, with neither bulls nor bears holding a decisive edge. Neutral sentiment typically precedes a directional catalyst.
Derivatives Intelligence
Implied volatility elevated at 37.79% in May 2026 options up 58% from December levels reflecting binary event premium and continued two-way risk though thin options markets limit directional signal clarity
Net Assessment
The institutional landscape for wheat price shows fear sentiment. Trend strength sits at 4/10, reflecting moderate directional pressure without clear dominance. The combination of positioning data, sentiment, and options flow provides context for understanding where smart money is leaning heading into the week.
This analysis covers one dimension. Our full weekly report combines six specialist agents into a single actionable briefing with directional bias, key levels, and risk-opportunity matrix.
Start Free — Get the Market of the WeekFree weekly report · No credit card · Upgrade anytime


