S&P 500 Key Levels This Week — Support, Resistance & Confluence Zones
S&P 500 key levels breakdown: support zones, resistance zones, confluence and price structure.

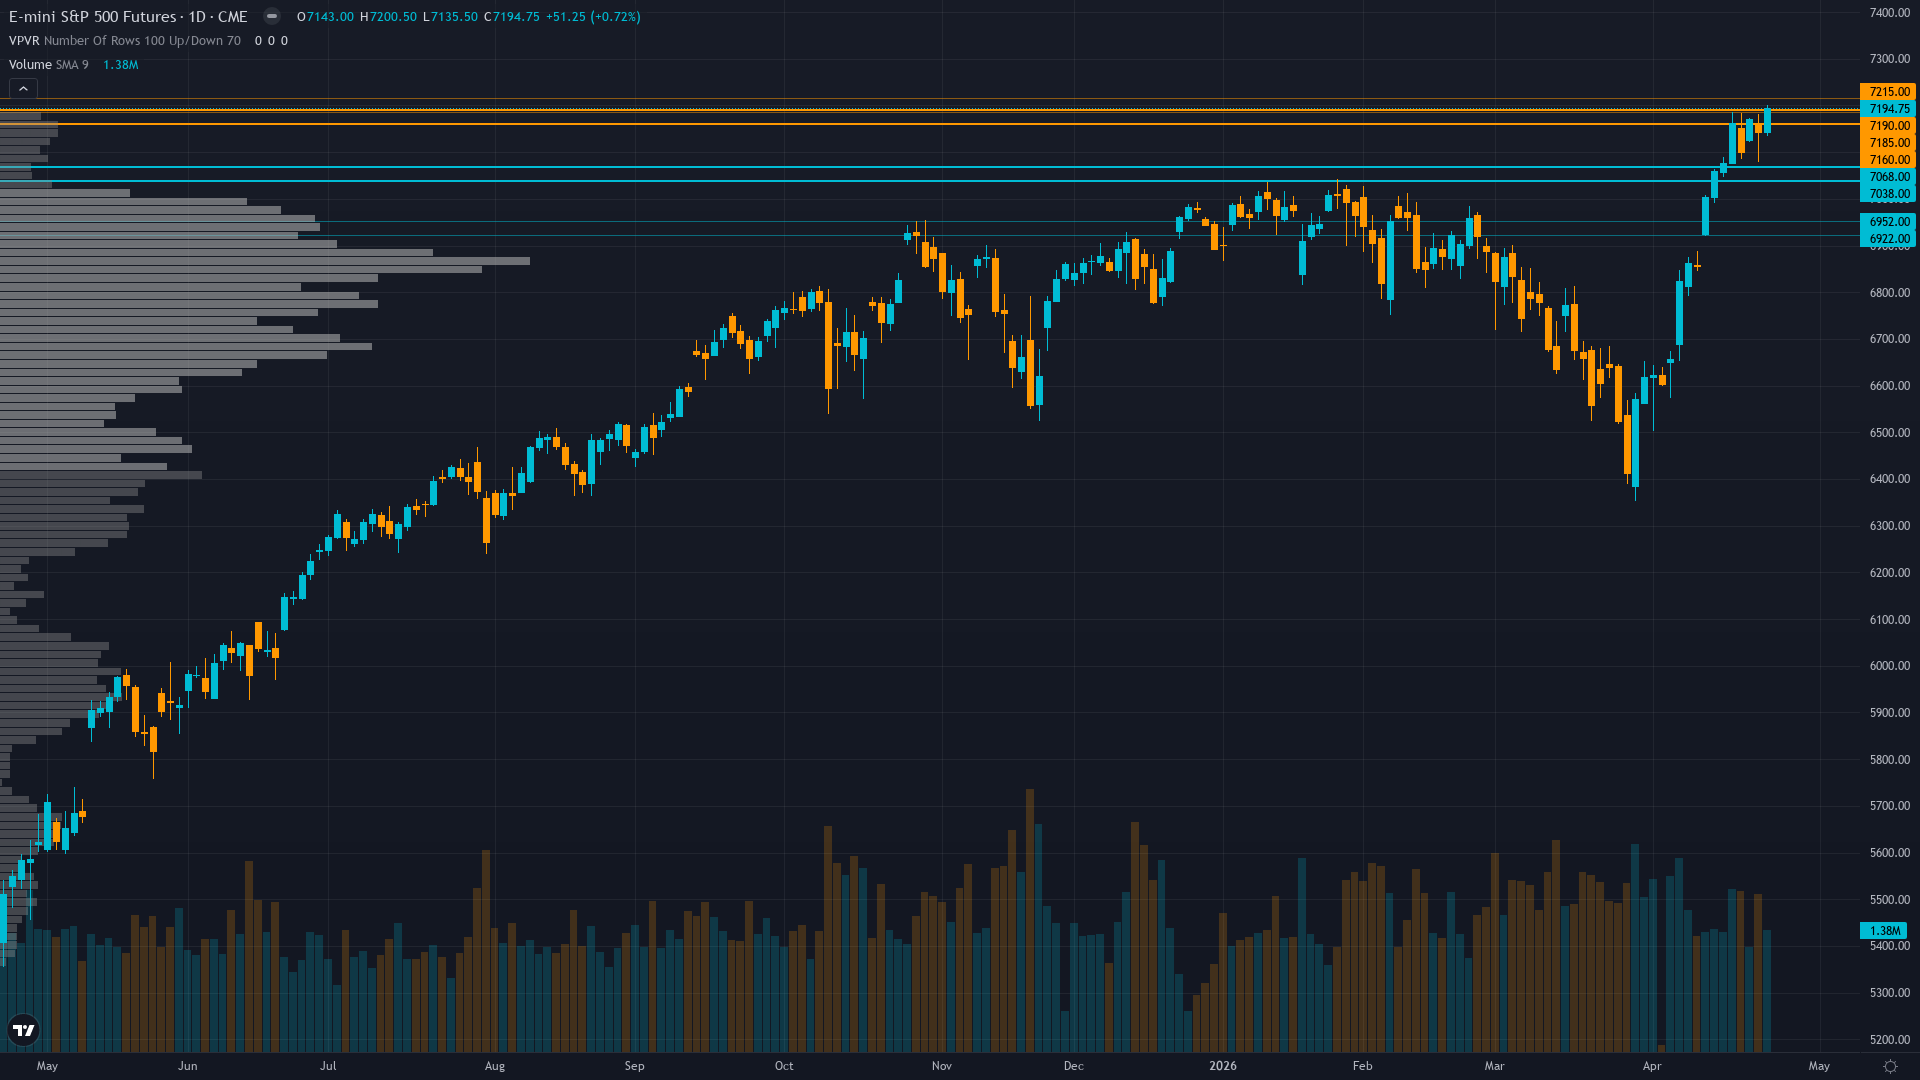
Where Price Sits
S&P 500 is trading at 7194.75, up a modest 0.72% as the market edges higher. Price action in S&P 500 futures has compressed into a consolidation pattern, typically a precursor to a directional breakout.
ES at 7,194.75 testing 7,200 resistance with RSI 68.62 elevated but not overbought, above 50-day MA 6,979 and 200-day MA 6,705 confirming bullish structure yet momentum waning after testing intraday high 7,200.50
Trend strength sits at 7/10, reflecting a market that has directional bias but hasn't reached extreme conviction.
Floors & Demand Zones
ES futures has identifiable support zones below current price where buying interest has historically emerged. These zones represent areas where institutional participants have previously defended price, creating potential floors for pullbacks.
How effectively these zones hold depends on the prevailing regime and whether the volume profile confirms institutional participation.
Resistance Architecture
Above current price, S&P index encounters structural resistance defined by prior supply zones and profit-taking clusters. These barriers must be overcome convincingly for the upside thesis to develop.
The reliability of resistance depends on the number of touches and the volume traded at each level.
Multi-Agent Confluence
What separates high-probability levels from noise is multi-discipline agreement. The key zones for ES futures are those where technical structure aligns with institutional positioning and options market activity.
Normal volatility regime suggests 1.0-1.5% daily ES moves expected with current 7,100-7,200 consolidation representing 1.4% range - FOMC binary outcome April 29 presents asymmetric expansion risk with potential 2-3% intraday swings on Powell rhetoric surprise either direction
The Intelligence Behind the Levels
Our multi-agent system analyses key levels from six perspectives simultaneously: technical structure identifies the zones, institutional positioning reveals where smart money is engaged, options flow shows where hedging clusters, fundamentals assess whether levels align with fair value, sentiment measures crowd positioning around levels, and economic data flags catalysts that could trigger level tests.
The result is a set of levels that reflect genuine multi-agent consensus, not the output of a single indicator or a retail trader drawing trendlines.
Our paid reports include specific support and resistance levels identified by six specialist agents — technical structure, institutional positioning, options flow, fundamentals, sentiment, and economic analysis. Not just lines on a chart, but zones validated by multi-discipline confluence.
Start Free — Get the Market of the WeekFree weekly report · No credit card · Upgrade anytime


