S&P 500 Key Levels This Week — Support, Resistance & Confluence Zones
S&P 500 key levels breakdown: support zones, resistance zones, confluence and price structure.

Structural Assessment
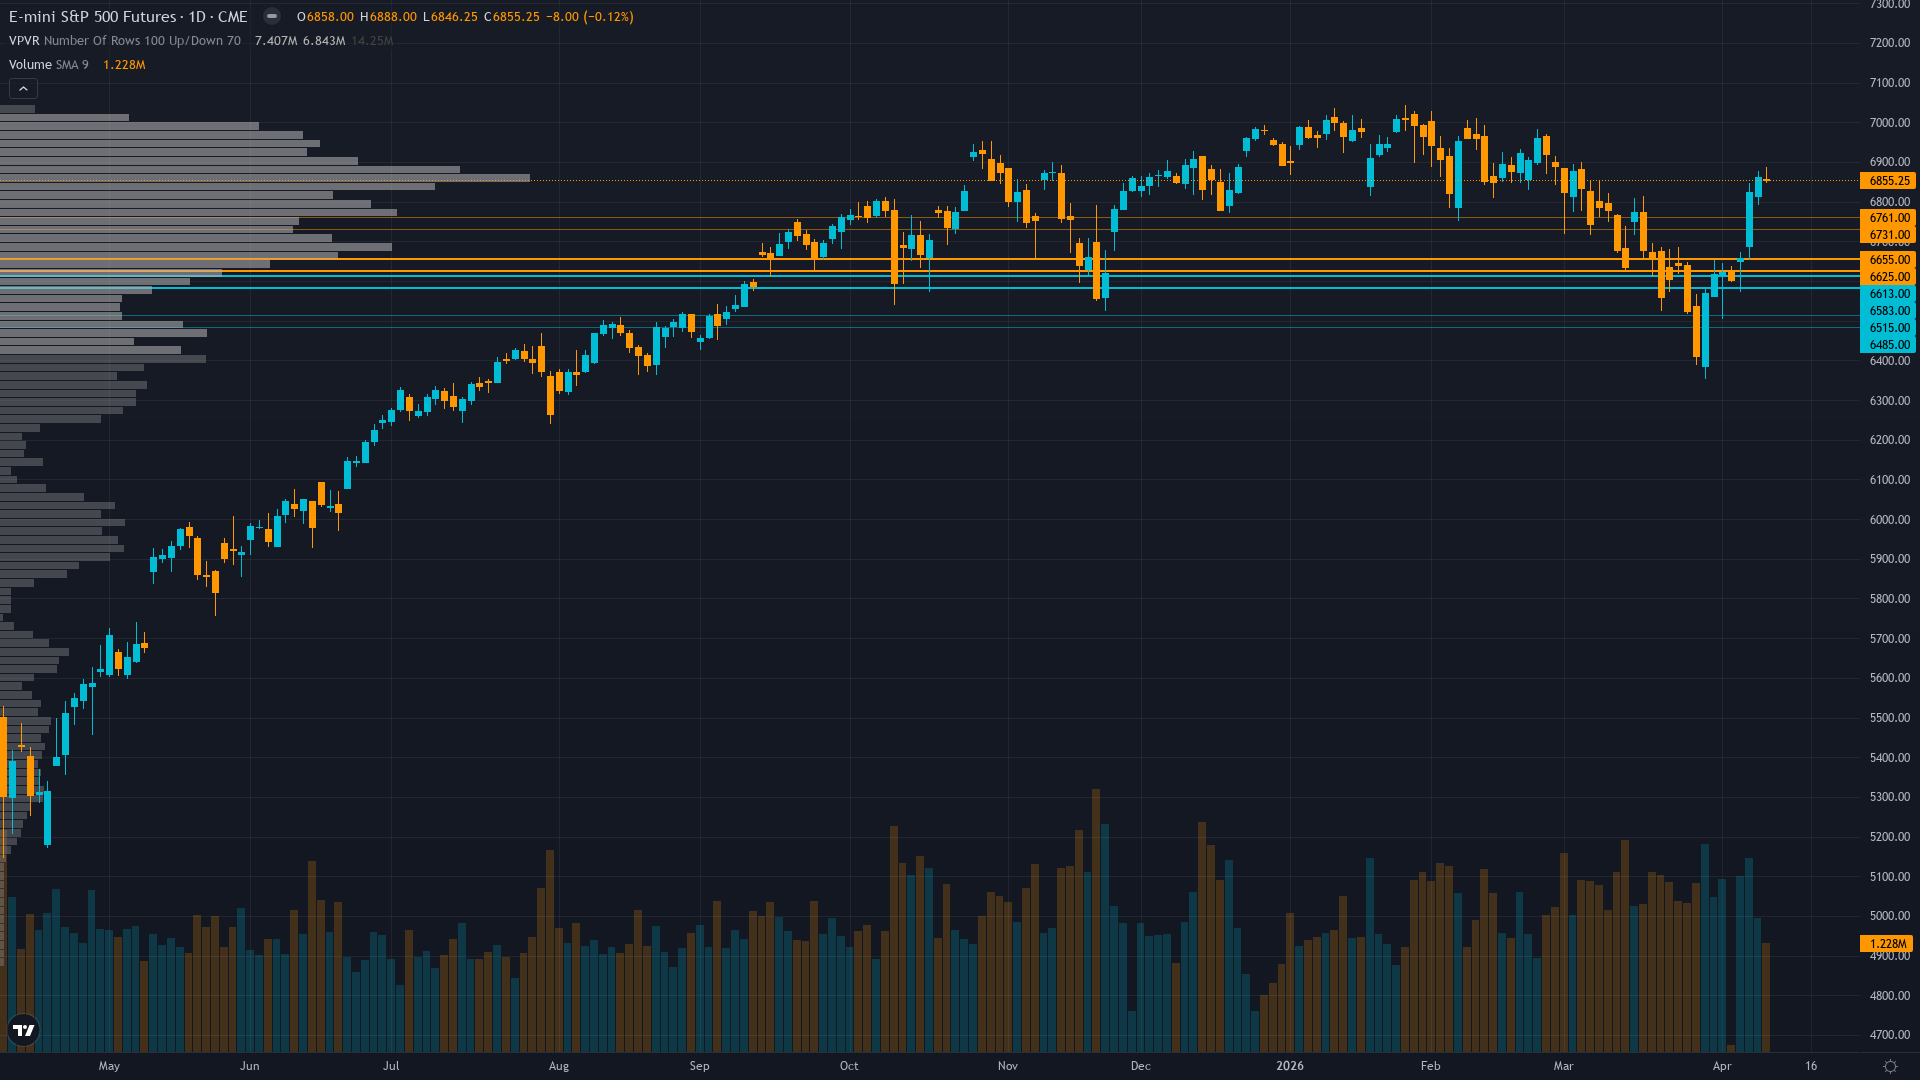
Trading at 6855.25 with a 0.12% dip, S&P 500 is giving back ground gradually. S&P 500 futures is consolidating, with price compressing into a narrower range as the market builds energy for its next move.
Recovering from March breakdown - ES now above 200-day MA 6664 after reclaiming 6850 but RSI 69.37 approaching overbought suggesting momentum exhaustion near 6888-6900 resistance zone
At 7/10, trend strength indicates a solid directional lean without being overextended.
Support Architecture
Support levels for S&P 500 are defined by zones of prior institutional demand. The depth and frequency of prior tests at these levels determines their likely strength.
The strength of support depends on the current consolidating regime and volume profile at each level.
Upside Barriers
Resistance levels above SPX futures current price represent zones of historical supply. The significance of each level scales with the number of prior tests and the volume traded there.
The current consolidating regime influences how aggressively these resistance zones are likely to be tested and whether they hold or fold.
Confluence & Methodology
Confluence is the differentiator between a line on a chart and a level worth trading. For S&P 500 futures, the zones with the highest conviction are those validated across technical, institutional, and derivatives dimensions simultaneously.
Normal volatility regime suggests 1.0-1.5% daily ES moves expected with current 6850-6900 consolidation representing 0.7% range - earnings season binary outcomes present asymmetric expansion risk with potential 2-3% intraday swings on major misses or guidance cuts
Beyond Lines on a Chart
Our approach to key levels is designed to filter noise from signal. Six independent agents each assess the same price zones from different perspectives. A level confirmed by one discipline is interesting. A level confirmed by four or five is worth building a trade plan around.
This multi-discipline approach means the levels in our paid reports carry institutional-grade confluence — not just lines on a chart, but zones validated across every analytical dimension that matters.
Our paid reports include specific support and resistance levels identified by six specialist agents — technical structure, institutional positioning, options flow, fundamentals, sentiment, and economic analysis. Not just lines on a chart, but zones validated by multi-discipline confluence.
Start Free — Get the Market of the WeekFree weekly report · No credit card · Upgrade anytime


