S&P 500 Forecast This Week — Outlook, Drivers & Key Levels
This week's S&P 500 outlook: key drivers, volatility context, risk-opportunity assessment and the week ahead.

Where Things Stand
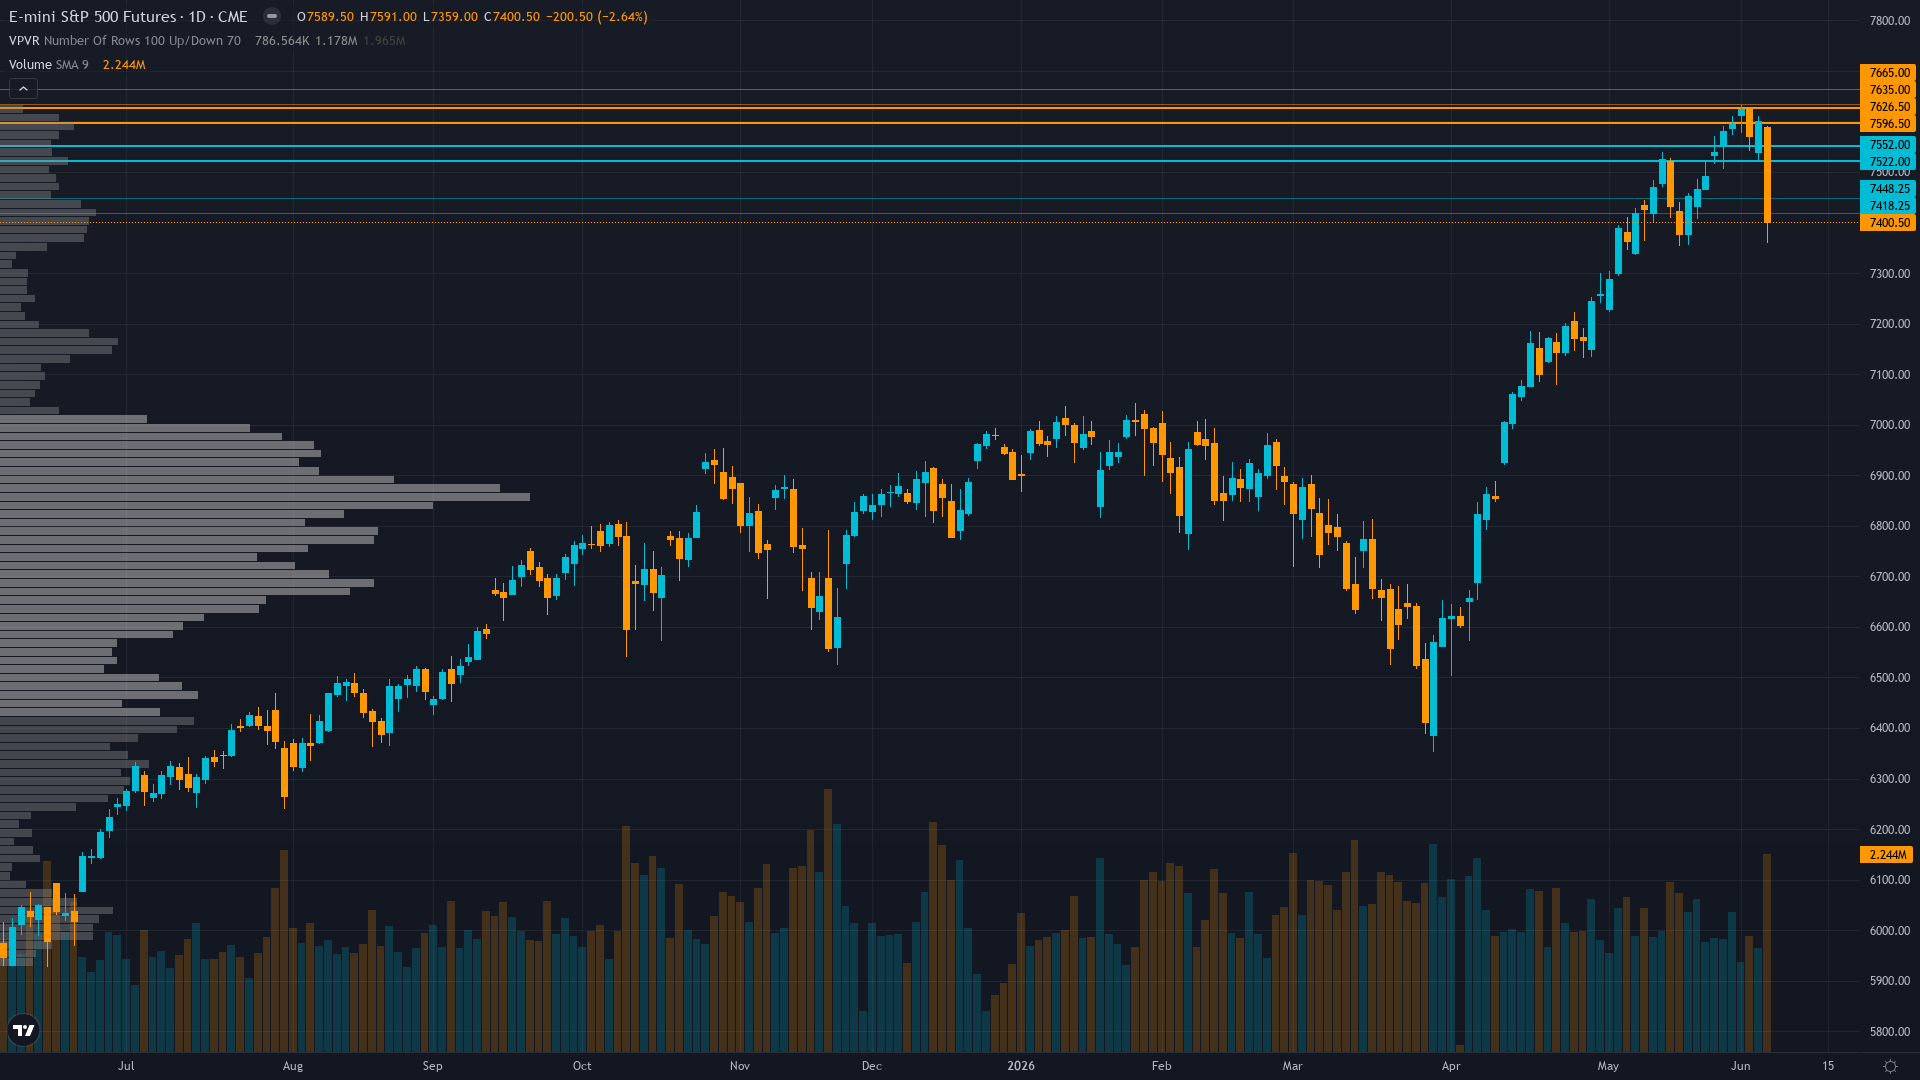
S&P 500 sits at 7400.5, having shed 2.64% as bears maintain the upper hand. S&P 500 futures is in a breaking down market state, requiring careful assessment of current conditions.
Divided between RSI oversold bounce buyers targeting 7,500-7,550 relief rally and breakdown sellers expecting 7,300-7,200 continuation as June 16-17 FOMC binary outcome determines resolution with majority positioning defensively after June 5 worst-day-of-year selloff
What's Driving Price
Primary driver: Violent June 5 VIX spike to 21.51 (+39.68%) shattered 6-week BULLISH consensus as ES collapsed from 7,589.50 all-time highs to 7,400.50 on May NFP beat (172K vs 85K) triggering Fed rate hike repricing and exposing extreme positioning vulnerability at critical 200-day MA 7,403.27 inflection
Secondary factor: Options market regime shift from extreme complacency (May 31 put/call 0.39) to defensive hedging (June 5 SPX put/call 1.32) combined with RSI 19.67 severely oversold creates dual scenario: technical capitulation bounce toward 7,537-7,561 versus continuation breakdown below 7,384 testing 7,300 major support
Additional influence: 6-week BULLISH streak terminated with -2.91% MISSED call exposes thesis staleness as Q1 earnings catalyst fully priced while June 16-17 FOMC binary risk converges with May NFP upside surprise validating higher-for-longer Fed policy removing dovish pivot assumptions
Economic backdrop: Fed at 3.50-3.75% after May NFP beat 172K vs 85K expected validates labor resilience removing near-term cut probability, ISM Manufacturing 54.0 expansion supports soft landing but June 16-17 FOMC binary catalyst scrutinizes forward guidance after May data strength
Fundamental assessment: Forward PE 21.1x elevated at May 31 +11% premium to 10-year average 19.0 justified by Goldman 24% 2026 EPS growth projections, but June 5 selloff reprices higher-for-longer Fed policy after May NFP 172K beat validates restrictive stance testing valuation assumptions
Chart Assessment
Critical breakdown - ES at 7,400.50 precisely at 200-day MA 7,403.27 after violating 50-day MA 7,561.51 on June 5, RSI 19.67 severely oversold marks deepest reading since March creating mean-reversion potential yet lower-high/lower-low pattern confirms trend reversal from May 31 highs
With trend strength at only 3/10, any directional bias is thin and easily disrupted.
Risk & Opportunity
Primary risk: Breakdown below 200-day MA 7,403.27 confirms trend reversal from May 31 all-time highs triggering systematic deleveraging toward 7,300 then 7,200 major support as June 16-17 FOMC delivers hawkish hold removing accommodative bias following May NFP strength while forward PE 21.1x multiples compress from elevated levels (Probability: medium)
Primary opportunity: RSI 19.67 severe oversold creates 3-7 day capitulation bounce potential toward 7,537 immediate resistance then 7,561 50-day MA if 200-day MA 7,403.27 holds as support and June 16-17 FOMC maintains accommodative rhetoric despite May data strength enabling short-covering rally (Timeframe: June 8-16 2026)
This week's edge: Market may be underestimating severity of RSI 19.67 extreme oversold creating imminent 3-7 day mean-reversion window toward 7,537-7,561 while overestimating breakdown continuation probability given 200-day MA 7,403.27 support holding current price creates technical inflection where capitulation longs enter versus breakdown shorts exit, yet consensus underweights June 16-17 FOMC hawkish rhetoric risk following May NFP beat that triggered June 5 repricing
Volatility Backdrop
ES futures volatility at the 68th percentile reflects a balanced environment where standard risk parameters apply. Volatility expansion is underway, suggesting the market is moving into a phase of heightened activity and wider ranges.
High volatility regime suggests 1.5-2.5% daily ES moves expected with June 5 intraday range 7,359-7,591 representing 3.1% width confirming expansion - June 16-17 FOMC binary outcome presents asymmetric risk with potential 2-4% intraday swings on policy surprise either direction while 200-day MA 7,403.27 creates technical decision point
The Week Ahead
FOMC two-day meeting June 16-17 with Powell press conference, markets price 99% hold probability but June 5 VIX spike to 21.51 and May NFP beat create hawkish rhetoric risk testing 200-day MA support at 7,403.27 critical inflection on Tuesday 16 June is a high-impact catalyst with the potential to redefine the near-term outlook entirely.
How S&P 500 navigates the confluence of breaking down conditions and incoming data will determine whether the current directional thesis holds or breaks.
This analysis covers one dimension. Our full weekly report combines six specialist agents into a single actionable briefing with directional bias, key levels, and risk-opportunity matrix.
Start Free — Get the Market of the WeekFree weekly report · No credit card · Upgrade anytime


