S&P 500 Forecast This Week — Outlook, Drivers & Key Levels
This week's S&P 500 outlook: key drivers, volatility context, risk-opportunity assessment and the week ahead.

Where Things Stand
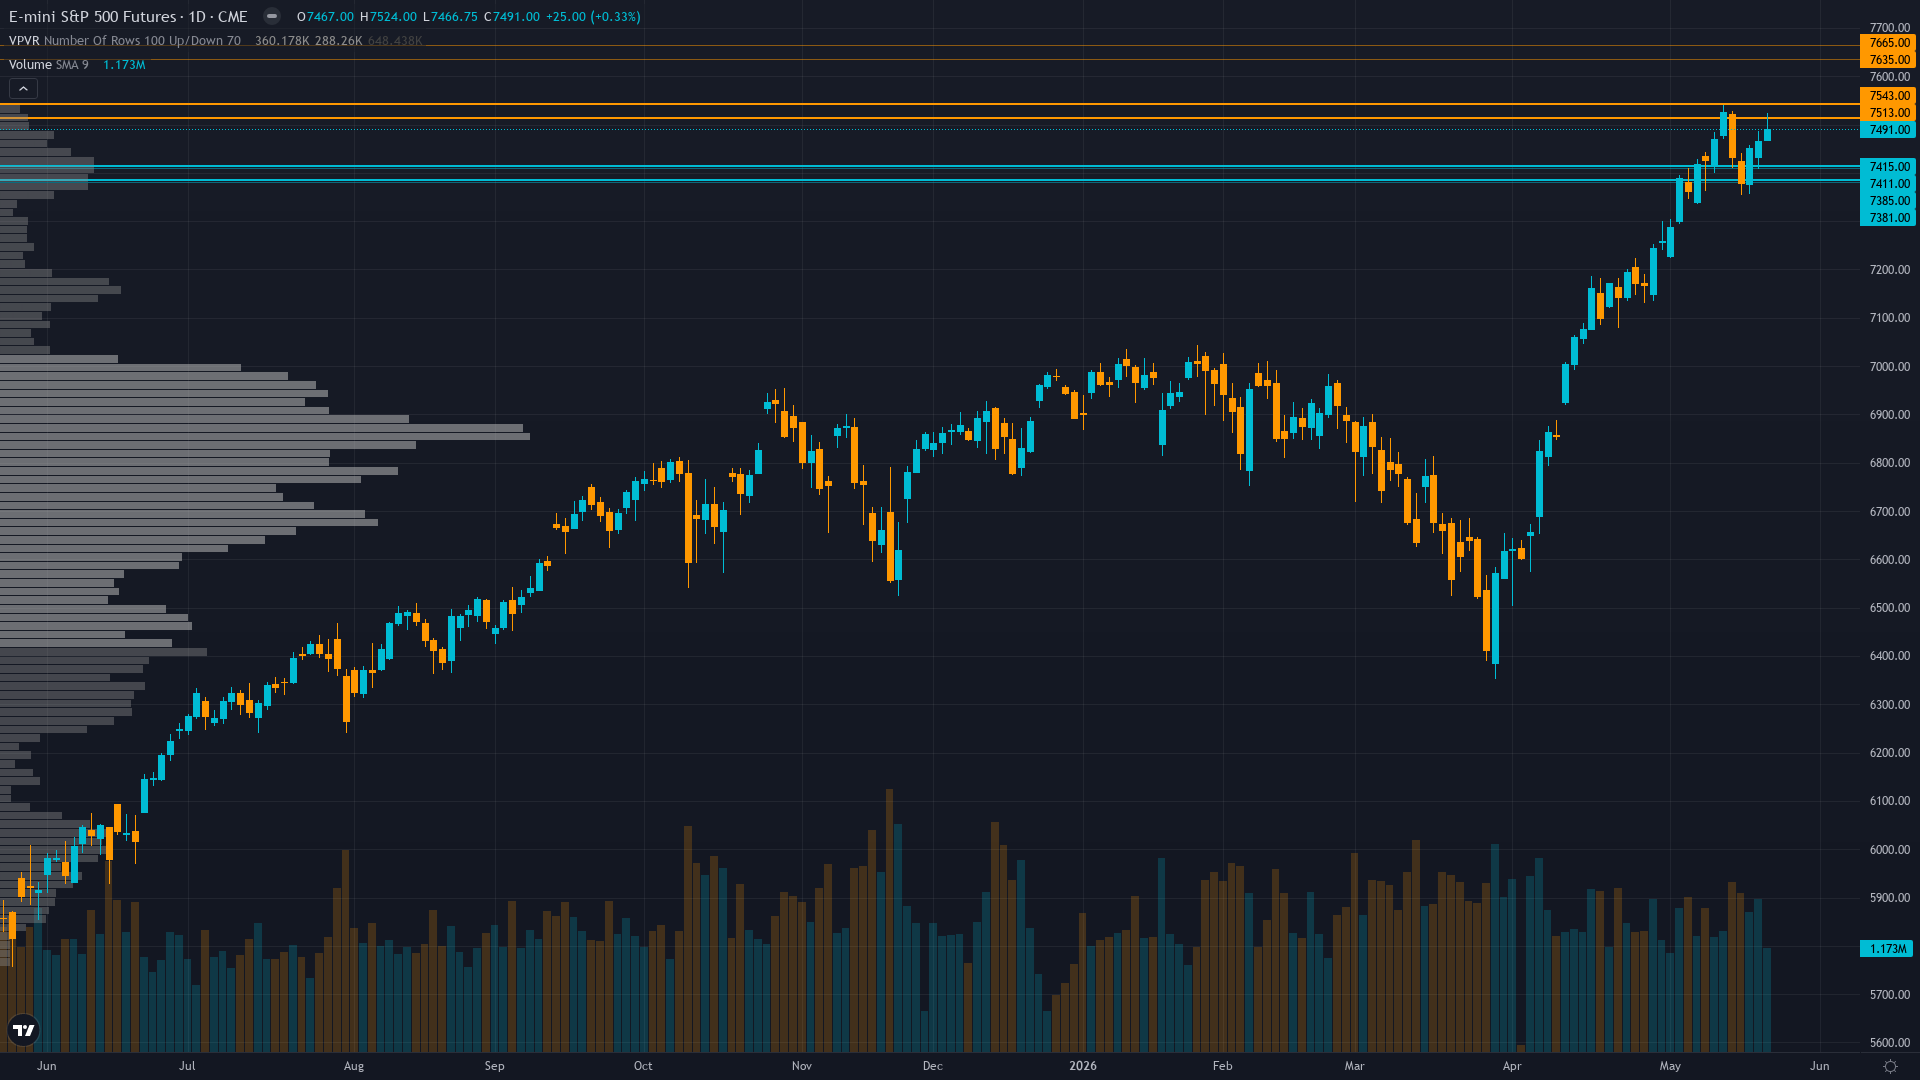
S&P 500 holds at 7491, up a marginal 0.33% as the market grinds forward. S&P 500 futures is consolidating, with price compressing into a narrower range as the market builds energy for its next move.
Cautiously bullish on Q1 earnings strength and technical momentum but increasingly aware extreme put/call 0.49 complacency and 7,500-7,524 resistance persistence create asymmetric downside risk into June 16-17 FOMC catalyst with new Chair uncertainty
What's Driving Price
Primary driver: ES consolidates at 7,491 near all-time highs after testing 7,524 intraday resistance, as four consecutive weeks of BULLISH calls delivered +4.13% cumulative gain validating Q1 earnings strength of 28.4% growth with record margins, yet Fed Chair Powell term expiration May 15 creates forward guidance vacuum entering June 16-17 FOMC binary catalyst
Secondary factor: VIX compressed to 16.70 from 17.3-17.4 range showing continued fear premium unwinding toward 52-week low of 13.38, but equity put/call ratio at 0.49 represents extremely bullish positioning with approximately 2.0 calls per put creating structural reversal vulnerability on any negative catalyst
Additional influence: Technical structure remains intact with ES +0.9% above 50-day MA 7,425.56 and +3.4% above 200-day MA 7,245.81 after successfully defending 50-day support on May 19-20 geopolitical shock test, but RSI 62.69 and proximity to 7,500-7,524 resistance cluster creates near-term consolidation bias
Economic backdrop: Fed at 3.50-3.75% after April 29 hold with Powell's term expired May 15, 2026 creating leadership vacuum until new Chair confirmed, June 16-17 FOMC prices 98% hold probability, HY spreads 278bps near tights, ISM Manufacturing 52.7 expansion confirms soft landing
Fundamental assessment: Forward PE 21.0-22.5x moderately elevated at 5-10% premium to 10-year average but justified by exceptional Q1 2026 earnings growth of 28.4% YoY (strongest since Q4 2021) with record net margins and full-year 2026 growth projected 21% - valuation premium warranted if execution continues
Chart Assessment
Uptrend confirmed with ES at 7,491 decisively above 50-day MA 7,425.56 (+0.9%) and 200-day MA 7,245.81 (+3.4%) with both positively sloped, RSI 62.69 neutral with room to extend, but resistance cluster at 7,500-7,524 psychological levels tested today requires breakout confirmation
With trend strength at 7/10, there's a clear directional tilt but room for the move to develop further.
Risk & Opportunity
Primary risk: June 16-17 FOMC delivers hawkish surprise from new Chair maintaining restrictive stance or removing accommodative bias language following Powell's May 15 term expiration, triggering equity repricing from forward PE 21-22.5x elevated levels as extreme put/call 0.49 complacency unwinds violently testing 7,425 then 7,245 support (Probability: medium)
Primary opportunity: Sustained breakout above 7,524 intraday high toward 7,650-7,750 psychological resistance zone if June 16-17 FOMC maintains accommodative bias despite Chair transition AND Q2 earnings season validates 21% growth trajectory enabling VIX compression below 16 with June-July seasonal strength materializing (Timeframe: May 27 - June 30 2026)
This week's edge: Market may be underestimating significance of Fed Chair Powell term expiration May 15 creating 23-day policy communication vacuum into June 16-17 first meeting under new Chair, while overestimating June FOMC dovish surprise probability given leadership transitions typically produce cautious initial rhetoric - extreme put/call 0.49 complacency at all-time highs with 13 failed 7,500+ breakout attempts creates structural vulnerability consensus dismisses
Volatility Backdrop
ES futures volatility at the 42th percentile reflects a balanced environment where standard risk parameters apply. Volatility remains anchored at current levels, with no clear signal of an imminent regime shift in either direction.
The Week Ahead
June 16-17 FOMC two-day meeting represents first meeting post-Chair Powell term expiration, markets price zero rate cut probability but scrutinizing new leadership's first policy statement and updated dot plot for any trajectory shifts amid Q1 earnings strength and labor stability on Tuesday 16 June is a high-impact catalyst with the potential to redefine the near-term outlook entirely.
How S&P 500 navigates the confluence of consolidating conditions and incoming data will determine whether the current directional thesis holds or breaks.
This analysis covers one dimension. Our full weekly report combines six specialist agents into a single actionable briefing with directional bias, key levels, and risk-opportunity matrix.
Start Free — Get the Market of the WeekFree weekly report · No credit card · Upgrade anytime


