S&P 500 Forecast This Week — Outlook, Drivers & Key Levels
This week's S&P 500 outlook: key drivers, volatility context, risk-opportunity assessment and the week ahead.

Current Market Picture
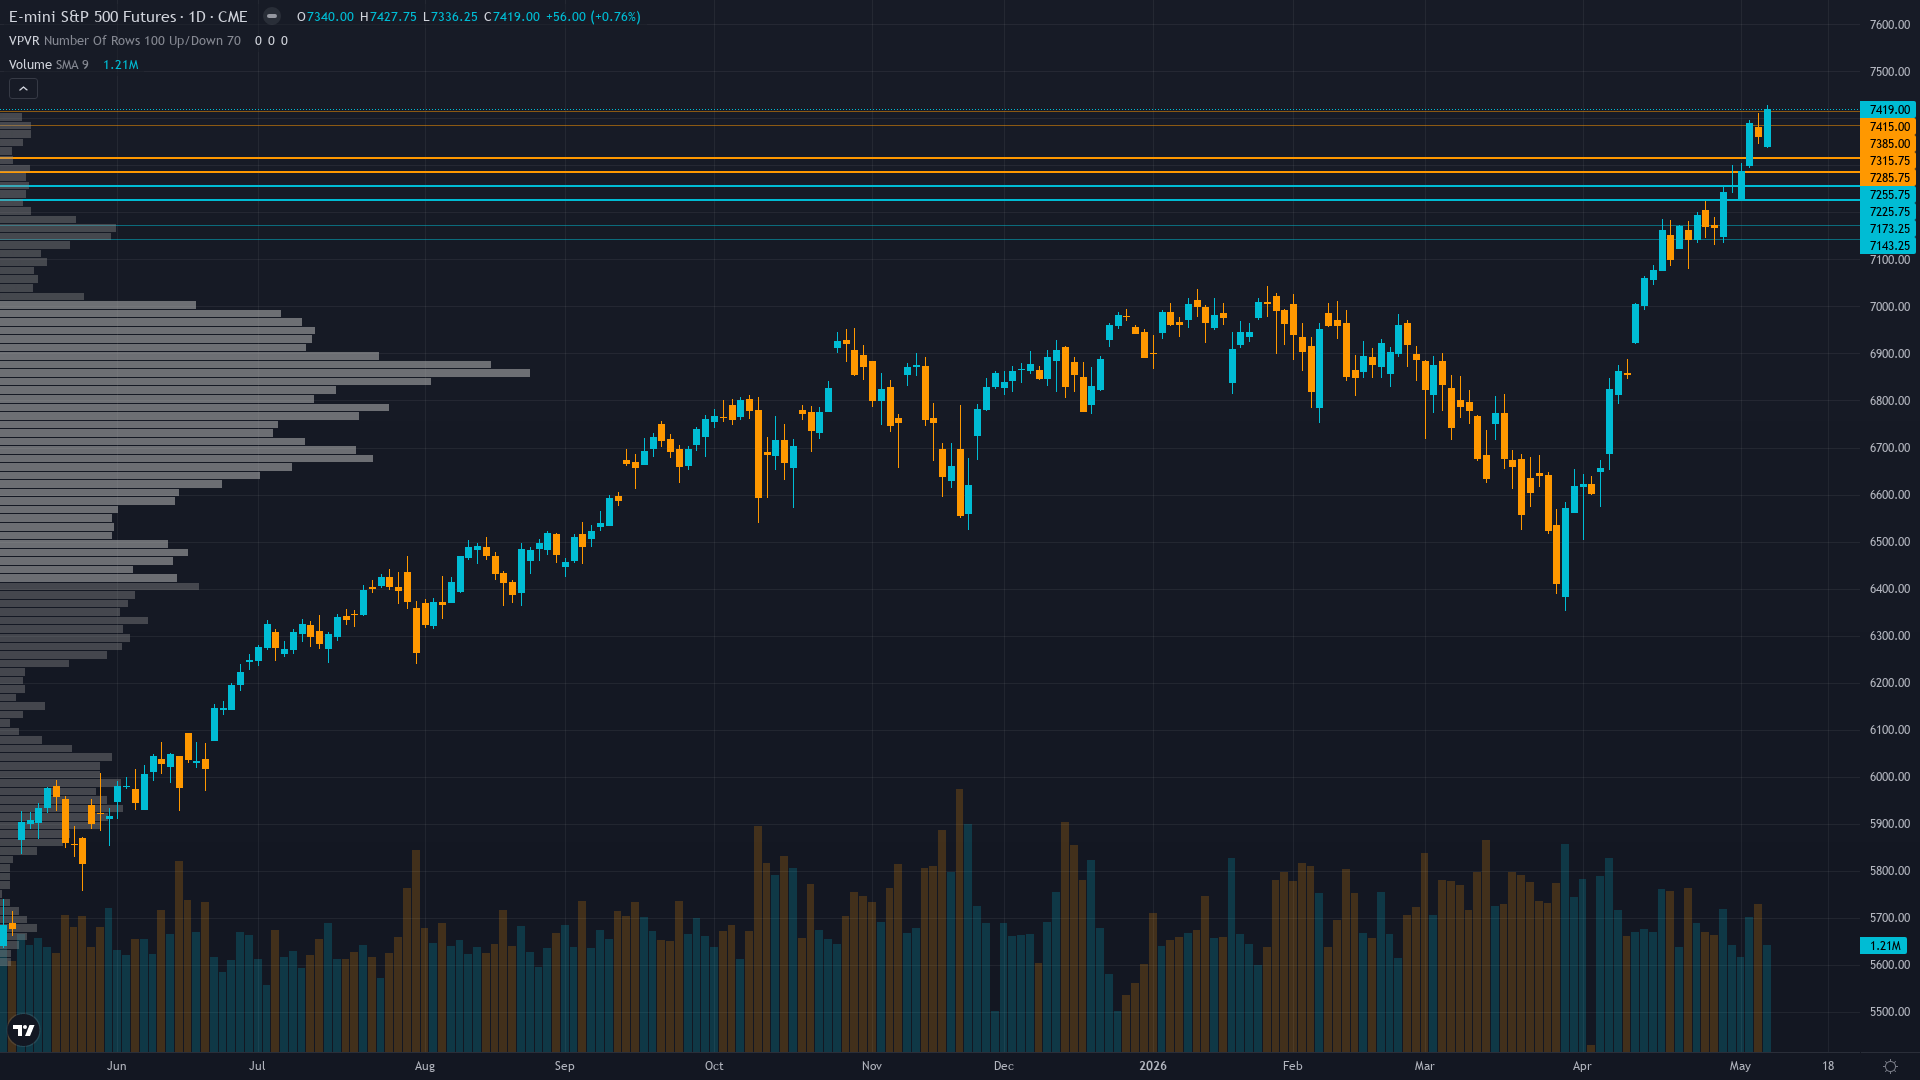
S&P 500 stands at 7419, having rallied 2.18% as bulls press their advantage. S&P 500 futures is in a trending up market state, requiring careful assessment of current conditions.
Cautiously bullish on Q1 earnings strength and NFP resilience but increasingly aware extreme RSI 77.65 overbought and put/call 0.53 complacency create asymmetric downside risk into May 12 CPI catalyst with 7,428-7,500 resistance zone formidable
Key Drivers This Week
Primary driver: ES surges to 7,419 (+161 points from May 3 close of 7,258) extending breakout above 7,300 as May 8 NFP beat at 115K vs 62K expected validates labor resilience while Q1 earnings season 63% complete delivers 21.3% growth (highest since Q4 2021) with record 13.4% net margins justifying forward PE 21.0x
Secondary factor: VIX compressed further to 17.19 from last week's 17.39 marking continued fear premium unwinding but equity put/call ratio at extreme 0.53 complacency (1.89 calls per put) creates asymmetric reversal vulnerability despite S&P 500 posting 6th consecutive weekly gain and fresh all-time highs
Additional influence: Technical momentum extreme with RSI 77.65 severely overbought after testing intraday high 7,427.75 on May 9, creating two-bar buy climax pattern near psychological 7,500 resistance while price extends 2.9% above 50-day MA at 7,212.89 signaling exhaustion risk
Economic backdrop: Fed at 3.50-3.75% after April 29 hold with no FOMC until June, May 8 NFP beat at 115K vs 62K validates labor resilience but April CPI release May 12 (in 2 days) critical for confirming inflation trajectory - ISM Manufacturing 52.7 expansion supports soft landing narrative
Fundamental assessment: Forward PE 21.0x at modest 5.5% premium to 5-year average justified by exceptional Q1 earnings acceleration to 21.3% growth with 84% beat rate and record 13.4% net margins - full-year 2026 growth revised from 15.6% to 21-22.6% validates stretched multiples if execution continues
Price Structure
Powerful uptrend with ES at 7,419 decisively above 50-day MA 7,213 (+2.9%) and 200-day MA 6,926 (+7.1%), but RSI 77.65 severely overbought after May 6-7 breakout above 7,245-7,266 resistance created extension toward 7,500 psychological level with intraday range 7,336-7,428 showing 1.2% volatility
With trend strength at 8/10, the prevailing move carries significant force behind it.
Upside & Downside
Primary risk: RSI 77.65 extreme overbought combined with equity put/call 0.53 dangerous complacency creates violent mean-reversion risk if May 12 April CPI surprises hot (above 0.3% monthly) validating Fed's cautious stance and triggering profit-taking from 7,419 all-time high zone testing 7,335 then 7,200 support as VIX re-expands above 20 (Probability: medium)
Primary opportunity: Sustained breakout above 7,428 intraday high toward 7,500-7,550 psychological resistance if May 12 CPI benign and remaining Q1 earnings season (37% yet to report) validates 21.3% growth trajectory enabling VIX compression below 17 with May-June seasonal strength materializing (Timeframe: May 12-20 2026)
This week's edge: Market underestimating significance of RSI 77.65 extreme overbought combined with equity put/call 0.53 complacency creating 3-7 day mean-reversion window while overestimating CPI benign surprise probability given NFP beat suggests continued economic strength that validates Fed's cautious higher-for-longer stance - extreme positioning at all-time highs creates structural vulnerability consensus dismisses
Volatility Context
At the 45th percentile, ES futures volatility sits in a normal range, neither compressed enough to signal a breakout nor elevated enough to demand caution. Realised vol is holding its current level, suggesting the market has found a temporary equilibrium in its risk pricing.
Normal volatility regime suggests 1.0-1.5% daily ES moves expected with current 7,335-7,428 intraday range representing 1.2% width - May 12 CPI binary outcome presents asymmetric expansion risk with potential 2-3% intraday swings on inflation surprise either direction
Week Ahead Outlook
The next major catalyst is April CPI release May 12 at 8:30 AM ET critical for validating inflation trajectory and Fed policy expectations - market watching for confirmation of reacceleration that would cement higher-for-longer rates after NFP beat suggested continued economic strength on Tuesday 12 May — a high-impact event that could materially shift the directional picture.
For S&P index, the balance between existing momentum and scheduled risk events sets the stage for the week ahead.
This analysis covers one dimension. Our full weekly report combines six specialist agents into a single actionable briefing with directional bias, key levels, and risk-opportunity matrix.
Start Free — Get the Market of the WeekFree weekly report · No credit card · Upgrade anytime


