S&P 500 Forecast This Week — Outlook, Drivers & Key Levels
This week's S&P 500 outlook: key drivers, volatility context, risk-opportunity assessment and the week ahead.

This Week's Starting Point
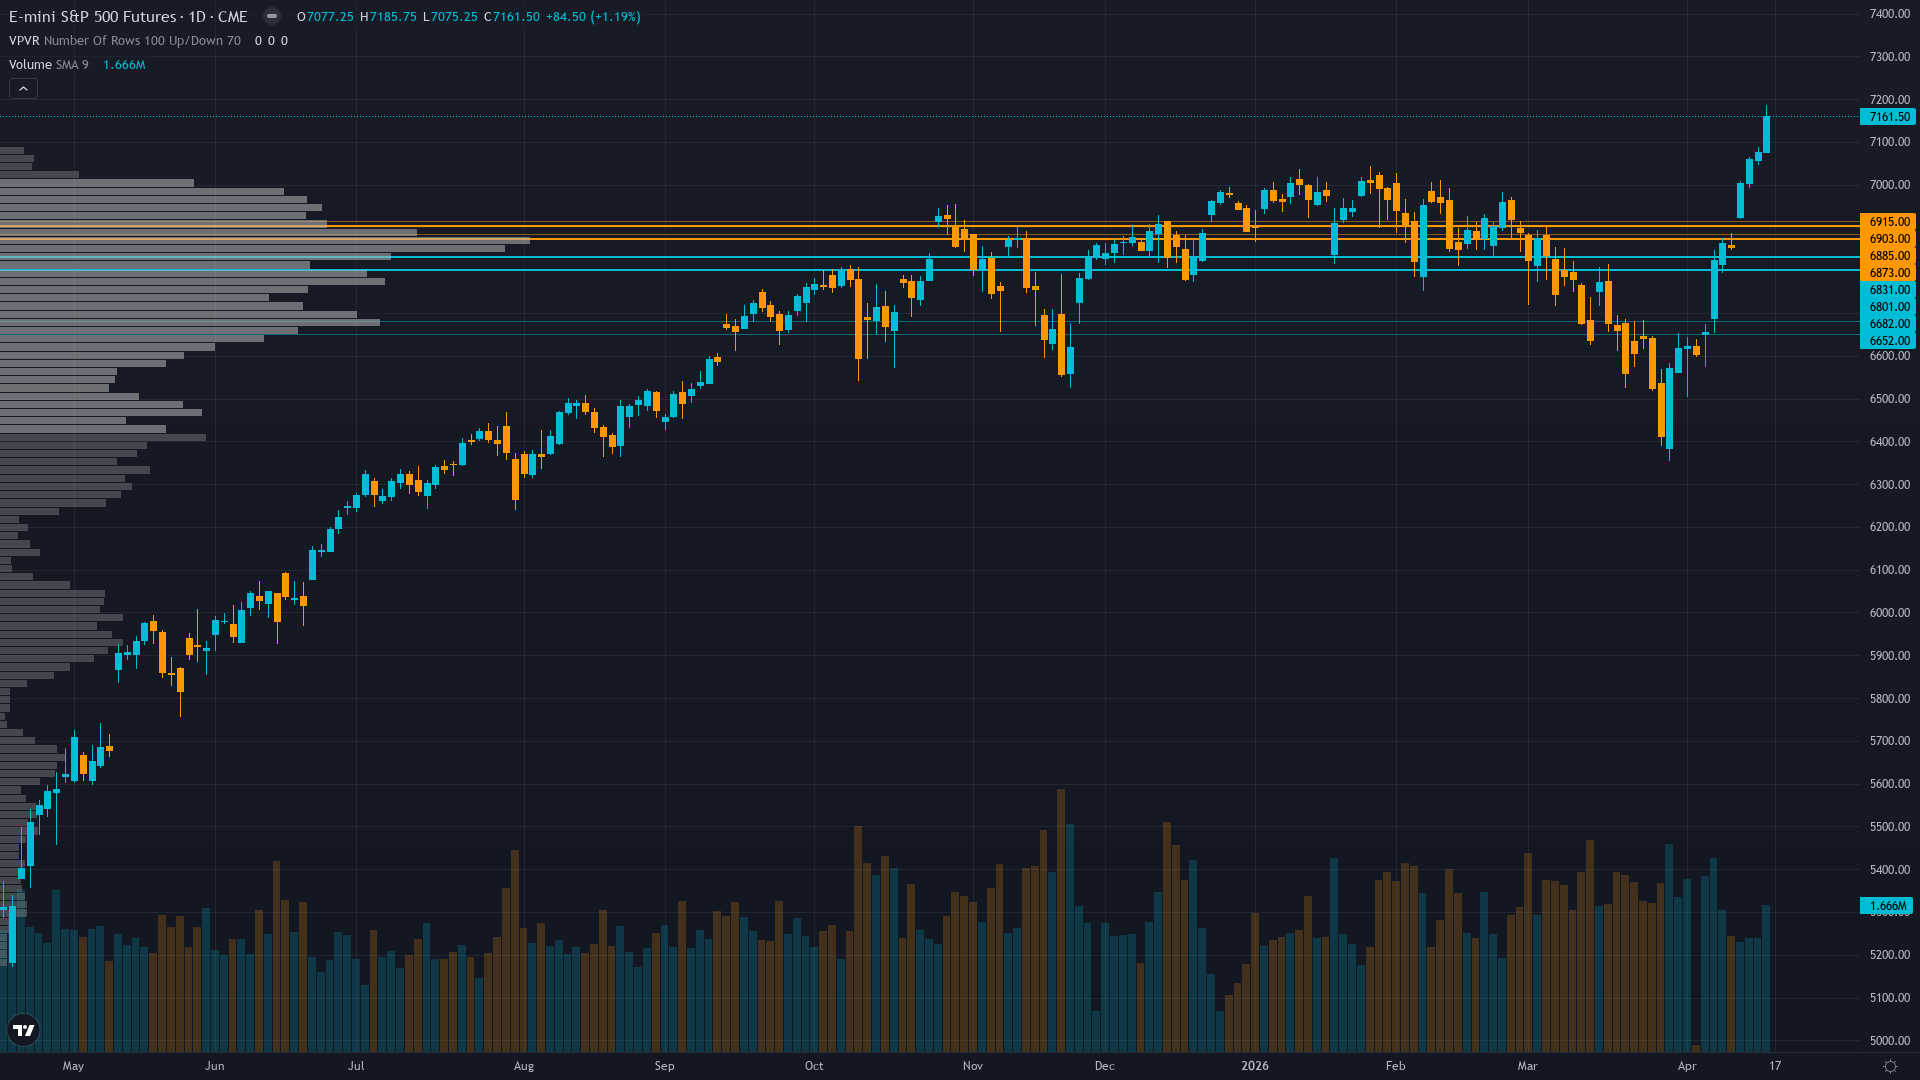
Trading at 7159 with a 0.18% uptick, S&P 500 is drifting higher without strong conviction. Price action in S&P 500 futures has compressed into a consolidation pattern, typically a precursor to a directional breakout.
Cautiously bullish on earnings season execution and seasonal strength but increasingly aware extreme overbought RSI 78.56 and complacent put/call 0.41 positioning create asymmetric mean-reversion risk near 7,200 psychological resistance
Forces in Play
Primary driver: RSI 78.56 severely overbought creating extreme momentum divergence at all-time highs near 7,200 psychological resistance as S&P 500 surged 4.52% last week continuing March extreme fear capitulation rally but now entering technical exhaustion zone
Secondary factor: VIX compression to 17.94 down 39% YoY with equity put/call 0.41 extremely low showing dangerous complacency developing despite proximity to record highs - Options market signals extreme bullish positioning vulnerable to mean-reversion shock
Additional influence: Q1 2026 earnings season underway with 10% of S&P 500 reported showing 13.2% growth expectations but forward PE 19.4-20.7x at fair value creates limited margin for error as profit margins at record 13.2-14.2% levels face compression risk
Economic backdrop: Fed at 3.50-3.75% with April 29 FOMC pricing 99% hold probability per CME FedWatch - no catalyst this week as ISM data 18 days stale and next major event is FOMC 10 days out creating structural policy support but no fresh dovish catalyst
Fundamental assessment: Forward PE 19.4-20.7x near fair value down from October 30+ extreme with Q1 earnings season 10% complete showing 13.2% growth rate but record 13.9% profit margins at 15-year highs create structural compression vulnerability if execution disappoints
Technical Landscape
Severely overbought RSI 78.56 at all-time highs 7,159 well above 50-day MA 6,937 and 200-day MA 6,693 creating extreme positive momentum divergence historically preceding pullbacks despite intact uptrend structure
Trend strength registers at 7/10, suggesting meaningful but not extreme directional bias.
Risk-Reward Assessment
Primary risk: RSI 78.56 extreme overbought at all-time highs with equity put/call 0.41 complacency creates violent mean-reversion risk if any Q1 earnings disappointments or April 29 FOMC hawkish surprise triggers systematic deleveraging testing 7,053 then 6,937 support (Probability: medium)
Primary opportunity: Technical pullback to 7,053-6,937 support zone providing entry for continuation toward 7,200-7,300 if Q1 earnings season validates 13.2% growth expectations and VIX continues compression below 17 supporting seasonal strength (Timeframe: April 21-30 2026)
This week's edge: Market underestimating magnitude of technical overbought divergence at RSI 78.56 creating 3-7 day mean-reversion window toward 7,053-6,937 support while overestimating sustainability of extreme options complacency at put/call 0.41 that historically precedes violent reversals on any negative catalyst
Risk Environment
With vol at the 42th percentile over 90 days, ES futures is in a measured regime that doesn't require unusual adjustments. Volatility is stable, with realised vol holding steady across timeframes. This equilibrium can persist but eventually resolves into expansion or contraction.
Normal volatility regime suggests 1.0-1.5% daily ES moves expected with current 7,053-7,200 range representing 2.1% width - earnings season binary outcomes and April 29 FOMC present asymmetric expansion risk with potential 2-3% intraday swings on major surprises
Looking Forward
All eyes turn to FOMC two-day meeting April 28-29 with zero rate cut probability priced but markets scrutinizing Powell rhetoric for any policy trajectory shift amid Q1 2026 earnings season peak reporting creating binary outcomes on Wednesday 29 April, which carries enough weight to force a decisive directional move.
The week ahead for S&P 500 futures hinges on whether the prevailing consolidating regime can absorb the scheduled catalysts without a regime shift.
This analysis covers one dimension. Our full weekly report combines six specialist agents into a single actionable briefing with directional bias, key levels, and risk-opportunity matrix.
Start Free — Get the Market of the WeekFree weekly report · No credit card · Upgrade anytime


