S&P 500 Forecast This Week — Outlook, Drivers & Key Levels
This week's S&P 500 outlook: key drivers, volatility context, risk-opportunity assessment and the week ahead.

Where Things Stand
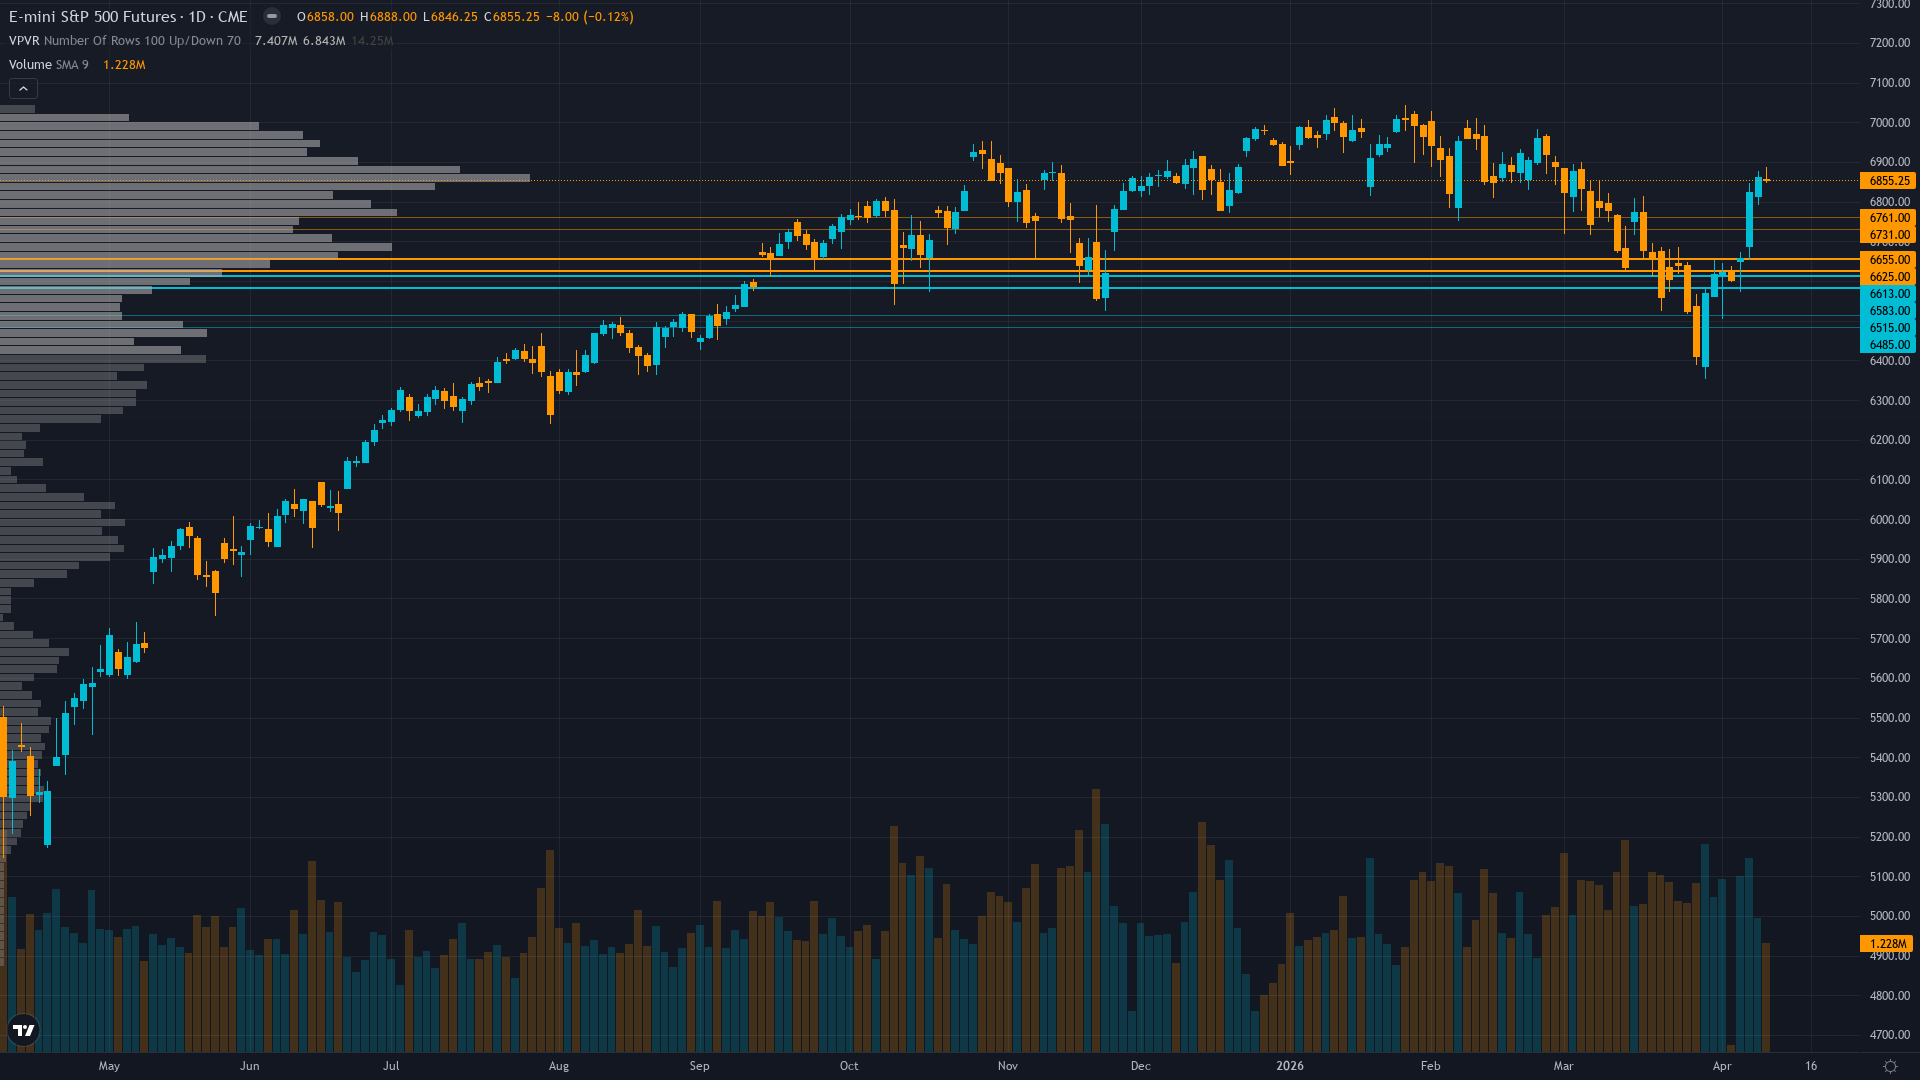
At 6855.25, S&P 500 has eased 0.12% in a controlled retreat. S&P 500 futures is consolidating, with price compressing into a narrower range as the market builds energy for its next move.
Cautiously bullish on relief rally extension toward 6900-7000 but aware earnings season execution risk and elevated valuations create asymmetric downside if growth disappoints - positioning shows complacency developing with put/call 0.51 extremely low
What's Driving Price
Primary driver: Violent relief rally from March extreme fear washout - S&P 500 surged 3.82% week-over-week (6603 to 6856) on Iran ceasefire catalyst as VIX compressed from 31.05 peak to 19.23 current, marking best weekly gain since November 2025 on sentiment mean reversion
Secondary factor: Q1 2026 earnings season beginning mid-April with 12.6-14.4% growth expectations and upward revisions supporting forward PE 20.4-21.2 valuations at modestly elevated 72nd percentile but justified by record 13.9% net profit margins if execution delivers
Additional influence: Technical recovery reclaiming 6850+ zone but facing resistance at 6888-6900 overhead while remaining above critical 200-day MA at 6664, creating consolidation pattern testing sustainability of relief rally versus distribution risk
Economic backdrop: Fed at 3.50-3.75% after March 18 hawkish hold with April 28-29 FOMC pricing 94.8% hold probability - April 10 CPI surprise to 3.3% YoY (highest of Trump second term) validates inflation stickiness reducing near-term cut probability
Fundamental assessment: Forward PE 20.4-21.2 at 72nd percentile moderately elevated but Q1 2026 earnings season starting this week with 12.6-14.4% growth estimates and upward revisions - execution risk is binary catalyst for valuation justification
Chart Assessment
Recovering from March breakdown - ES now above 200-day MA 6664 after reclaiming 6850 but RSI 69.37 approaching overbought suggesting momentum exhaustion near 6888-6900 resistance zone
With trend strength at 7/10, there's a clear directional tilt but room for the move to develop further.
Risk & Opportunity
Primary risk: Relief rally reversal if earnings season disappoints 12-14% growth expectations or forward guidance weakens materially, which would render current 20-21x forward PE unjustified triggering multiple compression testing 6667-6600 support zone (Probability: medium)
Primary opportunity: Sustained recovery toward 6900-7000 resistance reclaiming psychological levels if VIX continues compression toward 18 and Q1 earnings season delivers on 13-14% growth expectations validating March extreme fear as capitulation low (Timeframe: April 12-30 2026)
This week's edge: Market may be underestimating persistence of extreme fear positioning creating sustained short-covering pressure toward 6900 resistance while overestimating earnings season execution certainty given forward PE 20-21x at 72nd percentile leaves minimal margin for disappointment on 13-14% growth expectations
Volatility Backdrop
ES futures volatility at the 48th percentile reflects a balanced environment where standard risk parameters apply. Volatility contraction continues, building the stored energy that typically precedes the next significant directional move.
Normal volatility regime suggests 1.0-1.5% daily ES moves expected with current 6850-6900 consolidation representing 0.7% range - earnings season binary outcomes present asymmetric expansion risk with potential 2-3% intraday swings on major misses or guidance cuts
The Week Ahead
FOMC two-day meeting April 28-29 with zero rate cut priced but markets scrutinizing Powell rhetoric after April 10 CPI 3.3% upside surprise validated sticky inflation concerns amid Iran conflict oil price effects on Tuesday 28 April is a high-impact catalyst with the potential to redefine the near-term outlook entirely.
How S&P 500 navigates the confluence of consolidating conditions and incoming data will determine whether the current directional thesis holds or breaks.
This analysis covers one dimension. Our full weekly report combines six specialist agents into a single actionable briefing with directional bias, key levels, and risk-opportunity matrix.
Start Free — Get the Market of the WeekFree weekly report · No credit card · Upgrade anytime


