S&P 500 Forecast This Week — Outlook, Drivers & Key Levels
This week's S&P 500 outlook: key drivers, volatility context, risk-opportunity assessment and the week ahead.

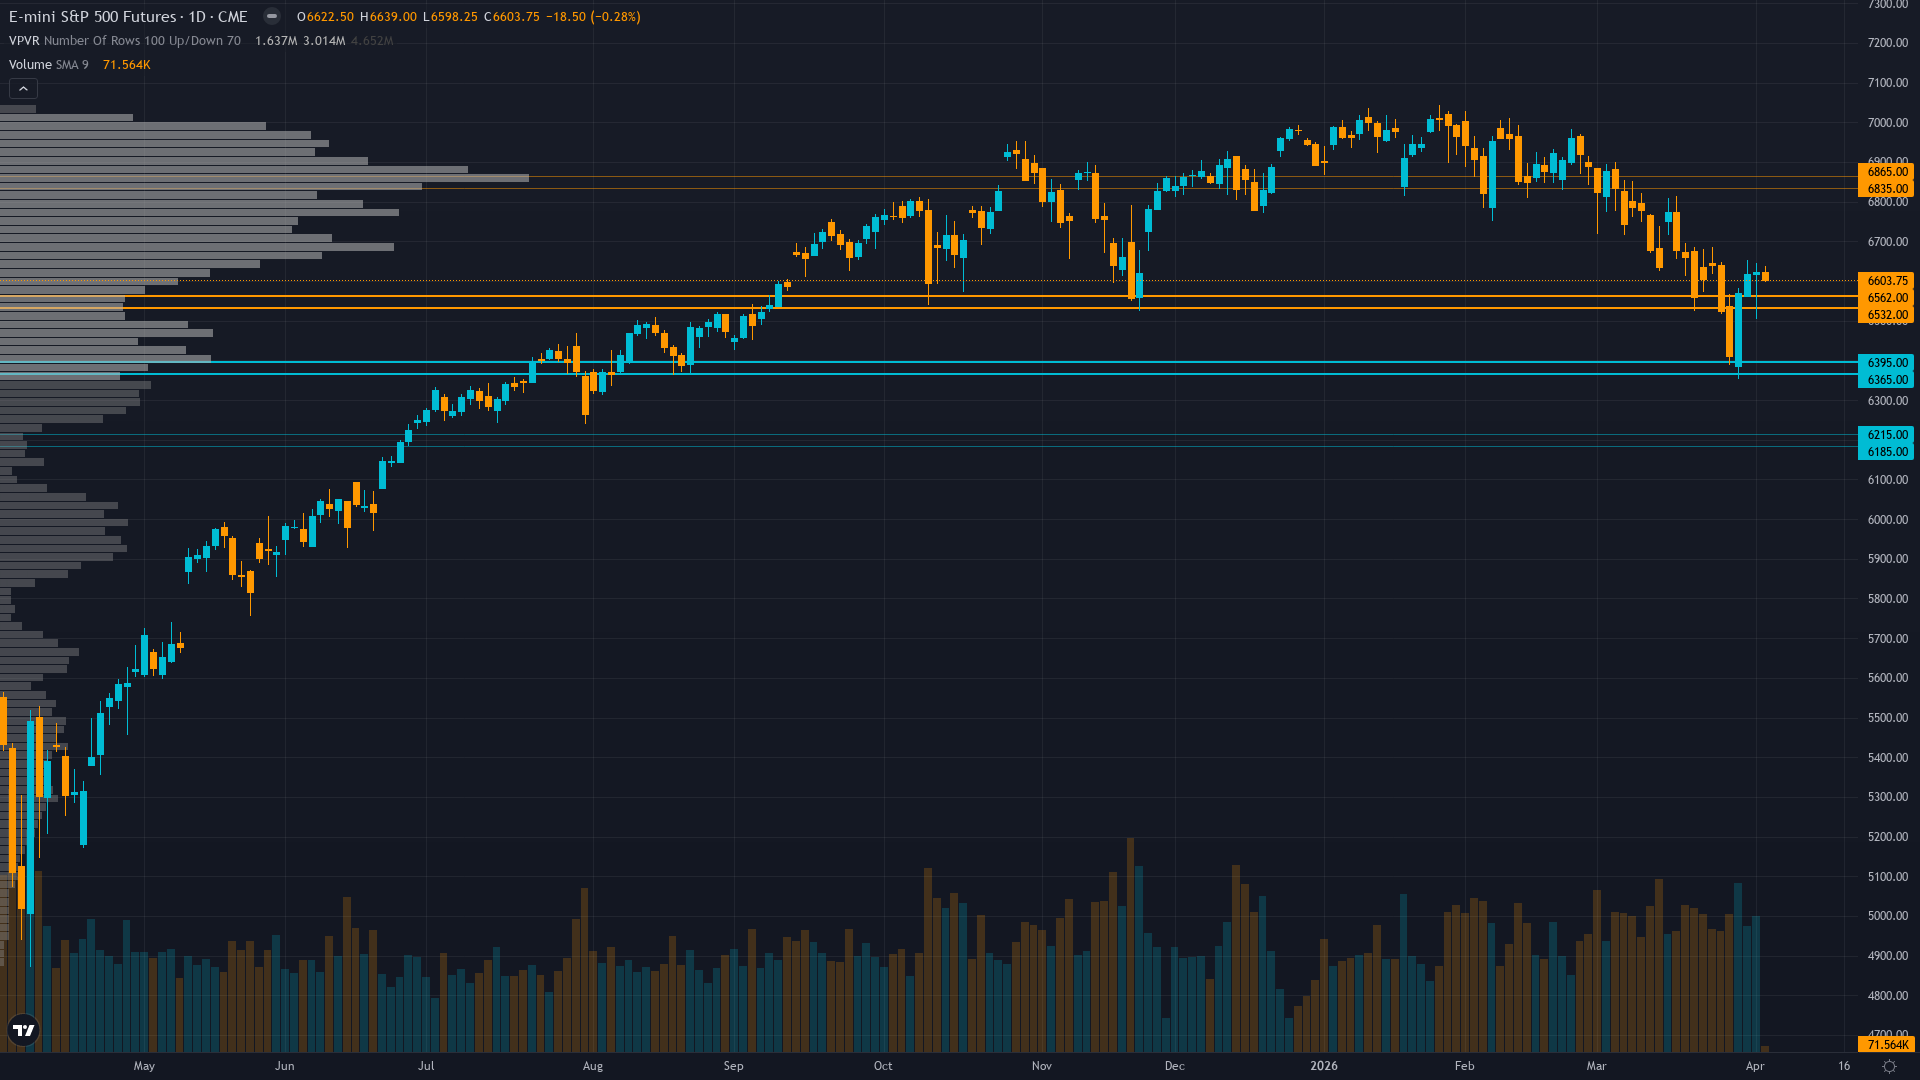
Where Things Stand
S&P 500 holds at 6603.75, off 0.25% in a modest retracement from recent levels. S&P 500 futures is consolidating, with price compressing into a narrower range as the market builds energy for its next move.
Divided between relief rally continuation toward 6746-6850 and consolidation/reversal risk given unrepaired technical breakdown and elevated valuations awaiting earnings validation
What's Driving Price
Primary driver: Violent sentiment mean-reversion rally from March extreme fear levels - S&P 500 snapped 5-week losing streak with 3.4% weekly gain as VIX compressed from 31.05 to 23.87 and Iran conflict fears subsided
Secondary factor: Technical recovery from March 6412 lows (+191.75 points, +2.99% intraweek) but ES still below 200-day MA at 6640, creating consolidation range at 6600-6640 resistance zone as market digests relief rally sustainability
Additional influence: Q1 2026 earnings season begins mid-April with 12% growth expectations and fresh upward revisions supporting forward PE 21-24x valuations, while Fed remains on hold at 3.50-3.75% through April 29 FOMC with zero cut probability
Economic backdrop: Fed held 3.50-3.75% with 94.8% probability of April 29 hold, Atlanta Fed GDPNow Q1 at 1.6%, ISM Manufacturing 52.7 expansion, March NFP +178K stable labor - soft landing intact but no dovish catalyst
Fundamental assessment: Forward PE 21-24x moderately elevated but Q1 earnings estimates revised higher to 13.0% growth with record 13.9% net margins - execution risk in 2-3 weeks as earnings season validates valuations
Chart Assessment
Recovering from breakdown but still below 200-day MA 6640 creating overhead resistance - RSI 57.9 neutral after deeply oversold 22.08 reading last week suggesting momentum stabilizing
With trend strength at 5/10, the directional signal is present but far from decisive.
Risk & Opportunity
Primary risk: Relief rally reversal if March CPI surprises hot validating oil-driven inflation fears and forcing markets to reprice zero 2026 cuts assumption, triggering re-test of 6500-6400 support on renewed stagflation narrative (Probability: medium)
Primary opportunity: Sustained recovery toward 6746-6850 resistance reclaiming 200-day MA if VIX continues compression toward 20 and Q1 earnings season delivers on 13% growth expectations validating extreme March fear as washout low (Timeframe: April 7-18 2026)
This week's edge: Market may be underestimating persistence of March extreme fear positioning creating sustained short-covering pressure toward 6746 resistance while overestimating consolidation sustainability given critical March CPI catalyst April 11 presents binary stagflation re-pricing risk
Volatility Backdrop
ES futures volatility at the 68th percentile reflects a balanced environment where standard risk parameters apply. Volatility contraction continues, building the stored energy that typically precedes the next significant directional move.
High-to-normal transitioning volatility suggests 1.0-1.5% daily ES moves expected with current 6600-6640 consolidation representing 0.6% range - March 11 CPI catalyst presents asymmetric expansion risk with potential 2-3% intraday swings on inflation surprise
The Week Ahead
March CPI inflation release critical for validating Fed policy trajectory and stagflation concerns amid recent oil price volatility from Iran conflict that drove crude above $90 on Saturday 11 April is a high-impact catalyst with the potential to redefine the near-term outlook entirely.
How S&P 500 navigates the confluence of consolidating conditions and incoming data will determine whether the current directional thesis holds or breaks.
This analysis covers one dimension. Our full weekly report combines six specialist agents into a single actionable briefing with directional bias, key levels, and risk-opportunity matrix.
Start Free — Get the Market of the WeekFree weekly report · No credit card · Upgrade anytime


