S&P 500 Forecast This Week — Outlook, Drivers & Key Levels
This week's S&P 500 outlook: key drivers, volatility context, risk-opportunity assessment and the week ahead.

Where Things Stand
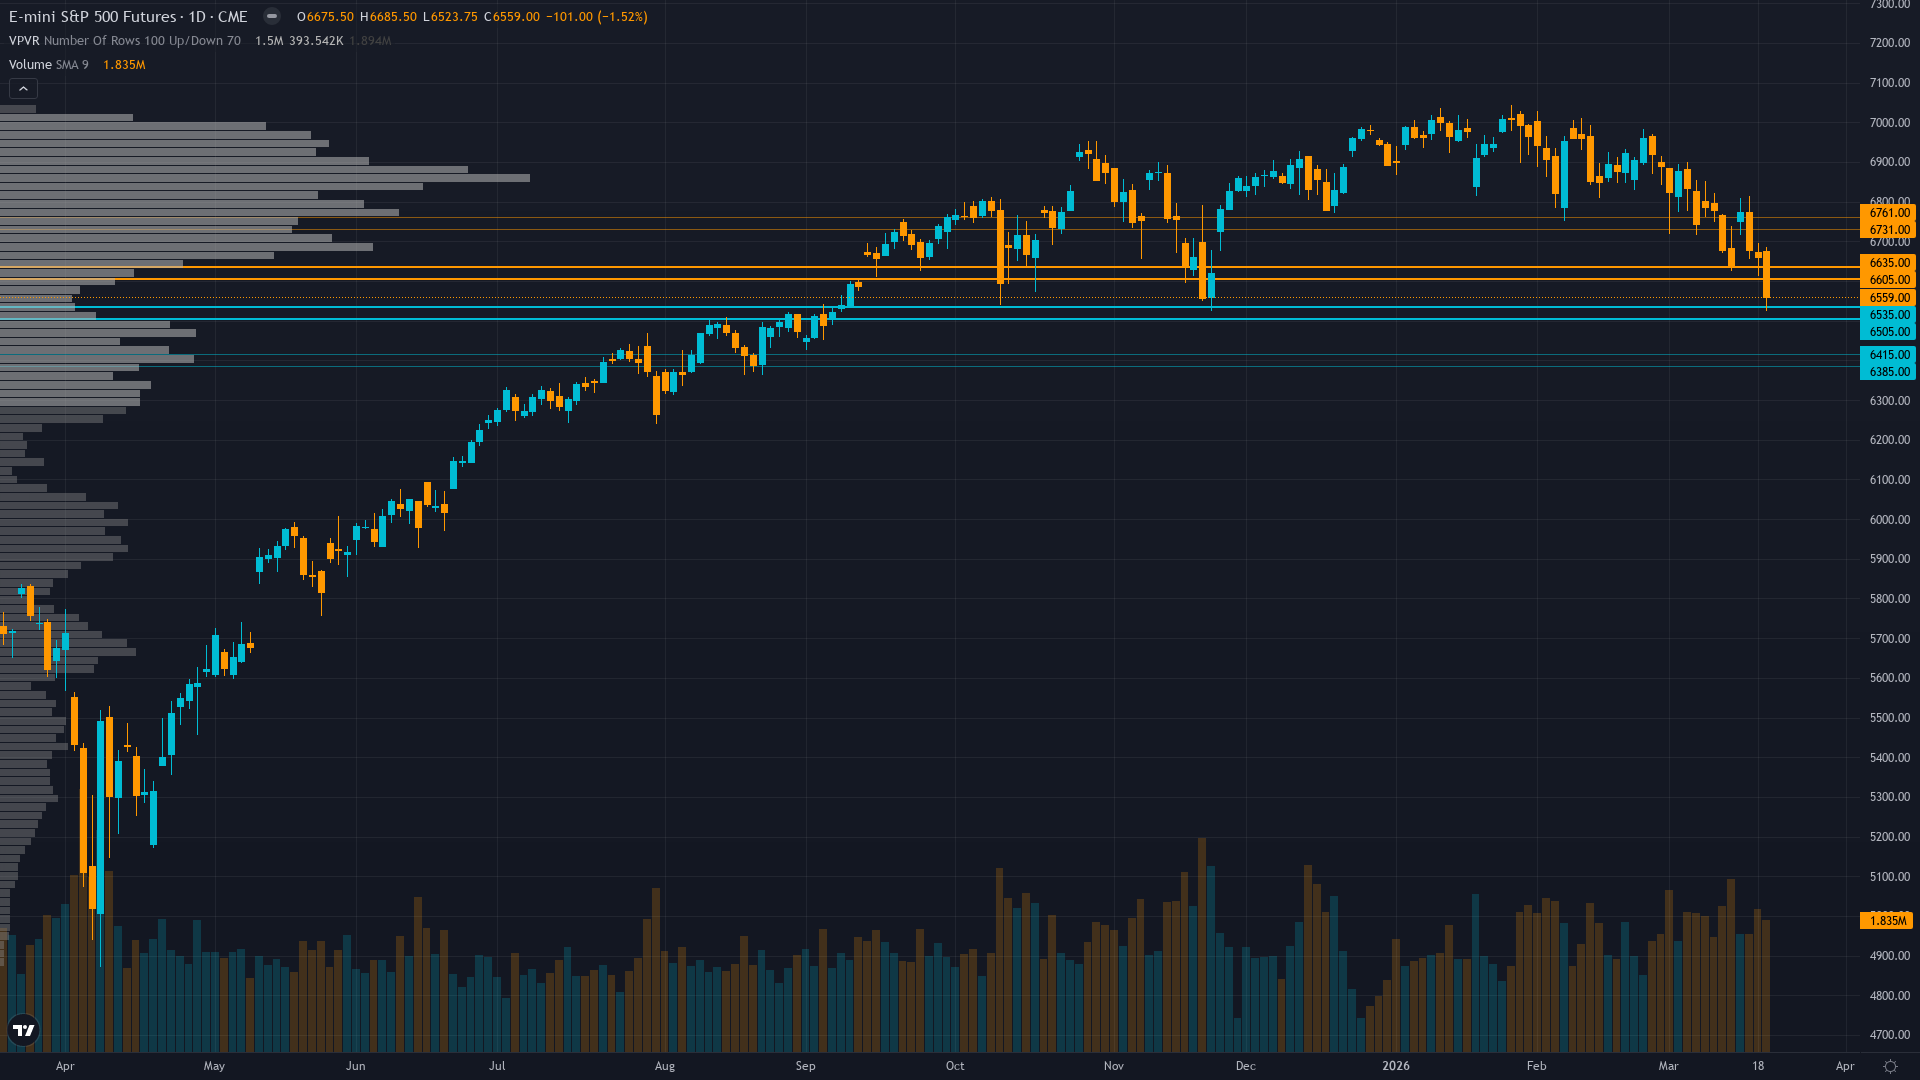
S&P 500 sits at 6559, having shed 1.17% as bears maintain the upper hand. S&P 500 futures is in a breaking down market state, requiring careful assessment of current conditions.
Divided between extreme fear capitulation suggesting oversold bounce and technical breakdown continuation with majority positioning defensively into quarter-end despite contrarian sentiment signals
What's Driving Price
Primary driver: Extreme fear sentiment capitulation with VIX 26.78 and Fear & Greed 15 creating contrarian reversal setup conflicting with intact technical breakdown below 6585 support and geopolitical tail risk from ongoing Iran conflict
Secondary factor: March 18 FOMC delivered hawkish hold at 3.50-3.75% maintaining restrictive stance despite equity stress creating policy paralysis as Fed acknowledges geopolitical uncertainty but refuses accommodation
Additional influence: March 20 quadruple witching expiration plus quarter-end rebalancing (9 days away) creating forced flows and window-dressing pressure amid declining open interest signaling deleveraging acceleration
Economic backdrop: Fed held 3.50-3.75% March 18 in hawkish hold acknowledging geopolitical risks but maintaining restrictive policy creating stagflation concerns as Iran conflict drives oil inflation while growth slows
Fundamental assessment: Forward PE 20.3 moderately overvalued versus 18.8 average but down from extremes, Q1 earnings 12.5% growth expectations face execution risk in 4 weeks as margin compression threatens stretched multiples
Chart Assessment
Confirmed breakdown - ES at 6559 decisively below 50-day MA 6656 and 200-day MA 6806 with RSI 23.34 oversold creating dual signals of continuation risk versus reversal potential
With trend strength at only 2/10, any directional bias is thin and easily disrupted.
Risk & Opportunity
Primary risk: VIX panic expansion toward 30-35 if 6520 support fails triggering volatility-targeting systematic liquidation cascade testing 6400 major support as geopolitical tail risk from Iran conflict escalation materializes (Probability: medium)
Primary opportunity: Extreme fear contrarian reversal rally reclaiming 6620-6746 resistance if VIX mean-reverts from 26.78 elevated reading and March 31 quarter-end flows create technical squeeze of oversold shorts (Timeframe: March 24-31 2026)
This week's edge: Market underestimating speed of VIX mean reversion from 26.78 when sentiment extremes converge (Fear & Greed 15, AAII -21.6% spread) historically preceding 3-7 day reversal windows, while overestimating technical breakdown severity given extreme sentiment positioning creates asymmetric reversal potential versus systematic liquidation risk
Volatility Backdrop
ES futures volatility at the 68th percentile reflects a balanced environment where standard risk parameters apply. Volatility expansion is underway, suggesting the market is moving into a phase of heightened activity and wider ranges.
High volatility regime suggests 1.5-2.5% daily ES moves expected with current 6520-6620 range representing 1.5% width - breakdown below 6520 presents asymmetric expansion risk with potential 3-4% intraday swings on cascade selling while hold creates compression opportunity
The Week Ahead
Quarter-end rebalancing flows and window-dressing pressure with March 31 marking Q1 close creating mechanical selling from performance protection and tracking error reduction on Tuesday 31 March is a high-impact catalyst with the potential to redefine the near-term outlook entirely.
How S&P 500 navigates the confluence of breaking down conditions and incoming data will determine whether the current directional thesis holds or breaks.
This analysis covers one dimension. Our full weekly report combines six specialist agents into a single actionable briefing with directional bias, key levels, and risk-opportunity matrix.
Start Free — Get the Market of the WeekFree weekly report · No credit card · Upgrade anytime


