S&P 500 Forecast This Week — Outlook, Drivers & Key Levels
This week's S&P 500 outlook: key drivers, volatility context, risk-opportunity assessment and the week ahead.
This Week's Starting Point
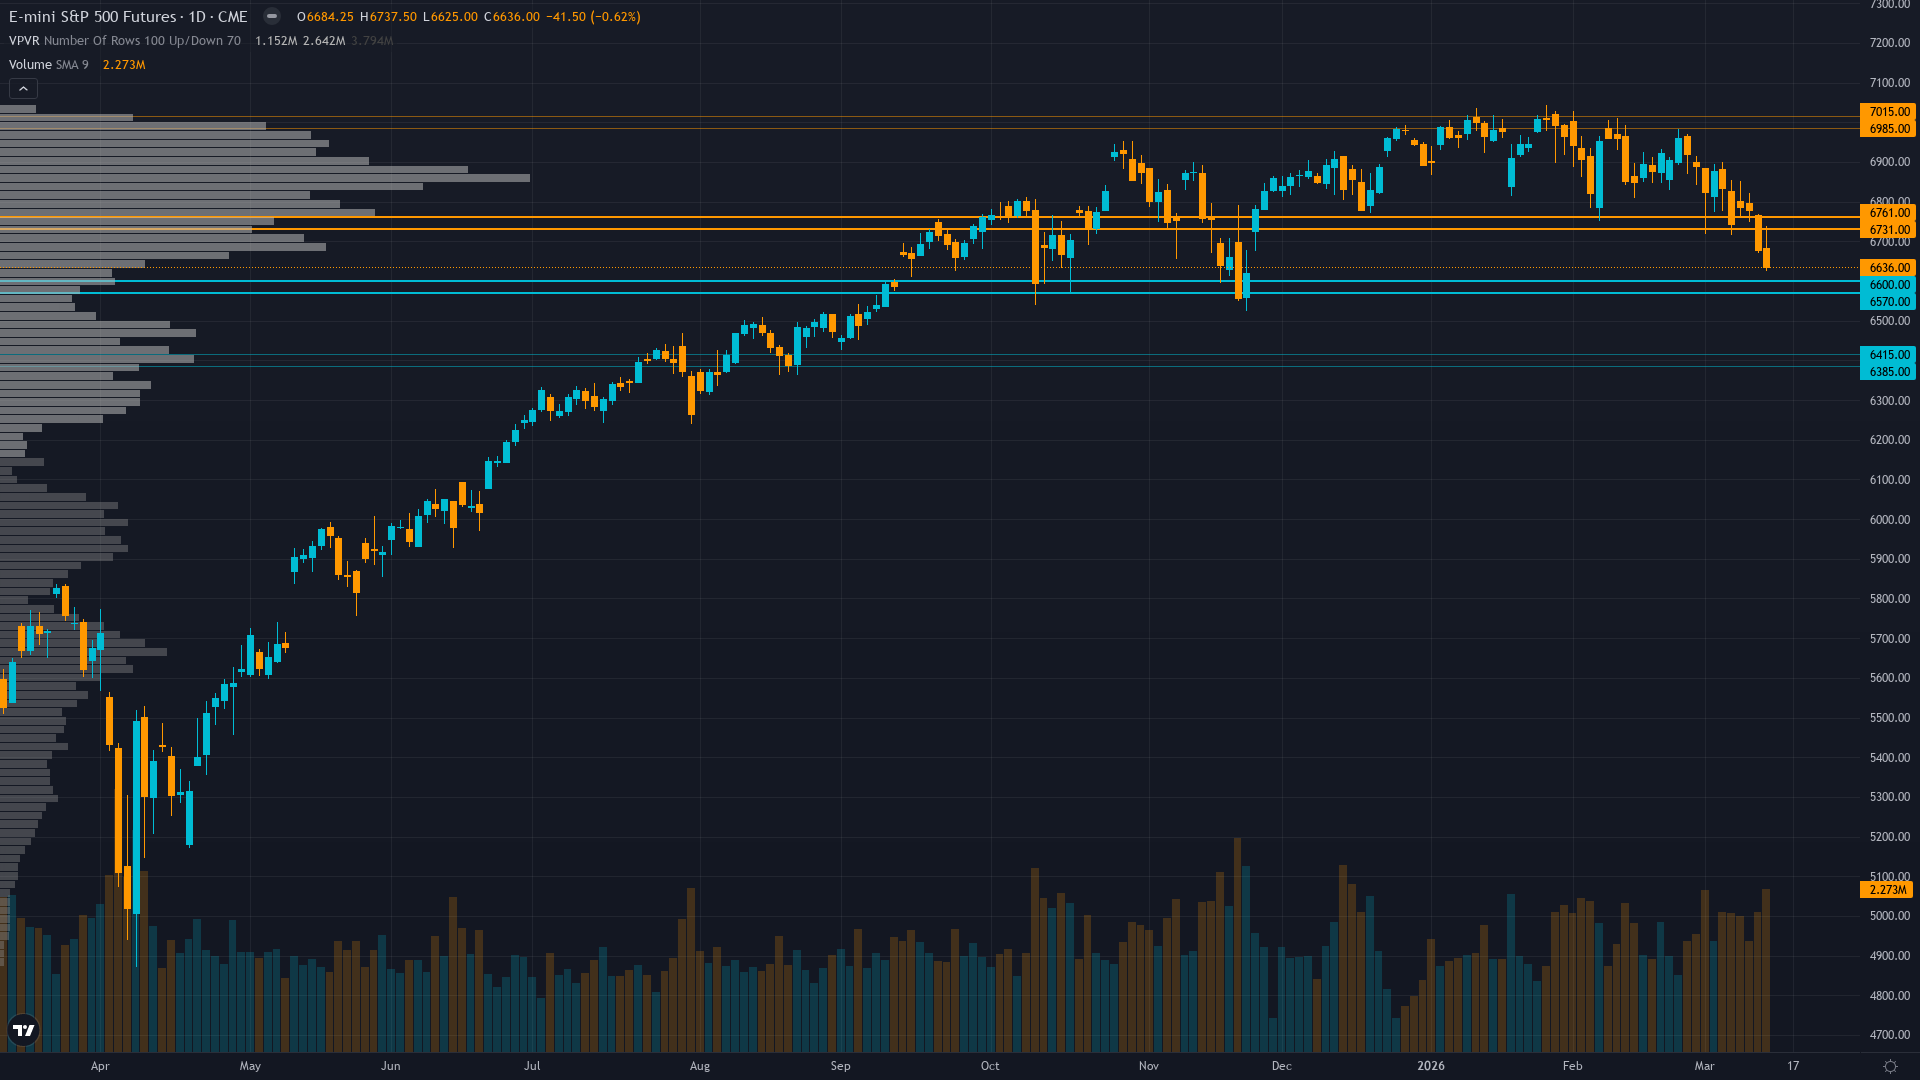
Trading at 6636 with a 0.62% dip, S&P 500 is giving back ground gradually. S&P 500 futures is in a breaking down market state, requiring careful assessment of current conditions.
Divided between extreme fear capitulation suggesting oversold bounce and technical breakdown continuation, majority positioning defensively into March 18-19 FOMC with elevated hedging despite contrarian sentiment signals
Forces in Play
Primary driver: VIX explosion to 27.18 representing 52% weekly surge from 19.28 creates extreme fear regime overwhelming technical structure as ES breaks critical 6791 support and tests 6650-6720 symmetry targets
Secondary factor: Sentiment capitulation with CNN Fear & Greed Index at 21.2 (extreme fear), AAII bears at 46.4% versus 31.9% bulls producing -14.5% spread, and multiple converging panic indicators suggesting contrarian setup formation
Additional influence: Technical breakdown confirmed below 50-day MA at 6746 and 200-day MA at 6851 with RSI 35.37 declining sharply yet not oversold, creating lower-high/lower-low structure with next support 6585
Economic backdrop: Fed at 3.50-3.75% after January 28 hawkish hold with March 18-19 FOMC 3 days away pricing 92%+ probability of hold, February CPI 2.4% YoY met expectations exactly providing no catalyst while ISM Services 56.1 shows expansion
Fundamental assessment: Forward PE 20.9-22 moderately overvalued versus 18.8 10-year average but earnings growth 14.7-15.3% expected for 2026 supports multiples, Q1 earnings season 4 weeks away critical catalyst to justify valuations
Technical Landscape
Critical breakdown - ES decisively below 50-day MA 6746 and 200-day MA 6851 with RSI 35.37 declining, confirmed lower-high/lower-low pattern targeting 6720 a=c symmetry then 6585 major support
Trend strength is low at 3/10, indicating weak directional conviction and potential for range-bound behaviour.
Risk-Reward Assessment
Primary risk: VIX panic expansion toward 30-35 if 6585 support fails triggering volatility-targeting fund systematic liquidation cascade testing 6400 major support in accelerated selloff with quarter-end forced selling amplifying (Probability: medium)
Primary opportunity: Extreme fear contrarian reversal rally reclaiming 6746-6850 resistance zone if VIX mean-reverts from 27.18 elevated reading and March FOMC provides dovish surprise or rhetoric softening from January hawkish stance (Timeframe: March 18-25 2026)
This week's edge: Market underestimating speed of VIX mean reversion from 27.18 elevated reading when sentiment extremes converge (Fear & Greed 21.2, AAII -14.5% spread, VIX term structure fear premium) historically preceding 3-7 day reversal windows, while overestimating technical breakdown severity given RSI 35.37 still above oversold and extreme positioning creates asymmetric reversal potential
Risk Environment
With vol at the 62th percentile over 90 days, ES futures is in a measured regime that doesn't require unusual adjustments. Volatility is expanding, with realised vol rising across timeframes. This typically signals increasing uncertainty and wider daily ranges ahead.
High volatility regime suggests 1.5-2.5% daily ES moves expected with current 6585-6746 range representing 2.4% width, breakdown below 6585 presents asymmetric expansion risk with potential 3-4% intraday swings on cascade selling while hold creates compression opportunity
Looking Forward
All eyes turn to FOMC two-day meeting March 18-19 with Powell press conference, markets price 92%+ hold probability but scrutinizing forward guidance after December hawkish recalibration projected only one 2026 cut on Wednesday 18 March, which carries enough weight to force a decisive directional move.
The week ahead for S&P 500 futures hinges on whether the prevailing breaking down regime can absorb the scheduled catalysts without a regime shift.
This analysis covers one dimension. Our full weekly report combines six specialist agents into a single actionable briefing with directional bias, key levels, and risk-opportunity matrix.
Start Free — Get the Market of the WeekFree weekly report · No credit card · Upgrade anytime


