S&P 500 COT & Institutional Positioning — Smart Money Analysis
S&P 500 institutional positioning: COT data, sentiment analysis and smart money flow assessment.

The Institutional Landscape
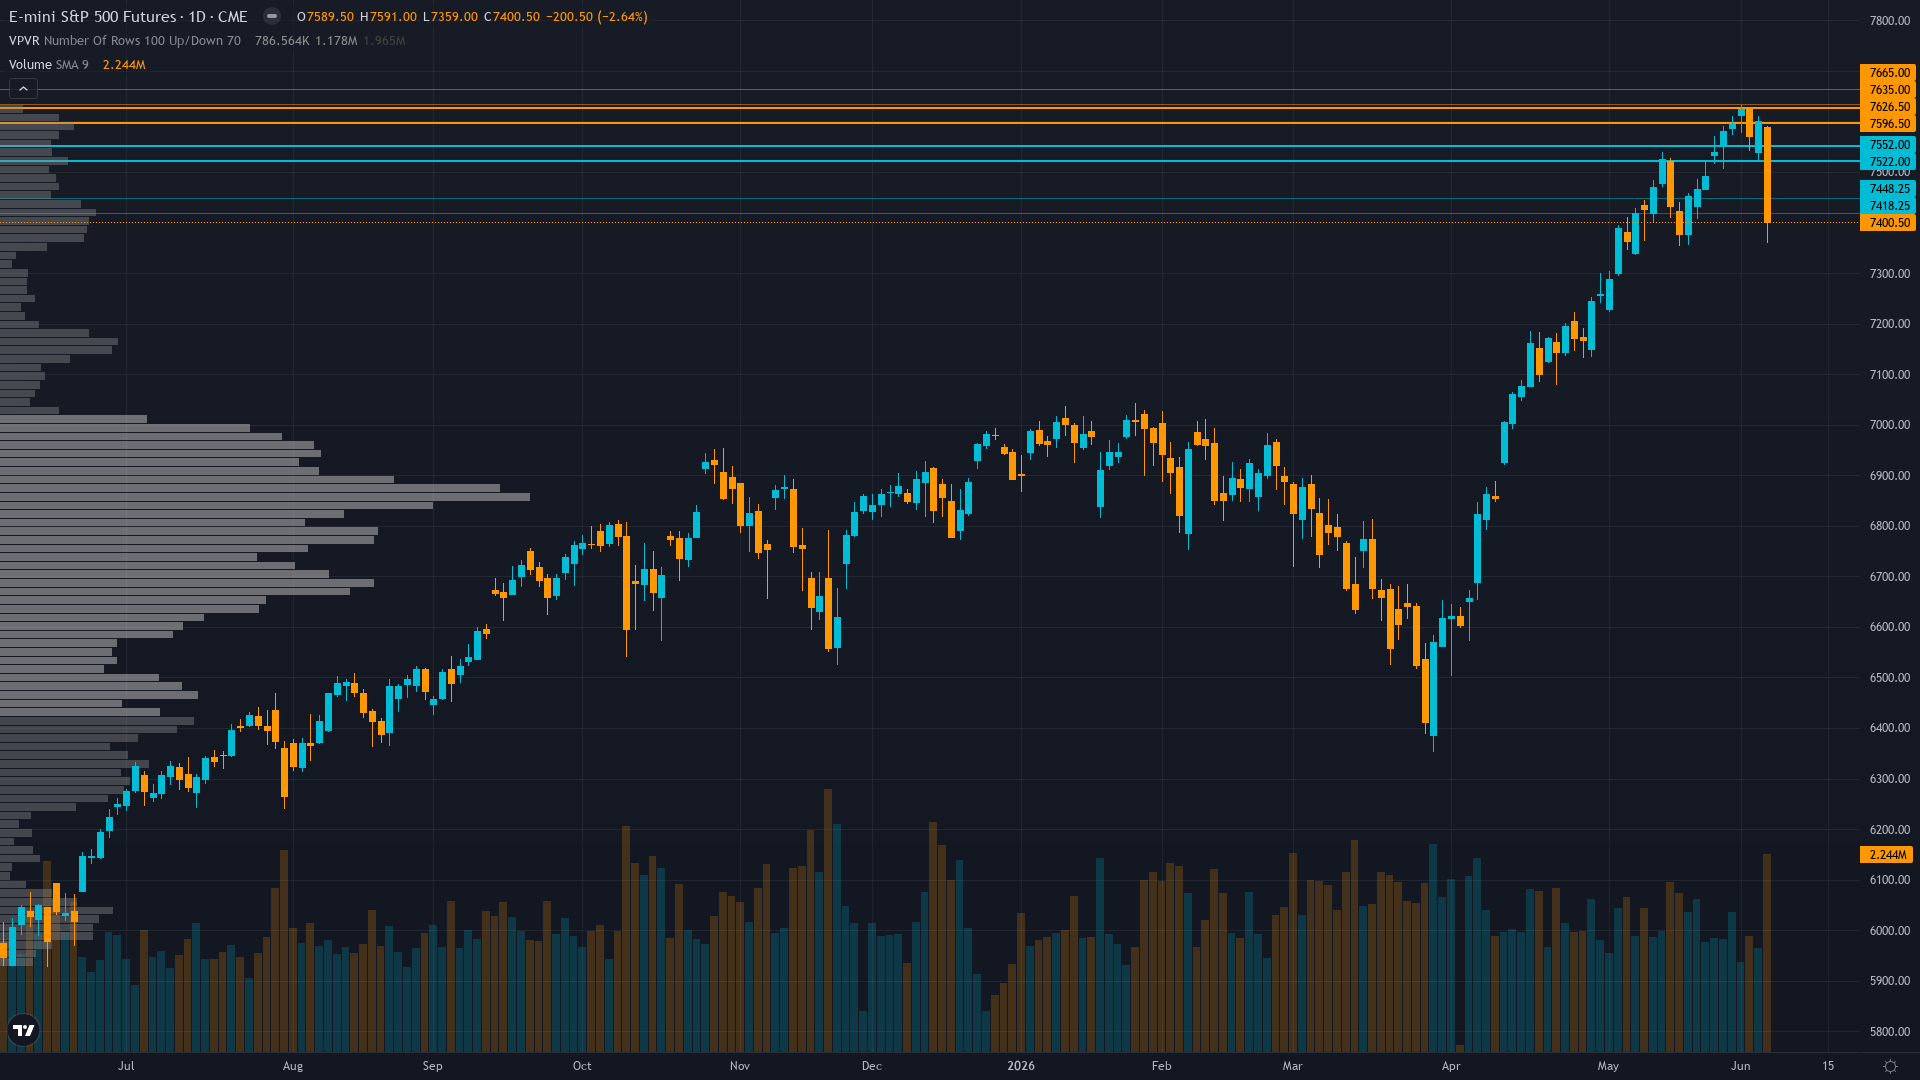
At 7400.5, S&P 500 has dropped 2.64% with sellers in control of the session.
June 5 selloff with 2.24M volume suggests institutional profit-taking from May 31 all-time highs as 200-day MA test creates decision point, stale May 19 COT data limits visibility but declining open interest signals position reduction ahead of June 16-17 FOMC binary catalyst
Market Sentiment
The sentiment picture for S&P 500 futures is evenly split, providing no contrarian signal in either direction. The next move will likely be event-driven.
What Options Markets Show
VIX explosion from 15.32 to 21.51 in single session (+39.68%) marks volatility regime change from compressed calm to elevated fear, SPX put/call 1.32 defensive hedging contrasts May 31 equity put/call 0.39 complacency showing institutional positioning reversal
Consensus vs MAD View
Market consensus: Divided between RSI oversold bounce buyers targeting 7,500-7,550 relief rally and breakdown sellers expecting 7,300-7,200 continuation as June 16-17 FOMC binary outcome determines resolution with majority positioning defensively after June 5 worst-day-of-year selloff
Primary driver: Violent June 5 VIX spike to 21.51 (+39.68%) shattered 6-week BULLISH consensus as ES collapsed from 7,589.50 all-time highs to 7,400.50 on May NFP beat (172K vs 85K) triggering Fed rate hike repricing and exposing extreme positioning vulnerability at critical 200-day MA 7,403.27 inflection
The Bottom Line on Positioning
The positioning mosaic for S&P index combines fear sentiment with expanding volatility conditions. Trend strength is low at 3/10, indicating weak directional conviction and potential for range-bound behaviour. Taken together, institutional behaviour, crowd psychology, and derivatives data frame the setup heading into the new week.
This analysis covers one dimension. Our full weekly report combines six specialist agents into a single actionable briefing with directional bias, key levels, and risk-opportunity matrix.
Start Free — Get the Market of the WeekFree weekly report · No credit card · Upgrade anytime