S&P 500 COT & Institutional Positioning — Smart Money Analysis
S&P 500 institutional positioning: COT data, sentiment analysis and smart money flow assessment.

The Institutional Landscape
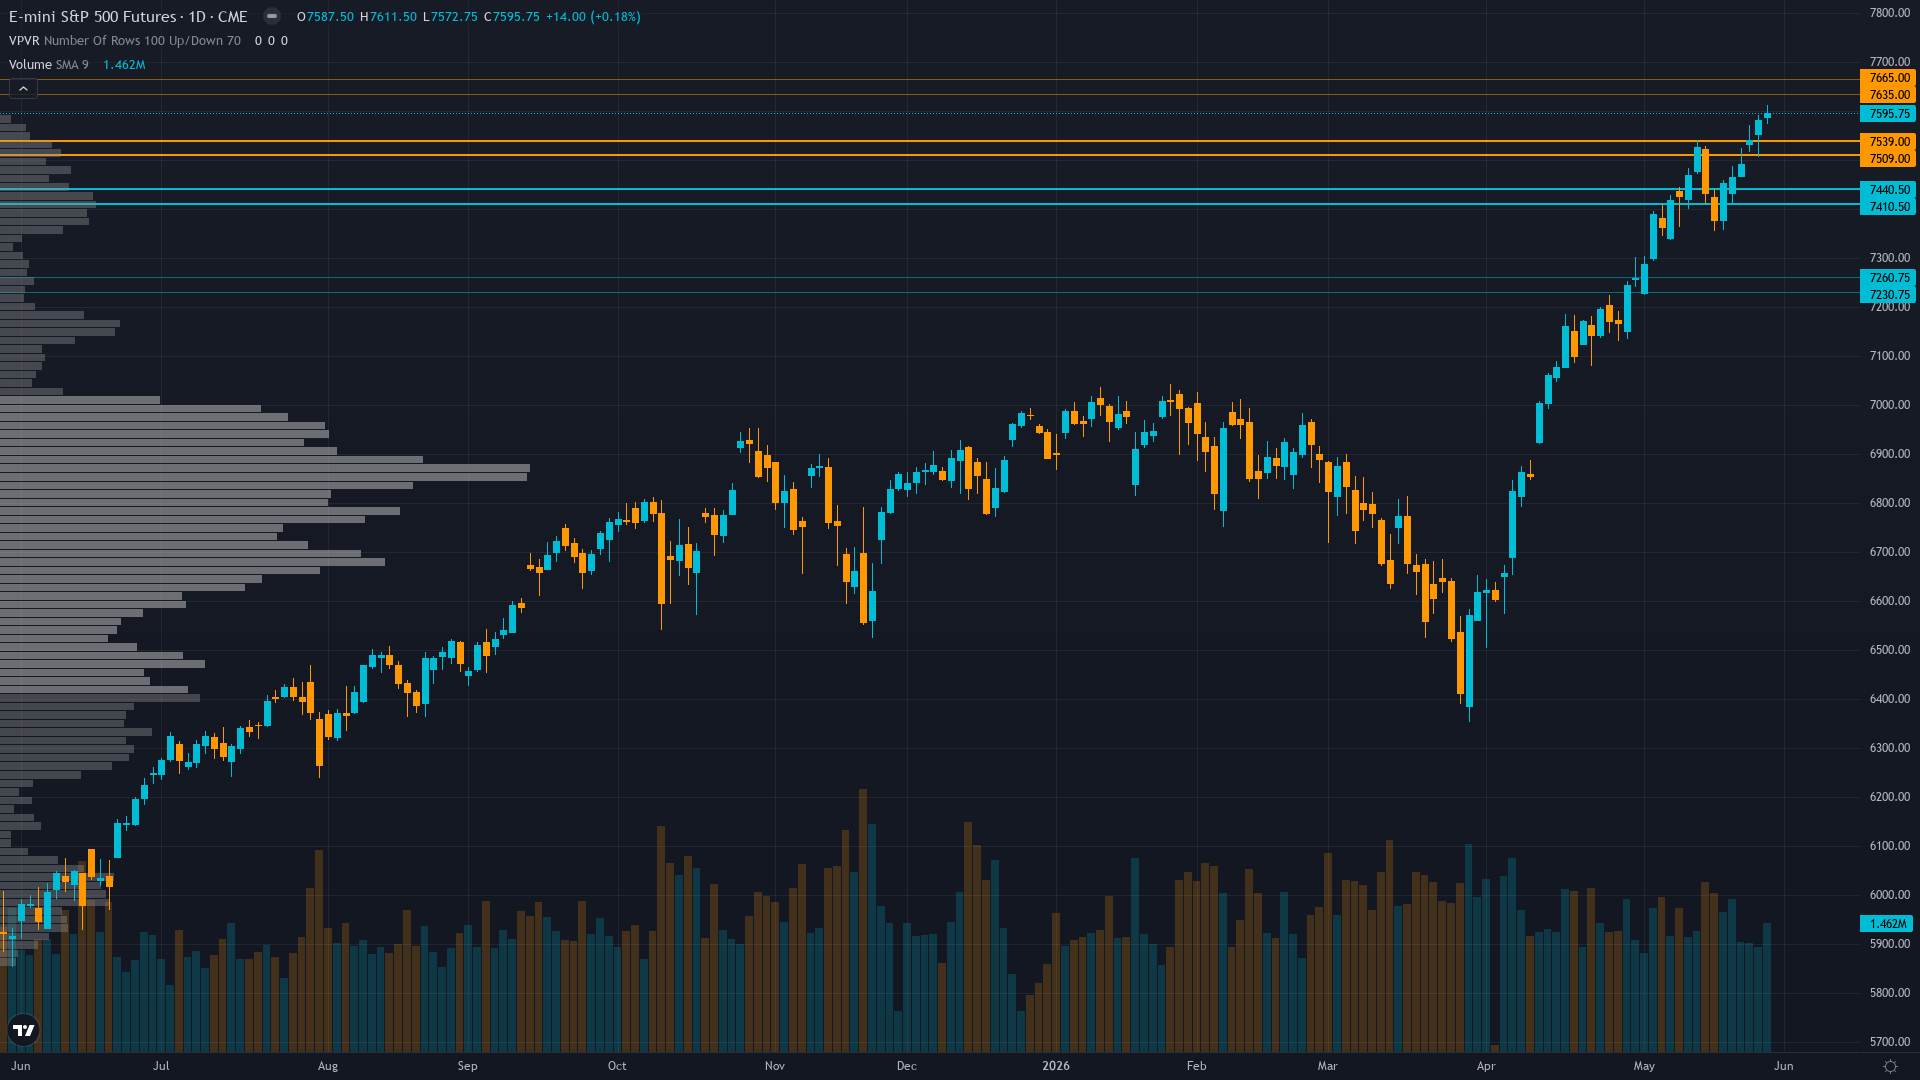
Trading at 7595.75 with a 0.18% uptick, S&P 500 is drifting higher without strong conviction.
Massive institutional accumulation evident via VOO absorbing $59B YTD inflows overtaking SPY as largest US ETF, but stale May 19 COT data (12 days old) limits precision on current positioning extremes as month-end May 31 TODAY and Q2 quarter-end June 30 create mechanical support
Market Consensus vs Our Analysis
Market consensus: Cautiously bullish on Q1 earnings strength and technical momentum into June FOMC but increasingly aware extreme put/call 0.39 complacency and 5-week bias streak create asymmetric downside risk if Fed delivers hawkish surprise
Primary driver: ES consolidates at fresh all-time highs of 7,595.75 (May 31, 2026) after five consecutive BULLISH weeks delivering +5.81% cumulative gain, as Q1 2026 earnings season validated exceptional 21% YoY growth with 89% of S&P 500 reported, yet extreme positioning with equity put/call ratio 0.39 (approximately 2.6 calls per put) and VIX compressed to 15.32 creates structural reversal vulnerability approaching June 16-17 FOMC catalyst
Contrarian Assessment
Desk sees extreme put/call 0.39 complacency at ATHs combined with 5-week bullish streak creating imminent mean-reversion risk window while market consensus prices continuation rally toward 7,650-7,750 on earnings strength and seasonal optimism, creating moderate divergence on near-term correction probability and positioning vulnerability that crowd underweights
Sentiment & Positioning
Sentiment around S&P 500 futures is neutral, with no extreme positioning on either side. This balanced state often resolves when a catalyst breaks the equilibrium.
Options Market Signal
VIX 15.32 compressed to near 52-week low 13.38 showing extreme calm, equity put/call 0.39 extremely low (approximately 2.6 calls per put) represents dangerous complacency with minimal hedging activity despite proximity to record highs creating asymmetric reversal vulnerability on any negative catalyst
Putting It Together
In summary, the positioning picture for S&P 500 reflects greed conviction levels set against a trending up market backdrop. With trend strength at 8/10, the prevailing move carries significant force behind it. The interplay between smart money activity, retail sentiment, and options market signals will shape how this positioning resolves.
This analysis covers one dimension. Our full weekly report combines six specialist agents into a single actionable briefing with directional bias, key levels, and risk-opportunity matrix.
Start Free — Get the Market of the WeekFree weekly report · No credit card · Upgrade anytime