S&P 500 COT & Institutional Positioning — Smart Money Analysis
S&P 500 institutional positioning: COT data, sentiment analysis and smart money flow assessment.

The Institutional Landscape
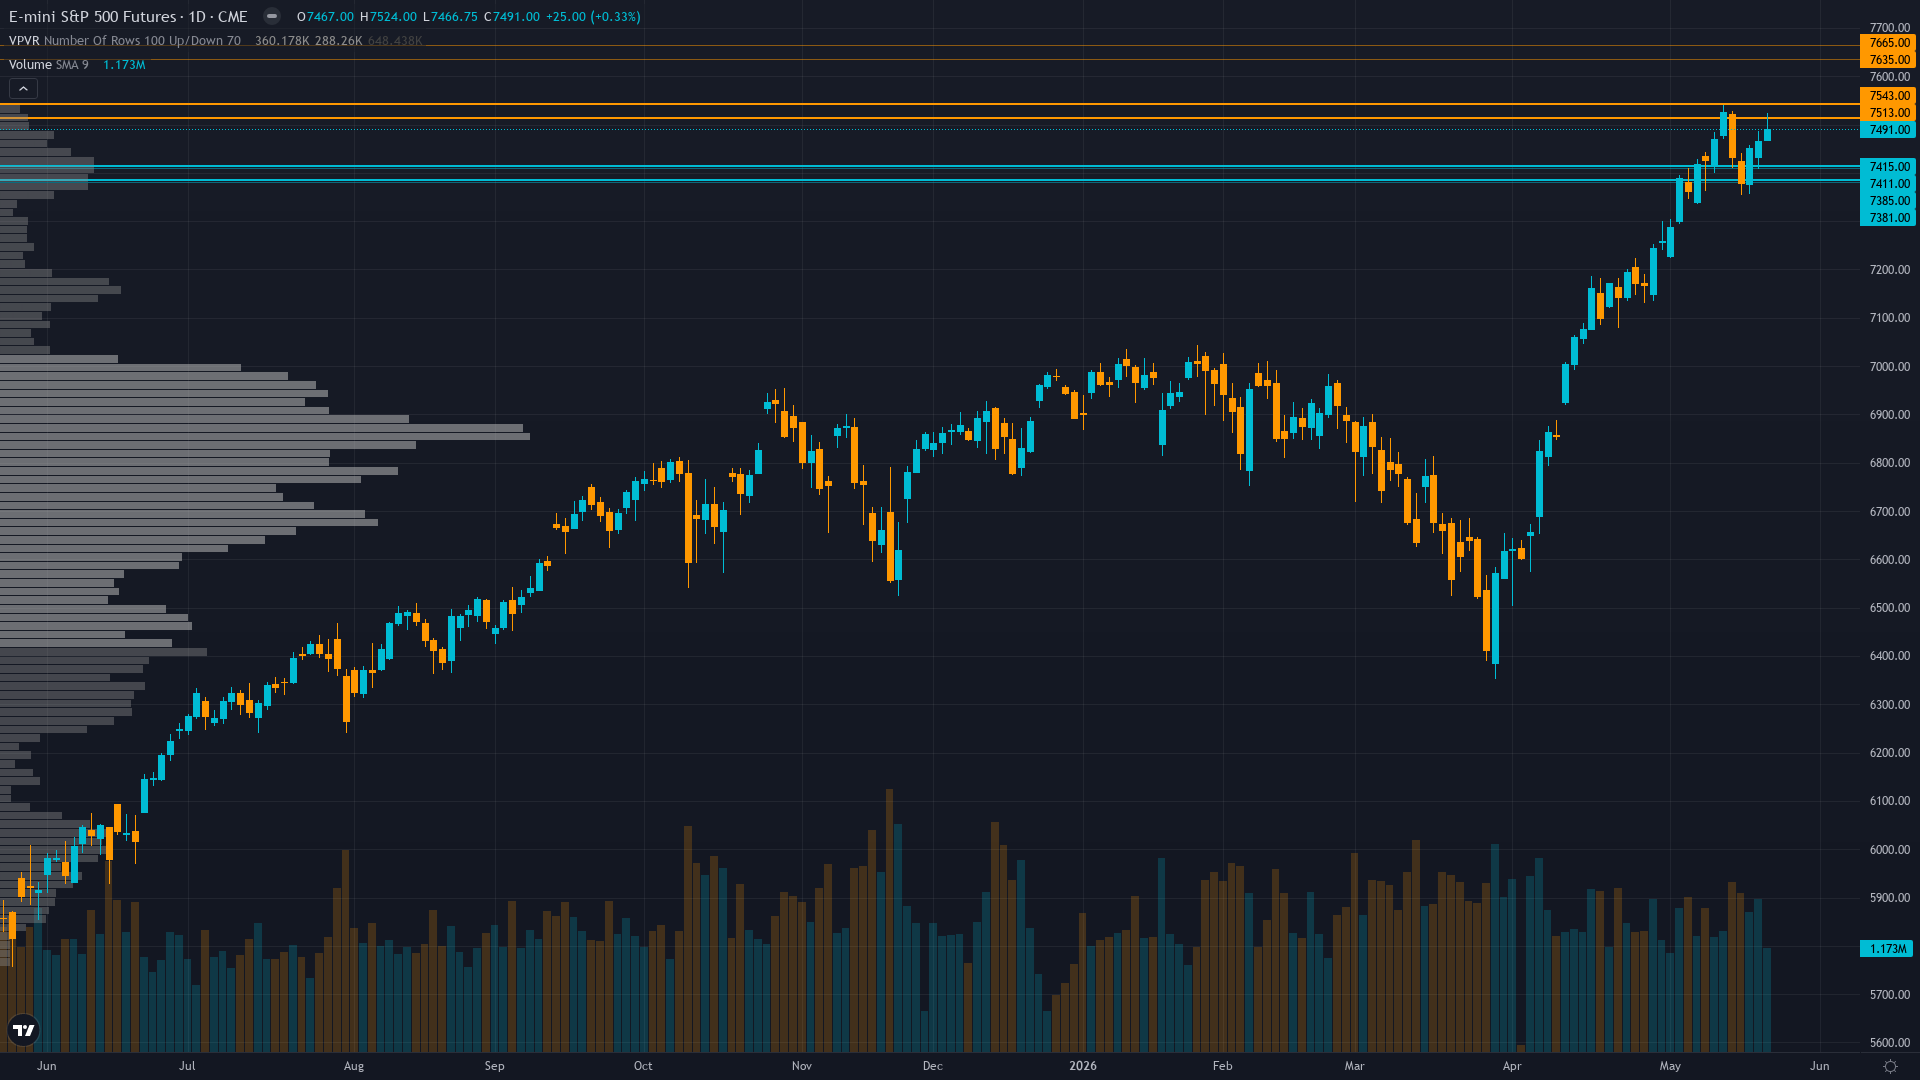
At 7491, S&P 500 has inched 0.33% higher in a measured advance.
Positive ETF flows of $38.98B week ending May 13 suggest continued accumulation despite stale COT data from March limiting visibility, month-end May 31 and quarter-end June 30 window dressing within 7-37 days creating potential mechanical flows
Market Sentiment
The sentiment picture for S&P 500 futures is evenly split, providing no contrarian signal in either direction. The next move will likely be event-driven.
What Options Markets Show
VIX 16.70 at lower end of 52-week range 13.38-35.30 showing extreme calm, equity put/call 0.49 extremely low representing dangerous complacency with minimal hedging activity despite proximity to all-time highs creating asymmetric downside vulnerability
Consensus vs MAD View
Market consensus: Cautiously bullish on Q1 earnings strength and technical momentum but increasingly aware extreme put/call 0.49 complacency and 7,500-7,524 resistance persistence create asymmetric downside risk into June 16-17 FOMC catalyst with new Chair uncertainty
Primary driver: ES consolidates at 7,491 near all-time highs after testing 7,524 intraday resistance, as four consecutive weeks of BULLISH calls delivered +4.13% cumulative gain validating Q1 earnings strength of 28.4% growth with record margins, yet Fed Chair Powell term expiration May 15 creates forward guidance vacuum entering June 16-17 FOMC binary catalyst
The Bottom Line on Positioning
The positioning mosaic for S&P index combines greed sentiment with stable volatility conditions. Trend strength registers at 7/10, suggesting meaningful but not extreme directional bias. Taken together, institutional behaviour, crowd psychology, and derivatives data frame the setup heading into the new week.
This analysis covers one dimension. Our full weekly report combines six specialist agents into a single actionable briefing with directional bias, key levels, and risk-opportunity matrix.
Start Free — Get the Market of the WeekFree weekly report · No credit card · Upgrade anytime