S&P 500 COT & Institutional Positioning — Smart Money Analysis
S&P 500 institutional positioning: COT data, sentiment analysis and smart money flow assessment.

Smart Money Positioning
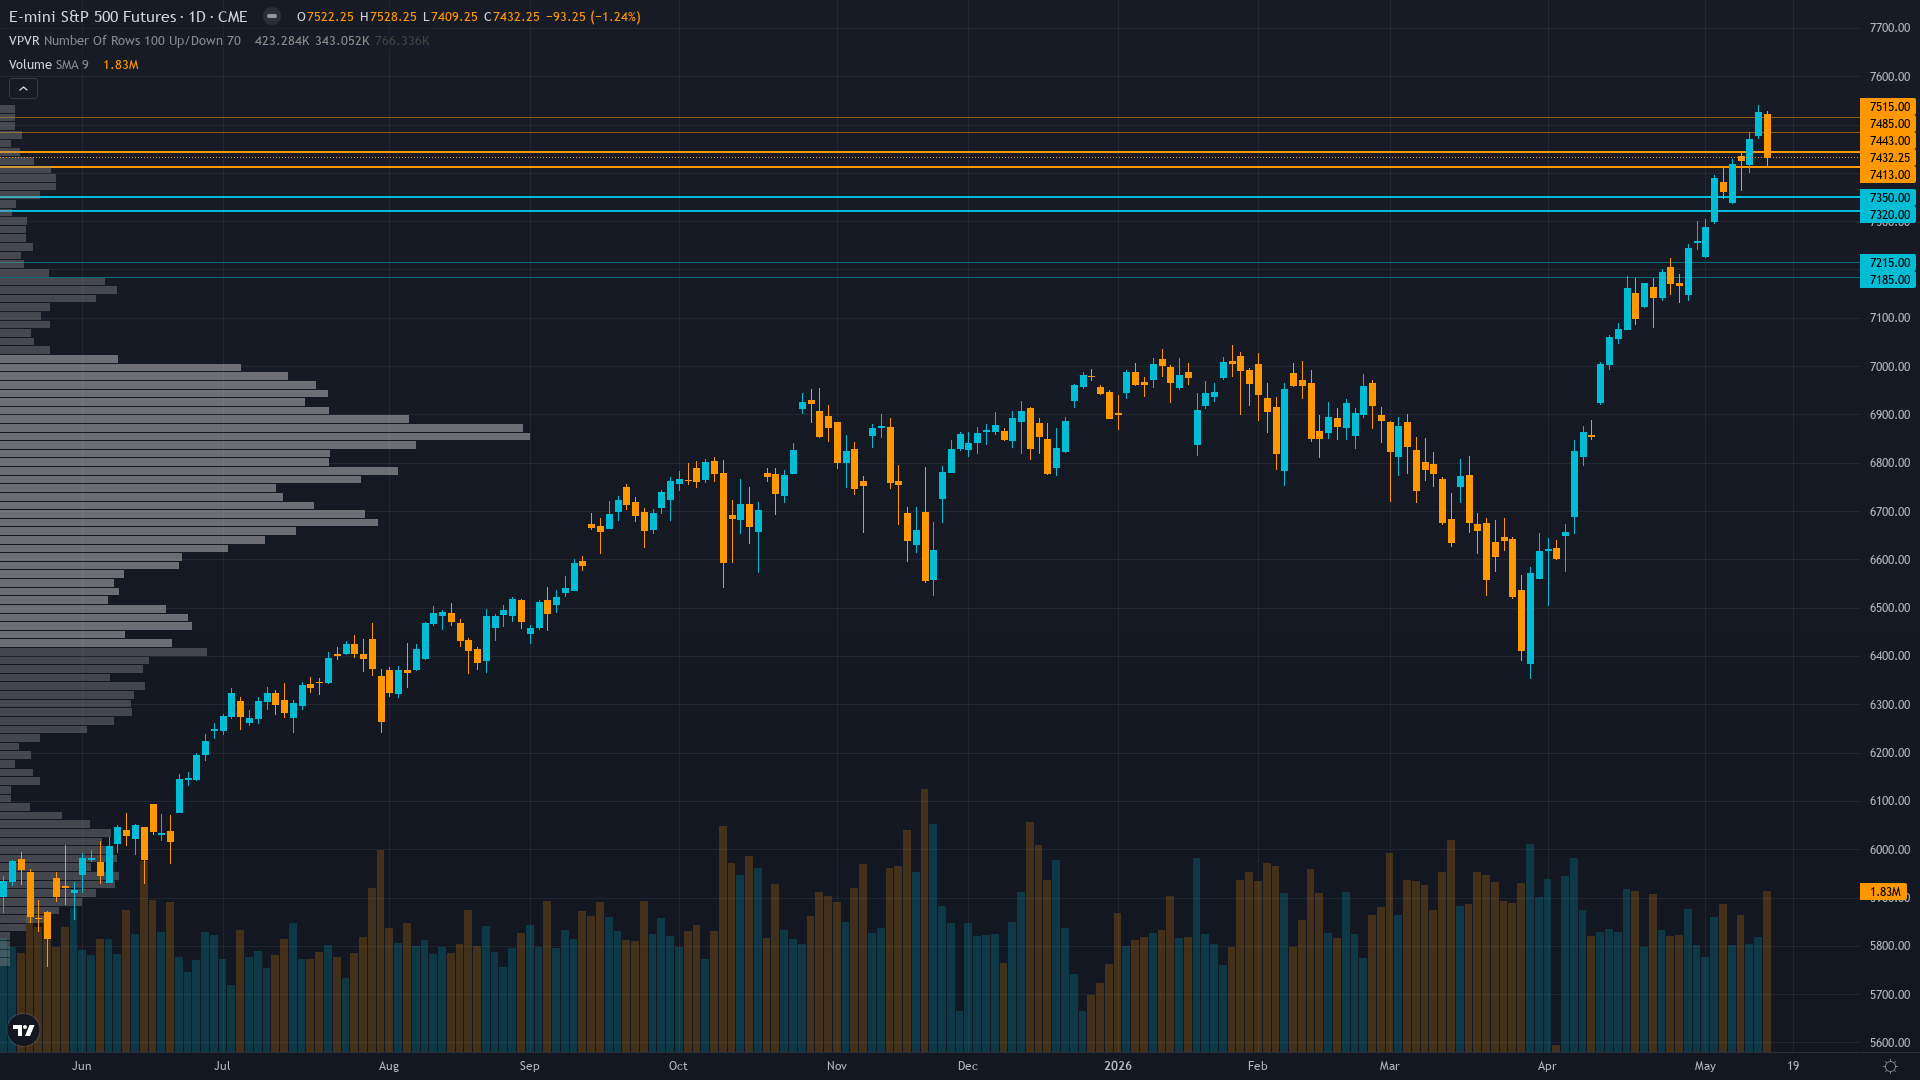
S&P 500 sits at 7432, having shed 1.20% as bears maintain the upper hand.
Limited visibility per stale COT data but SPY positive 1-year flows $11.04B suggest continued accumulation, though Fed Chair transition uncertainty may compress institutional risk-taking through June 16-17 FOMC
Sentiment & Positioning
Sentiment around S&P 500 futures is neutral, with no extreme positioning on either side. This balanced state often resolves when a catalyst breaks the equilibrium.
Options Market Signal
VIX 17.99 compressed near 52-week low 13.38 showing extreme calm despite proximity to record highs, equity put/call 0.59 represents dangerous complacency with minimal hedging creating structural reversal vulnerability on any negative catalyst
Where We Agree & Diverge
Market consensus: Cautiously bullish on Q1 earnings strength and labor resilience but increasingly aware RSI 71.18 approaching overbought and equity put/call 0.59 complacency create asymmetric downside risk, while Fed Chair transition uncertainty adds structural headwind through June 16-17 FOMC
Primary driver: ES at 7,432 pulled back sharply from 7,528 intraday high after testing psychological 7,500 resistance, as Fed Chair Powell's term expired May 15 creating forward guidance vacuum precisely when May 8 NFP beat (115K vs 62K) and Q1 earnings acceleration to 21% growth would justify policy clarity
Net Assessment
The institutional landscape for ES futures shows greed sentiment. Trend strength registers at 7/10, suggesting meaningful but not extreme directional bias. The combination of positioning data, sentiment, and options flow provides context for understanding where smart money is leaning heading into the week.
This analysis covers one dimension. Our full weekly report combines six specialist agents into a single actionable briefing with directional bias, key levels, and risk-opportunity matrix.
Start Free — Get the Market of the WeekFree weekly report · No credit card · Upgrade anytime