S&P 500 COT & Institutional Positioning — Smart Money Analysis
S&P 500 institutional positioning: COT data, sentiment analysis and smart money flow assessment.

Institutional Positioning
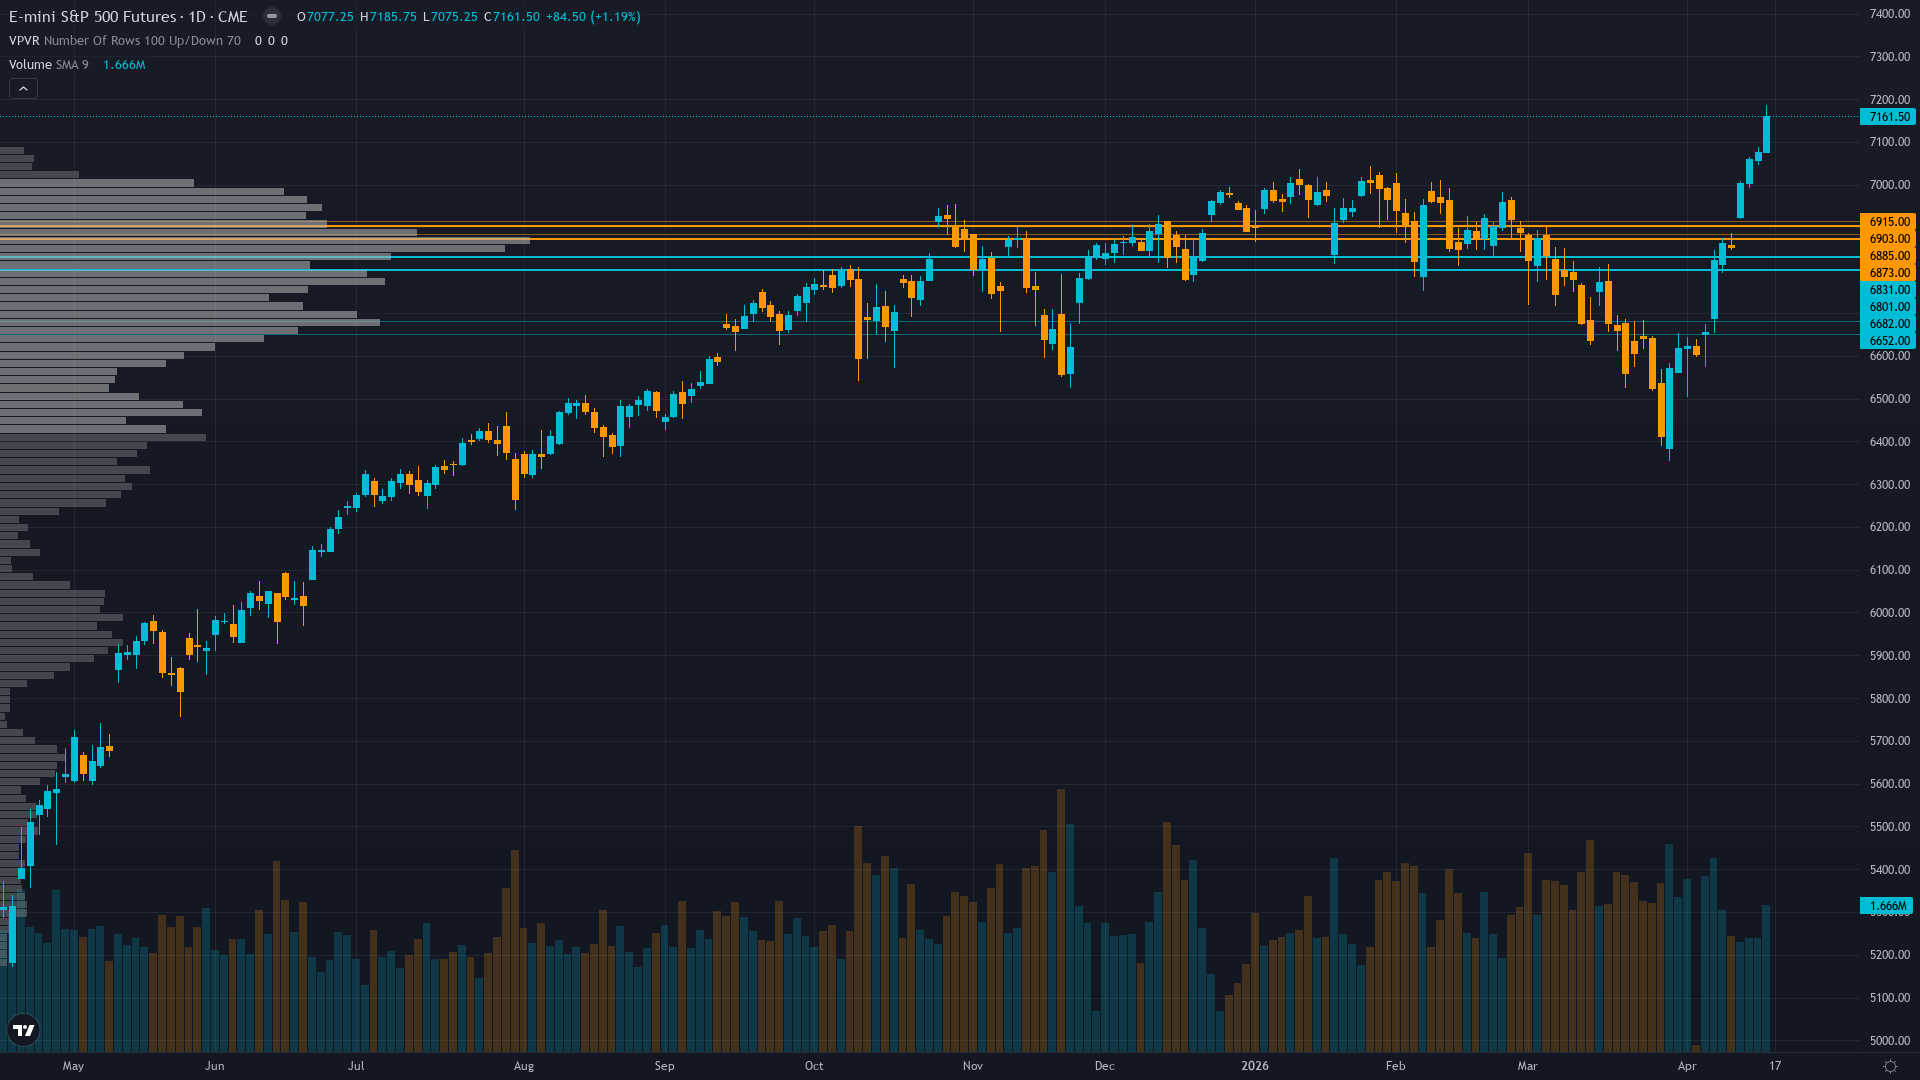
S&P 500 sits at 7159 after a 0.18% gain — a quiet move higher without aggressive momentum.
Mixed signals - stale COT data from April 7 limits visibility while ETF outflows of $10.76B week ended April 1 contradict surface strength but hedge funds posting best monthly performance in decade suggests skilled positioning working
Where We Agree & Diverge
Market consensus: Cautiously bullish on earnings season execution and seasonal strength but increasingly aware extreme overbought RSI 78.56 and complacent put/call 0.41 positioning create asymmetric mean-reversion risk near 7,200 psychological resistance
Primary driver: RSI 78.56 severely overbought creating extreme momentum divergence at all-time highs near 7,200 psychological resistance as S&P 500 surged 4.52% last week continuing March extreme fear capitulation rally but now entering technical exhaustion zone
Consensus Gaps
Desk sees extreme technical overbought RSI 78.56 with dangerous options complacency put/call 0.41 creating imminent mean-reversion risk while market remains positioned for earnings season continuation rally toward 7,200+ creating moderate divergence on timing and correction probability assessment
Sentiment Analysis
Positioning in S&P 500 futures is balanced, with neither bulls nor bears holding a decisive edge. Neutral sentiment typically precedes a directional catalyst.
Derivatives Intelligence
VIX 17.94 compressed creating calm surface but equity put/call 0.41 extremely low represents approximately 2.4 calls per put showing extreme complacency and minimal hedging activity creating asymmetric reversal risk on any negative catalyst
Net Assessment
The institutional landscape for ES futures shows greed sentiment. Trend strength registers at 7/10, suggesting meaningful but not extreme directional bias. The combination of positioning data, sentiment, and options flow provides context for understanding where smart money is leaning heading into the week.
This analysis covers one dimension. Our full weekly report combines six specialist agents into a single actionable briefing with directional bias, key levels, and risk-opportunity matrix.
Start Free — Get the Market of the WeekFree weekly report · No credit card · Upgrade anytime


