S&P 500 COT & Institutional Positioning — Smart Money Analysis
S&P 500 institutional positioning: COT data, sentiment analysis and smart money flow assessment.

Smart Money Positioning
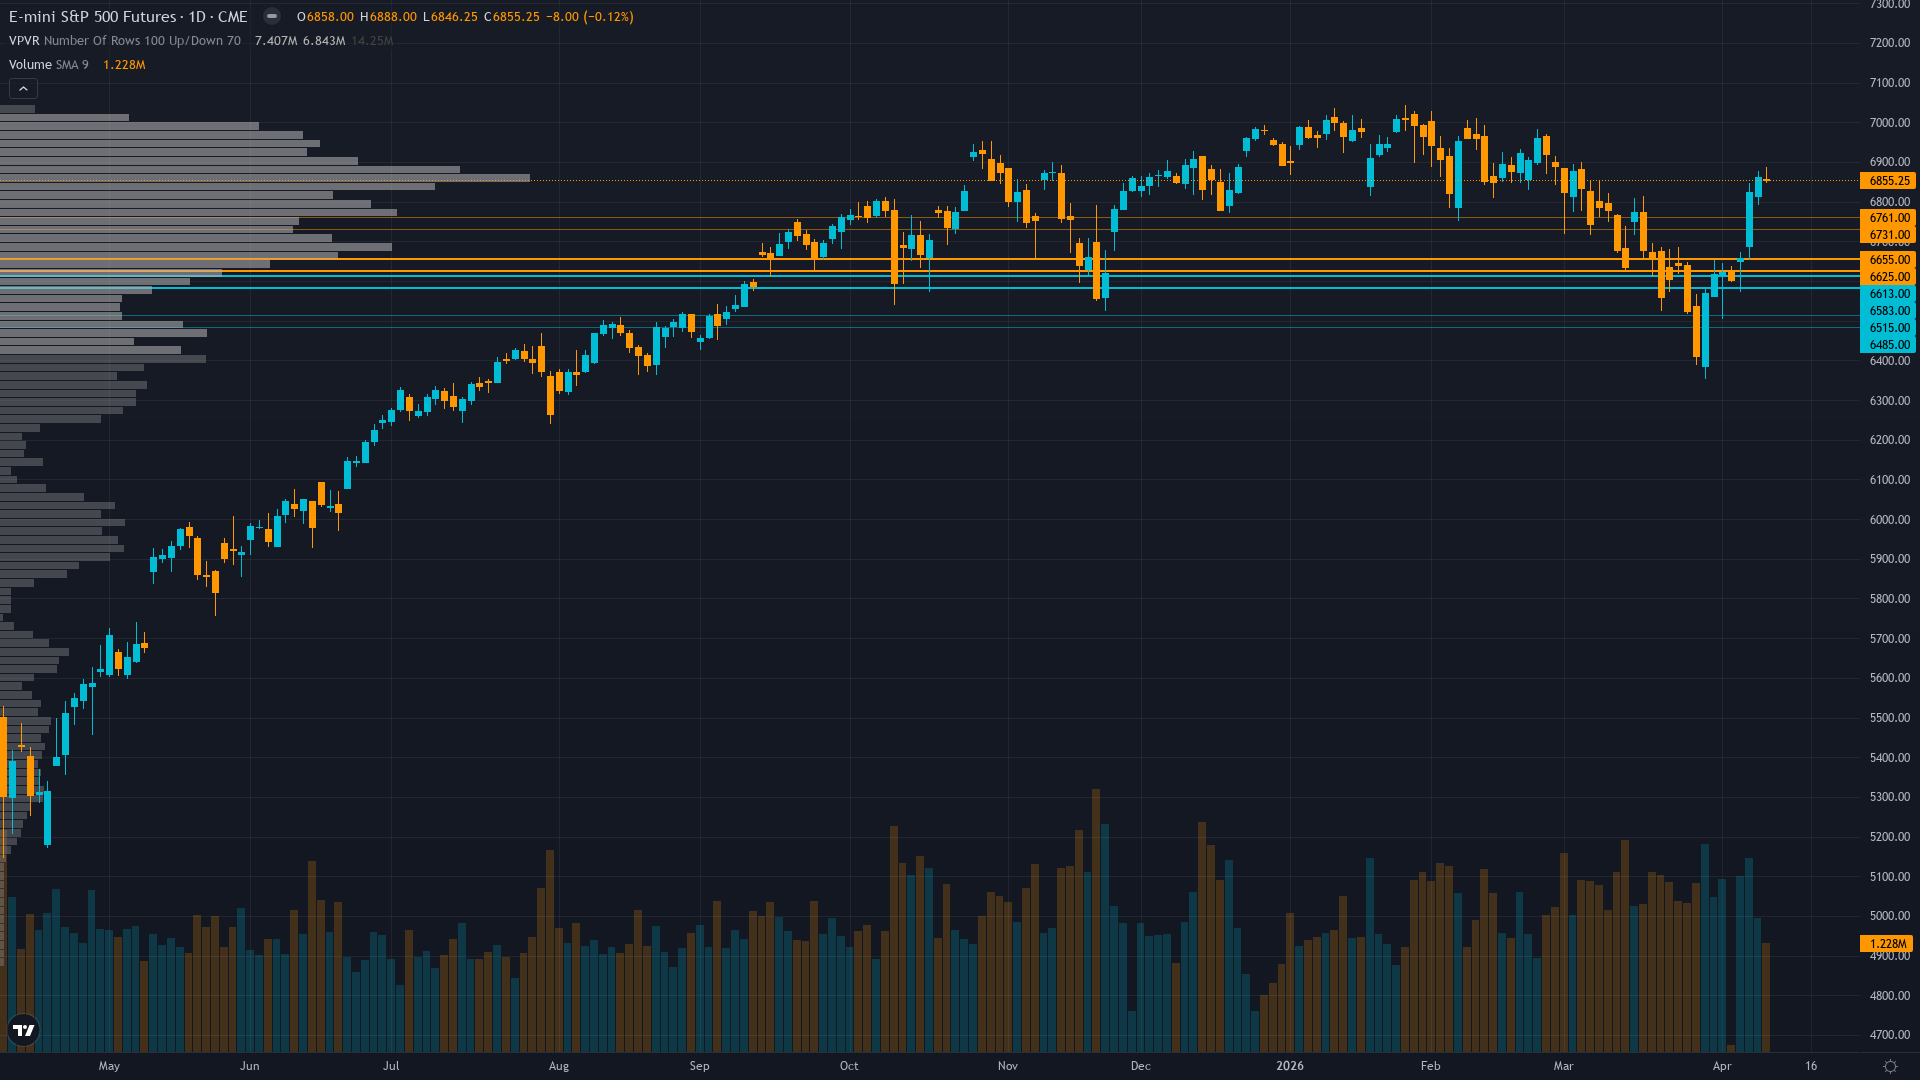
S&P 500 holds at 6855.25, off 0.12% in a modest retracement from recent levels.
Cautiously positioned after $5.7B ETF outflows on April 3 but relief rally suggests short covering and de-risking reversal - buyback blackout windows active during earnings season removing systematic bid support through late April
Consensus Check
Market consensus: Cautiously bullish on relief rally extension toward 6900-7000 but aware earnings season execution risk and elevated valuations create asymmetric downside if growth disappoints - positioning shows complacency developing with put/call 0.51 extremely low
Primary driver: Violent relief rally from March extreme fear washout - S&P 500 surged 3.82% week-over-week (6603 to 6856) on Iran ceasefire catalyst as VIX compressed from 31.05 peak to 19.23 current, marking best weekly gain since November 2025 on sentiment mean reversion
Divergence Assessment
Desk sees March extreme fear as genuine washout enabling sustained recovery toward 6900-7000 with 7/10 conviction while market remains cautious with defensive ETF flows and elevated hedging costs despite 3.82% relief rally, creating moderate divergence on recovery conviction and timing though equity put/call 0.51 shows complacency developing in options positioning
Market Sentiment
The sentiment picture for S&P 500 futures is evenly split, providing no contrarian signal in either direction. The next move will likely be event-driven.
What Options Markets Show
VIX compressed dramatically from 31.05 March peak to 19.23 current (-38% from high) showing fear unwinding rapidly, equity put/call 0.51 extremely low bullish positioning indicates complacency developing despite recent volatility
Positioning Summary
Putting the positioning picture together for SPX futures: sentiment is fear, trend strength sits at 7/10, reflecting a market that has directional bias but hasn't reached extreme conviction. The net assessment from institutional data, crowd positioning, and derivatives activity points to a market where the balance of forces tilts in a discernible direction.
This analysis covers one dimension. Our full weekly report combines six specialist agents into a single actionable briefing with directional bias, key levels, and risk-opportunity matrix.
Start Free — Get the Market of the WeekFree weekly report · No credit card · Upgrade anytime


